SlideShare a Scribd company logo
1 of 14
Download to read offline
¿QUÉ ES VISUALIZAR?
APREHENDER Y COMPRENDER LOS FENÓMENOS QUE NORMALMENTE NO
CAPTAMOS A SIMPLE VISTA PARA DESPUÉS INTERPRETARLOS GRÁFICAMENTE
TRADUCIR DATOS ABSTRACTOS, ESTADÍSTICOS, FENOMÉNICOS EN ESQUEMAS.
¿PARA QUÉ, PARA QUIÉN?
LA ESQUEMÁTICA PUEDE TRANSMITIR TODO TIPO DE INFORMACIÓN, DESDE
CUESTIONES CIÉNTIFICAS MUY COMPLEJAS HASTA INFORMACIÓN MUY SIMPLE,
SIEMPRE HAY QUE PLANTEARNOS LAS SIGUIENTES PREGUNTAS:

¿PARA QUIÉN?   DEFINIR EL PÚBLICO A QUIEN VA DIRIGIDO
                     A) ¿QUÉ NIVEL DE ALFABETIDAD VISUAL TIENE?
                     B) ¿ES PARA UN PÚBLICO GENERAL O ESPECIALIZADO?
                     C) ¿CUÁL ES SU NECESIDAD?


¿PARA QUÉ?     ¿QUÉ TIPO DE INFORMACIÓN TRANSMITE?
                    A) ¿ES INFORMACIÓN MUY ESPECÍFICA?
                    B) ¿ES DIDÁCTICA, ESPECIALIZADA O EXPLICATIVA?

¿DÓNDE?        ¿QUÉ TIPO DE MEDIO ES?
                    A) ¿ELECTRÓNICO O IMPRESO?
                    B) ¿EN CUÁNTO TIEMPO SE TIENE QUE LEER?
                    C) ¿CUÁL ES EL PERFIL (PERIÓDICO, REVISTA, ETC)?
CARACTERÍSTICAS
1
    LA ESQUEMÁTICA NO TIENE LA FUNCIÓN REPRESENTACIONAL QUE SON PROPIOS
    DE LA IMAGEN FIGURATIVA, NI LA FUNCIÓN DESCRIPTIVA DEL TEXTO ESCRITO


2
    LA PRIMERA CONDICIÓN DE UNA INFOGRAFÍA ES SU VALOR INFORMATIVO Y
    OBJETIVO, SU PRIORIDAD ES INFORMAR DE MANERA ÓPTIMA


3
    EL OBJETIVO DEL DISEÑO DE INFORMACIÓN ES LA TRANSMISIÓN DE
    CONOCIMIENTOS COMPRENSIBLES Y ÚTILES


4
    EL GRADO DE EFICACIA DEPENDE DE COMO EL INFOGRAFISTA ELIMINE LA
    COMPLEJIDAD DE LA INFORMACIÓN A TRANSMITIR Y LOS HAGA COMPRENSIBLES
    AL LECTOR DE MANERA INTUITIVA Y RÁPIDA


5
    NO TIENE FINES PUBLICITARIOS, NI DECORATIVOS, SU FINALIDAD SIEMPRE ES
    INFORMAR DE MANERA EFICAZ


6
    LA INFORMACIÓN VISUAL CONSISTE EN PRESENTAR MENSAJES UNEQUÍVOCOS,
    MONOSÉMICOS Y QUE NO ADMITAN OTRAS INTERPRETACIONES


7
    DEBE SER ATRACTIVA, ANIMAR AL OJO A LEER, LLEVAR UN RIGUROSO ORDEN Y
    RITMO DE LECTURA


8
    JOAN COSTA LLAMA A LA ESQUEMÁTICA “EL TERCER LENGUAJE” PUES NO
    CONSISTE EN UNA IMAGEN CONVENCIONAL, NI EN UN TEXTO. ES UN LENGUAJE
    LÓGICO, ESTRUCTURADO, CODIFICADO Y ABSTRACTO.
ANATOMÍA
                       UNA INFOGRAFÍA PUEDE O NO CONTENER TODOS ESTOS ELEMENTOS, SIN
                      EMBARGO DEBE EXISTIR UNA JERARQUÍA Y ORDEN ENTRE LOS ELEMENTOS


TEXTOS           1                                                                     11.
1. cabeza        2                                                                     IMAGEN
2. sumario       3                                                                     PRINCIPAL
3. subtítulos
4. cifras                                                                              12.
                             12           10                                           FLECHAS
                 5                                                                     O LÍNEAS


                                               11


                                                                  13


INFOGRÁMAS
                                                          4
5. gráficos
6. diagramas                      6
7. cronogramas
8. gráficas
                                                           8                           13.
9. mapas
                                                                       9               NOMENCLATURA
10. signos y
    símbolos
                             7
(cualquier gráfico                                                                     14.
o esquema que                                                                          FUENTES
aporte información)                                                    14              DE CONSULTA
RECURSOS GRÁFICOS
        EXISTEN ALGUNOS RECURSOS PROPIOS DE LA ESQUEMÁTICA, ESTOS AYUDAN
                 A EJEMPLIFICAR Y VISUALUZAR MEJOR LA INFORMACIÓN


                                                                           TRANSPARENCIA
ZOOM


CORTE
ESTUDIA CIERTAS
REGULARIDADES
DE LA MENTE
                               INFRALÓGICA VISUAL
                         CONSIDERACIONES PARA LA CORRECTA ARQUITECTURA DEL MENSAJE VISUAL
PARA LA APRE-
HENSIÓN DE LOS
                                                                          DOMINIO DEL
MENSAJES
                                                                          ÁNGULO RECTO
VISUALES                                                                  los elementos hechos
                                                                          por ángulos rectos
                                                                          tienen mejor forma
                                                                          que los compuestos
                                                                          por otros ángulos
COMPLEJIDAD
cuando el número
de elementos en un
espacio gráfico es                                                        CENTRALIDAD
superior a 7                                                              los elementos situa-
                                                                          dos en el centro son
                                                                          más importantes


CO RELACIÓN                                                               INFINIDAD
si 2 o más elementos                                                      si en una serie de
estan juntos, están                                                       elementos todos son
relacionados entre sí                                                     iguales


PERSPECTIVISTA
el elemento que se
encuentra en primer                                                       TEOREMA DE FRANCK
plano se capta en                                                         cuando en un conjunto de elementos todos
primer lugar en                                                           poseen una particularidad y de pronto hay un
relación con el más                                                       cambio cuantitativo, el ojo lo percibe a partir
lejano                                                                    del 34%


ÁNGULOS
los únicos que po-
seen auonomía son
los de 90º, 60º, 45º y
30º
ARQUITECTURA VISUAL
                            EXISTEN CIERTOS PROCESOS DE LECTURA QUE APLICAMOS DE MANERA
                         INCONSCIENTE, APRENDIDOS POR CONVENCIÓN. ESTOS PROCESOS ACELERAN
                            LA TRANSMISIÓN DE LA INFORMACIÓN. ESTOS DEBEN SER APLICADOS AL
                                       COMPONER EL MENSAJE PARA GENERAR ORDEN

JERARQUIZAR
LA INFORMACIÓN
básico para mostrar
al lector en que orden
leer y que información
es más importante

PRINCIPALIDAD

SENTIDO
DE LA LECTURA

SENTIDO EN QUE
GIRA EL RELOJ

DIRECCIÓN

RADIAL

ESCALA

CÓDIGOS
CROMÁTICOS
TIPOLOGÍA
GRÁFICO DE ESTADO
Muestra espacios o estados no tempo-
ral sino físicos. Nos puede mostrar cómo
es un espacio o resumirnos un conjunto de
espacios y la relación entre ellos. Los
gráficos de estado son los mapas
geográficos, mapas de transportes, planos
de edificios y perspectivas de espacios.
GRÁFICOS
ESTRUCTURALES
Muestran las relaciones jerárquicas en-
tre diferentes elementos, estos elemen-
tos pueden ser conceptos, categorías, per-
sonas… Gráficos estructurales son los
organigramas, árboles de Pert y los árbo-
les genealógicos.
GRÁFICOS
TEXTUALES
Muestran relaciones conceptuales no
jerárquicas entre diferentes elementos.
Éstos gráficos muestran relaciones entre
conceptos y los organiza a partir de otros
conceptos del mismo nivel entre ellos (no
jerárquicos). P/E: mapas conceptuales,
logigramas, semantogramas, cuadros
sinópticos.
GRÁFICO DE
RELACIONES
Muestra las relaciones entre un grupo
de personas. P/E: sociogramas
GRÁFICOS DE
RESULTADOS
Explican datos mediante las compara-
ciones entre elementos, estos gráficos
son los estadísticos. Se asocia un recurso
gráfico mayoritariamente de tamaño y /o
color para mostrar un grupo de datos y
poder compararlos. Gráficos de éste tipo
se usan para mostrar estadísticas.
GRÁFICOS
DE PROCESO
Muestran evoluciones temporales, con-
juntos de instantes e informan de pro-
cesos que ocurren en a lo largo de un es-
pacio de tiempo. Gráficos de éste tipo
pueden ser histogramas, líneas de tiempo,
instrucciones de uso, reconstrucciones
periodísticas de
sucesos.

More Related Content

Featured

2024 State of Marketing Report – by Hubspot
2024 State of Marketing Report – by Hubspot2024 State of Marketing Report – by Hubspot
2024 State of Marketing Report – by HubspotMarius Sescu
 
Everything You Need To Know About ChatGPT
Everything You Need To Know About ChatGPTEverything You Need To Know About ChatGPT
Everything You Need To Know About ChatGPTExpeed Software
 
Product Design Trends in 2024 | Teenage Engineerings
Product Design Trends in 2024 | Teenage EngineeringsProduct Design Trends in 2024 | Teenage Engineerings
Product Design Trends in 2024 | Teenage EngineeringsPixeldarts
 
How Race, Age and Gender Shape Attitudes Towards Mental Health
How Race, Age and Gender Shape Attitudes Towards Mental HealthHow Race, Age and Gender Shape Attitudes Towards Mental Health
How Race, Age and Gender Shape Attitudes Towards Mental HealthThinkNow
 
AI Trends in Creative Operations 2024 by Artwork Flow.pdf
AI Trends in Creative Operations 2024 by Artwork Flow.pdfAI Trends in Creative Operations 2024 by Artwork Flow.pdf
AI Trends in Creative Operations 2024 by Artwork Flow.pdfmarketingartwork
 
PEPSICO Presentation to CAGNY Conference Feb 2024
PEPSICO Presentation to CAGNY Conference Feb 2024PEPSICO Presentation to CAGNY Conference Feb 2024
PEPSICO Presentation to CAGNY Conference Feb 2024Neil Kimberley
 
Content Methodology: A Best Practices Report (Webinar)
Content Methodology: A Best Practices Report (Webinar)Content Methodology: A Best Practices Report (Webinar)
Content Methodology: A Best Practices Report (Webinar)contently
 
How to Prepare For a Successful Job Search for 2024
How to Prepare For a Successful Job Search for 2024How to Prepare For a Successful Job Search for 2024
How to Prepare For a Successful Job Search for 2024Albert Qian
 
Social Media Marketing Trends 2024 // The Global Indie Insights
Social Media Marketing Trends 2024 // The Global Indie InsightsSocial Media Marketing Trends 2024 // The Global Indie Insights
Social Media Marketing Trends 2024 // The Global Indie InsightsKurio // The Social Media Age(ncy)
 
Trends In Paid Search: Navigating The Digital Landscape In 2024
Trends In Paid Search: Navigating The Digital Landscape In 2024Trends In Paid Search: Navigating The Digital Landscape In 2024
Trends In Paid Search: Navigating The Digital Landscape In 2024Search Engine Journal
 
5 Public speaking tips from TED - Visualized summary
5 Public speaking tips from TED - Visualized summary5 Public speaking tips from TED - Visualized summary
5 Public speaking tips from TED - Visualized summarySpeakerHub
 
ChatGPT and the Future of Work - Clark Boyd
ChatGPT and the Future of Work - Clark Boyd ChatGPT and the Future of Work - Clark Boyd
ChatGPT and the Future of Work - Clark Boyd Clark Boyd
 
Getting into the tech field. what next
Getting into the tech field. what next Getting into the tech field. what next
Getting into the tech field. what next Tessa Mero
 
Google's Just Not That Into You: Understanding Core Updates & Search Intent
Google's Just Not That Into You: Understanding Core Updates & Search IntentGoogle's Just Not That Into You: Understanding Core Updates & Search Intent
Google's Just Not That Into You: Understanding Core Updates & Search IntentLily Ray
 
Time Management & Productivity - Best Practices
Time Management & Productivity -  Best PracticesTime Management & Productivity -  Best Practices
Time Management & Productivity - Best PracticesVit Horky
 
The six step guide to practical project management
The six step guide to practical project managementThe six step guide to practical project management
The six step guide to practical project managementMindGenius
 
Beginners Guide to TikTok for Search - Rachel Pearson - We are Tilt __ Bright...
Beginners Guide to TikTok for Search - Rachel Pearson - We are Tilt __ Bright...Beginners Guide to TikTok for Search - Rachel Pearson - We are Tilt __ Bright...
Beginners Guide to TikTok for Search - Rachel Pearson - We are Tilt __ Bright...RachelPearson36
 

Featured (20)

2024 State of Marketing Report – by Hubspot
2024 State of Marketing Report – by Hubspot2024 State of Marketing Report – by Hubspot
2024 State of Marketing Report – by Hubspot
 
Everything You Need To Know About ChatGPT
Everything You Need To Know About ChatGPTEverything You Need To Know About ChatGPT
Everything You Need To Know About ChatGPT
 
Product Design Trends in 2024 | Teenage Engineerings
Product Design Trends in 2024 | Teenage EngineeringsProduct Design Trends in 2024 | Teenage Engineerings
Product Design Trends in 2024 | Teenage Engineerings
 
How Race, Age and Gender Shape Attitudes Towards Mental Health
How Race, Age and Gender Shape Attitudes Towards Mental HealthHow Race, Age and Gender Shape Attitudes Towards Mental Health
How Race, Age and Gender Shape Attitudes Towards Mental Health
 
AI Trends in Creative Operations 2024 by Artwork Flow.pdf
AI Trends in Creative Operations 2024 by Artwork Flow.pdfAI Trends in Creative Operations 2024 by Artwork Flow.pdf
AI Trends in Creative Operations 2024 by Artwork Flow.pdf
 
Skeleton Culture Code
Skeleton Culture CodeSkeleton Culture Code
Skeleton Culture Code
 
PEPSICO Presentation to CAGNY Conference Feb 2024
PEPSICO Presentation to CAGNY Conference Feb 2024PEPSICO Presentation to CAGNY Conference Feb 2024
PEPSICO Presentation to CAGNY Conference Feb 2024
 
Content Methodology: A Best Practices Report (Webinar)
Content Methodology: A Best Practices Report (Webinar)Content Methodology: A Best Practices Report (Webinar)
Content Methodology: A Best Practices Report (Webinar)
 
How to Prepare For a Successful Job Search for 2024
How to Prepare For a Successful Job Search for 2024How to Prepare For a Successful Job Search for 2024
How to Prepare For a Successful Job Search for 2024
 
Social Media Marketing Trends 2024 // The Global Indie Insights
Social Media Marketing Trends 2024 // The Global Indie InsightsSocial Media Marketing Trends 2024 // The Global Indie Insights
Social Media Marketing Trends 2024 // The Global Indie Insights
 
Trends In Paid Search: Navigating The Digital Landscape In 2024
Trends In Paid Search: Navigating The Digital Landscape In 2024Trends In Paid Search: Navigating The Digital Landscape In 2024
Trends In Paid Search: Navigating The Digital Landscape In 2024
 
5 Public speaking tips from TED - Visualized summary
5 Public speaking tips from TED - Visualized summary5 Public speaking tips from TED - Visualized summary
5 Public speaking tips from TED - Visualized summary
 
ChatGPT and the Future of Work - Clark Boyd
ChatGPT and the Future of Work - Clark Boyd ChatGPT and the Future of Work - Clark Boyd
ChatGPT and the Future of Work - Clark Boyd
 
Getting into the tech field. what next
Getting into the tech field. what next Getting into the tech field. what next
Getting into the tech field. what next
 
Google's Just Not That Into You: Understanding Core Updates & Search Intent
Google's Just Not That Into You: Understanding Core Updates & Search IntentGoogle's Just Not That Into You: Understanding Core Updates & Search Intent
Google's Just Not That Into You: Understanding Core Updates & Search Intent
 
How to have difficult conversations
How to have difficult conversations How to have difficult conversations
How to have difficult conversations
 
Introduction to Data Science
Introduction to Data ScienceIntroduction to Data Science
Introduction to Data Science
 
Time Management & Productivity - Best Practices
Time Management & Productivity -  Best PracticesTime Management & Productivity -  Best Practices
Time Management & Productivity - Best Practices
 
The six step guide to practical project management
The six step guide to practical project managementThe six step guide to practical project management
The six step guide to practical project management
 
Beginners Guide to TikTok for Search - Rachel Pearson - We are Tilt __ Bright...
Beginners Guide to TikTok for Search - Rachel Pearson - We are Tilt __ Bright...Beginners Guide to TikTok for Search - Rachel Pearson - We are Tilt __ Bright...
Beginners Guide to TikTok for Search - Rachel Pearson - We are Tilt __ Bright...
 

Anatomia de la info

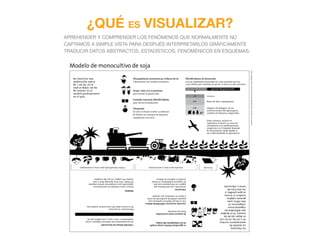
  • 1. ¿QUÉ ES VISUALIZAR? APREHENDER Y COMPRENDER LOS FENÓMENOS QUE NORMALMENTE NO CAPTAMOS A SIMPLE VISTA PARA DESPUÉS INTERPRETARLOS GRÁFICAMENTE TRADUCIR DATOS ABSTRACTOS, ESTADÍSTICOS, FENOMÉNICOS EN ESQUEMAS.
  • 2. ¿PARA QUÉ, PARA QUIÉN? LA ESQUEMÁTICA PUEDE TRANSMITIR TODO TIPO DE INFORMACIÓN, DESDE CUESTIONES CIÉNTIFICAS MUY COMPLEJAS HASTA INFORMACIÓN MUY SIMPLE, SIEMPRE HAY QUE PLANTEARNOS LAS SIGUIENTES PREGUNTAS: ¿PARA QUIÉN? DEFINIR EL PÚBLICO A QUIEN VA DIRIGIDO A) ¿QUÉ NIVEL DE ALFABETIDAD VISUAL TIENE? B) ¿ES PARA UN PÚBLICO GENERAL O ESPECIALIZADO? C) ¿CUÁL ES SU NECESIDAD? ¿PARA QUÉ? ¿QUÉ TIPO DE INFORMACIÓN TRANSMITE? A) ¿ES INFORMACIÓN MUY ESPECÍFICA? B) ¿ES DIDÁCTICA, ESPECIALIZADA O EXPLICATIVA? ¿DÓNDE? ¿QUÉ TIPO DE MEDIO ES? A) ¿ELECTRÓNICO O IMPRESO? B) ¿EN CUÁNTO TIEMPO SE TIENE QUE LEER? C) ¿CUÁL ES EL PERFIL (PERIÓDICO, REVISTA, ETC)?
  • 3. CARACTERÍSTICAS 1 LA ESQUEMÁTICA NO TIENE LA FUNCIÓN REPRESENTACIONAL QUE SON PROPIOS DE LA IMAGEN FIGURATIVA, NI LA FUNCIÓN DESCRIPTIVA DEL TEXTO ESCRITO 2 LA PRIMERA CONDICIÓN DE UNA INFOGRAFÍA ES SU VALOR INFORMATIVO Y OBJETIVO, SU PRIORIDAD ES INFORMAR DE MANERA ÓPTIMA 3 EL OBJETIVO DEL DISEÑO DE INFORMACIÓN ES LA TRANSMISIÓN DE CONOCIMIENTOS COMPRENSIBLES Y ÚTILES 4 EL GRADO DE EFICACIA DEPENDE DE COMO EL INFOGRAFISTA ELIMINE LA COMPLEJIDAD DE LA INFORMACIÓN A TRANSMITIR Y LOS HAGA COMPRENSIBLES AL LECTOR DE MANERA INTUITIVA Y RÁPIDA 5 NO TIENE FINES PUBLICITARIOS, NI DECORATIVOS, SU FINALIDAD SIEMPRE ES INFORMAR DE MANERA EFICAZ 6 LA INFORMACIÓN VISUAL CONSISTE EN PRESENTAR MENSAJES UNEQUÍVOCOS, MONOSÉMICOS Y QUE NO ADMITAN OTRAS INTERPRETACIONES 7 DEBE SER ATRACTIVA, ANIMAR AL OJO A LEER, LLEVAR UN RIGUROSO ORDEN Y RITMO DE LECTURA 8 JOAN COSTA LLAMA A LA ESQUEMÁTICA “EL TERCER LENGUAJE” PUES NO CONSISTE EN UNA IMAGEN CONVENCIONAL, NI EN UN TEXTO. ES UN LENGUAJE LÓGICO, ESTRUCTURADO, CODIFICADO Y ABSTRACTO.
  • 4. ANATOMÍA UNA INFOGRAFÍA PUEDE O NO CONTENER TODOS ESTOS ELEMENTOS, SIN EMBARGO DEBE EXISTIR UNA JERARQUÍA Y ORDEN ENTRE LOS ELEMENTOS TEXTOS 1 11. 1. cabeza 2 IMAGEN 2. sumario 3 PRINCIPAL 3. subtítulos 4. cifras 12. 12 10 FLECHAS 5 O LÍNEAS 11 13 INFOGRÁMAS 4 5. gráficos 6. diagramas 6 7. cronogramas 8. gráficas 8 13. 9. mapas 9 NOMENCLATURA 10. signos y símbolos 7 (cualquier gráfico 14. o esquema que FUENTES aporte información) 14 DE CONSULTA
  • 5. RECURSOS GRÁFICOS EXISTEN ALGUNOS RECURSOS PROPIOS DE LA ESQUEMÁTICA, ESTOS AYUDAN A EJEMPLIFICAR Y VISUALUZAR MEJOR LA INFORMACIÓN TRANSPARENCIA ZOOM CORTE
  • 6. ESTUDIA CIERTAS REGULARIDADES DE LA MENTE INFRALÓGICA VISUAL CONSIDERACIONES PARA LA CORRECTA ARQUITECTURA DEL MENSAJE VISUAL PARA LA APRE- HENSIÓN DE LOS DOMINIO DEL MENSAJES ÁNGULO RECTO VISUALES los elementos hechos por ángulos rectos tienen mejor forma que los compuestos por otros ángulos COMPLEJIDAD cuando el número de elementos en un espacio gráfico es CENTRALIDAD superior a 7 los elementos situa- dos en el centro son más importantes CO RELACIÓN INFINIDAD si 2 o más elementos si en una serie de estan juntos, están elementos todos son relacionados entre sí iguales PERSPECTIVISTA el elemento que se encuentra en primer TEOREMA DE FRANCK plano se capta en cuando en un conjunto de elementos todos primer lugar en poseen una particularidad y de pronto hay un relación con el más cambio cuantitativo, el ojo lo percibe a partir lejano del 34% ÁNGULOS los únicos que po- seen auonomía son los de 90º, 60º, 45º y 30º
  • 7. ARQUITECTURA VISUAL EXISTEN CIERTOS PROCESOS DE LECTURA QUE APLICAMOS DE MANERA INCONSCIENTE, APRENDIDOS POR CONVENCIÓN. ESTOS PROCESOS ACELERAN LA TRANSMISIÓN DE LA INFORMACIÓN. ESTOS DEBEN SER APLICADOS AL COMPONER EL MENSAJE PARA GENERAR ORDEN JERARQUIZAR LA INFORMACIÓN básico para mostrar al lector en que orden leer y que información es más importante PRINCIPALIDAD SENTIDO DE LA LECTURA SENTIDO EN QUE GIRA EL RELOJ DIRECCIÓN RADIAL ESCALA CÓDIGOS CROMÁTICOS
  • 9. GRÁFICO DE ESTADO Muestra espacios o estados no tempo- ral sino físicos. Nos puede mostrar cómo es un espacio o resumirnos un conjunto de espacios y la relación entre ellos. Los gráficos de estado son los mapas geográficos, mapas de transportes, planos de edificios y perspectivas de espacios.
  • 10. GRÁFICOS ESTRUCTURALES Muestran las relaciones jerárquicas en- tre diferentes elementos, estos elemen- tos pueden ser conceptos, categorías, per- sonas… Gráficos estructurales son los organigramas, árboles de Pert y los árbo- les genealógicos.
  • 11. GRÁFICOS TEXTUALES Muestran relaciones conceptuales no jerárquicas entre diferentes elementos. Éstos gráficos muestran relaciones entre conceptos y los organiza a partir de otros conceptos del mismo nivel entre ellos (no jerárquicos). P/E: mapas conceptuales, logigramas, semantogramas, cuadros sinópticos.
  • 12. GRÁFICO DE RELACIONES Muestra las relaciones entre un grupo de personas. P/E: sociogramas
  • 13. GRÁFICOS DE RESULTADOS Explican datos mediante las compara- ciones entre elementos, estos gráficos son los estadísticos. Se asocia un recurso gráfico mayoritariamente de tamaño y /o color para mostrar un grupo de datos y poder compararlos. Gráficos de éste tipo se usan para mostrar estadísticas.
  • 14. GRÁFICOS DE PROCESO Muestran evoluciones temporales, con- juntos de instantes e informan de pro- cesos que ocurren en a lo largo de un es- pacio de tiempo. Gráficos de éste tipo pueden ser histogramas, líneas de tiempo, instrucciones de uso, reconstrucciones periodísticas de sucesos.