SlideShare a Scribd company logo
1 of 1
Name of the person raising the issues is the jey source of information  Daily report of any actual or near miss recorded… if no incident then write zero (0) Place a ‘X’ to identify the body part effected by the incident Traffics lights identify if the indicators is at, close to or not hitting the expected results Actual result is written in the colour circle according to the set range >10% >7% 2 Ward staff highlight issues or concerns that are impacting on their ability to achieve 100% RIGHT CARE 100% PATIENT SATSIFACTION 100% NURSE ENGAGEMENT >6% >6% 5.4 0 Each ward has the ability to determine traffic light indicators important to them indictor 5% 4.5% 5.6 Ranges are set by Nurse Manager in conjunction with Nurse Director Targets are set by Nurse Manager in conjunction with Nurse Director Charts/graphs are used to visualise  the outcomes of improvements based on the current problems being solved.  Issues and concerns are discussed at ward meetings and the team agree on the one or two problem to be solved over the month.  The Nurse Manager will initiate the agreed problem solving process

More Related Content

Similar to Dashboard Presentation

Tools Of Quality Management PowerPoint Presentation Slides
Tools Of Quality Management PowerPoint Presentation Slides Tools Of Quality Management PowerPoint Presentation Slides
Tools Of Quality Management PowerPoint Presentation Slides SlideTeam
 
Benefiting from a Quality Problem Management Program
Benefiting from a Quality Problem Management ProgramBenefiting from a Quality Problem Management Program
Benefiting from a Quality Problem Management ProgramHDI Orange County
 
Seven Basic Quality Control Tools أدوات ضبط الجودة السبعة
Seven Basic Quality Control Tools أدوات ضبط الجودة السبعةSeven Basic Quality Control Tools أدوات ضبط الجودة السبعة
Seven Basic Quality Control Tools أدوات ضبط الجودة السبعةMohamed Khaled
 
Oregon Problem Gambling Prevention Regional Meeting - Fall 2018
Oregon Problem Gambling Prevention Regional Meeting - Fall 2018Oregon Problem Gambling Prevention Regional Meeting - Fall 2018
Oregon Problem Gambling Prevention Regional Meeting - Fall 2018Oregon Problem Gambling Services
 
Illustration of Mental Health Clustering Calculator ajmitchell
Illustration of Mental Health Clustering Calculator ajmitchellIllustration of Mental Health Clustering Calculator ajmitchell
Illustration of Mental Health Clustering Calculator ajmitchellAlex J Mitchell
 
Stat_AMBA_600_Problem Set3
Stat_AMBA_600_Problem Set3Stat_AMBA_600_Problem Set3
Stat_AMBA_600_Problem Set3Tyler Anton
 
Visual tools for Risk Management Process
Visual tools for Risk Management ProcessVisual tools for Risk Management Process
Visual tools for Risk Management ProcessCreately
 
Using the Right Metrics to Improve Physician Practice Management
Using the Right Metrics to Improve Physician Practice ManagementUsing the Right Metrics to Improve Physician Practice Management
Using the Right Metrics to Improve Physician Practice ManagementWarren E. Corprew, Jr. MBA CMA CHFP
 
Coachman calamita dsd_eng_12
Coachman calamita dsd_eng_12Coachman calamita dsd_eng_12
Coachman calamita dsd_eng_12Cabinet Lupu
 
Running Head QUALITY IMPROVEMENT CHART .docx
Running Head QUALITY IMPROVEMENT CHART                           .docxRunning Head QUALITY IMPROVEMENT CHART                           .docx
Running Head QUALITY IMPROVEMENT CHART .docxcharisellington63520
 
Coachman calamita dsd_eng_12
Coachman calamita dsd_eng_12Coachman calamita dsd_eng_12
Coachman calamita dsd_eng_12amar bhochhibhoya
 
Quality Improvement Methodologies and Tools
Quality Improvement Methodologies and ToolsQuality Improvement Methodologies and Tools
Quality Improvement Methodologies and ToolsDr. Aqeel Ahmed Khan
 
Root Cause Analysis
Root Cause AnalysisRoot Cause Analysis
Root Cause Analysisjohnchuddle
 
Merit-Based Incentive Payment System: Strategic Deployment Within Your Organi...
Merit-Based Incentive Payment System: Strategic Deployment Within Your Organi...Merit-Based Incentive Payment System: Strategic Deployment Within Your Organi...
Merit-Based Incentive Payment System: Strategic Deployment Within Your Organi...PYA, P.C.
 

Similar to Dashboard Presentation (20)

Tools Of Quality Management PowerPoint Presentation Slides
Tools Of Quality Management PowerPoint Presentation Slides Tools Of Quality Management PowerPoint Presentation Slides
Tools Of Quality Management PowerPoint Presentation Slides
 
Benefiting from a Quality Problem Management Program
Benefiting from a Quality Problem Management ProgramBenefiting from a Quality Problem Management Program
Benefiting from a Quality Problem Management Program
 
Crisis Ready Check - Example
Crisis Ready Check - ExampleCrisis Ready Check - Example
Crisis Ready Check - Example
 
Seven Basic Quality Control Tools أدوات ضبط الجودة السبعة
Seven Basic Quality Control Tools أدوات ضبط الجودة السبعةSeven Basic Quality Control Tools أدوات ضبط الجودة السبعة
Seven Basic Quality Control Tools أدوات ضبط الجودة السبعة
 
Oregon Problem Gambling Prevention Regional Meeting - Fall 2018
Oregon Problem Gambling Prevention Regional Meeting - Fall 2018Oregon Problem Gambling Prevention Regional Meeting - Fall 2018
Oregon Problem Gambling Prevention Regional Meeting - Fall 2018
 
C O N T R O L L P R E S E N T A T I O N
C O N T R O L L  P R E S E N T A T I O NC O N T R O L L  P R E S E N T A T I O N
C O N T R O L L P R E S E N T A T I O N
 
Deviation management new (1)
Deviation management new (1)Deviation management new (1)
Deviation management new (1)
 
Illustration of Mental Health Clustering Calculator ajmitchell
Illustration of Mental Health Clustering Calculator ajmitchellIllustration of Mental Health Clustering Calculator ajmitchell
Illustration of Mental Health Clustering Calculator ajmitchell
 
Stat_AMBA_600_Problem Set3
Stat_AMBA_600_Problem Set3Stat_AMBA_600_Problem Set3
Stat_AMBA_600_Problem Set3
 
Visual tools for Risk Management Process
Visual tools for Risk Management ProcessVisual tools for Risk Management Process
Visual tools for Risk Management Process
 
FMEA2.pptx
FMEA2.pptxFMEA2.pptx
FMEA2.pptx
 
Using the Right Metrics to Improve Physician Practice Management
Using the Right Metrics to Improve Physician Practice ManagementUsing the Right Metrics to Improve Physician Practice Management
Using the Right Metrics to Improve Physician Practice Management
 
Coachman calamita dsd_eng_12
Coachman calamita dsd_eng_12Coachman calamita dsd_eng_12
Coachman calamita dsd_eng_12
 
Running Head QUALITY IMPROVEMENT CHART .docx
Running Head QUALITY IMPROVEMENT CHART                           .docxRunning Head QUALITY IMPROVEMENT CHART                           .docx
Running Head QUALITY IMPROVEMENT CHART .docx
 
Coachman calamita dsd_eng_12
Coachman calamita dsd_eng_12Coachman calamita dsd_eng_12
Coachman calamita dsd_eng_12
 
Quality Improvement Methodologies and Tools
Quality Improvement Methodologies and ToolsQuality Improvement Methodologies and Tools
Quality Improvement Methodologies and Tools
 
Root Cause Analysis
Root Cause AnalysisRoot Cause Analysis
Root Cause Analysis
 
Merit-Based Incentive Payment System: Strategic Deployment Within Your Organi...
Merit-Based Incentive Payment System: Strategic Deployment Within Your Organi...Merit-Based Incentive Payment System: Strategic Deployment Within Your Organi...
Merit-Based Incentive Payment System: Strategic Deployment Within Your Organi...
 
Csp
CspCsp
Csp
 
SQT.ppt
SQT.pptSQT.ppt
SQT.ppt
 

Dashboard Presentation

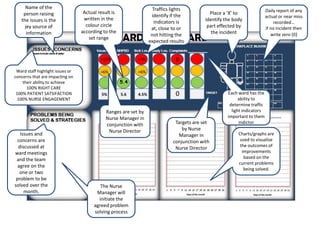
  • 1. Name of the person raising the issues is the jey source of information Daily report of any actual or near miss recorded… if no incident then write zero (0) Place a ‘X’ to identify the body part effected by the incident Traffics lights identify if the indicators is at, close to or not hitting the expected results Actual result is written in the colour circle according to the set range >10% >7% 2 Ward staff highlight issues or concerns that are impacting on their ability to achieve 100% RIGHT CARE 100% PATIENT SATSIFACTION 100% NURSE ENGAGEMENT >6% >6% 5.4 0 Each ward has the ability to determine traffic light indicators important to them indictor 5% 4.5% 5.6 Ranges are set by Nurse Manager in conjunction with Nurse Director Targets are set by Nurse Manager in conjunction with Nurse Director Charts/graphs are used to visualise the outcomes of improvements based on the current problems being solved. Issues and concerns are discussed at ward meetings and the team agree on the one or two problem to be solved over the month. The Nurse Manager will initiate the agreed problem solving process