
Recommended
Recommended
More Related Content
Similar to REPORT ON IMPACT OF VIDEO APPS ON CONSUMERS & NETWORKS
Similar to REPORT ON IMPACT OF VIDEO APPS ON CONSUMERS & NETWORKS (20)
REPORT ON IMPACT OF VIDEO APPS ON CONSUMERS & NETWORKS
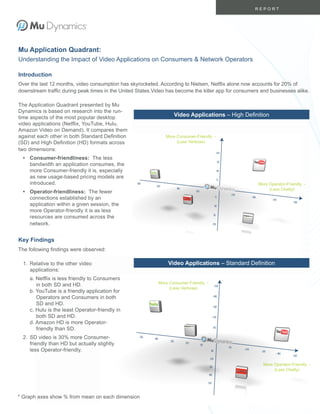
- 1. REPORT Mu Application Quadrant: Understanding the Impact of Video Applications on Consumers & Network Operators Introduction Over the last 12 months, video consumption has skyrocketed. According to Nielsen, Netflix alone now accounts for 20% of downstream traffic during peak times in the United States.Video has become the killer app for consumers and businesses alike. The Application Quadrant presented by Mu Dynamics is based on research into the run- time aspects of the most popular desktop Video Applications – High Definition video applications (Netflix, YouTube, Hulu, Amazon Video on Demand). It compares them against each other in both Standard Definition More Consumer-Friendly - (SD) and High Definition (HD) formats across (Less Verbose) two dimensions: • Consumer-friendliness: The less bandwidth an application consumes, the more Consumer-friendly it is, especially as new usage-based pricing models are introduced. More Operator-Friendly - (Less Chatty) • Operator-friendliness: The fewer connections established by an application within a given session, the more Operator-friendly it is as less resources are consumed across the network. Key Findings The following findings were observed: 1. Relative to the other video Video Applications – Standard Definition applications: a. Netflix is less friendly to Consumers More Consumer-Friendly - in both SD and HD. (Less Verbose) b. YouTube is a friendly application for Operators and Consumers in both SD and HD. c. Hulu is the least Operator-friendly in both SD and HD. d. Amazon HD is more Operator- friendly than SD. 2. SD video is 30% more Consumer- friendly than HD but actually slightly less Operator-friendly. More Operator-Friendly - (Less Chatty) * Graph axes show % from mean on each dimension
- 2. The Real Breakthrough in Testing Methodology Bandwidth Consumed All comparisons were based on multiple measurements. We took several samples of each application for significant durations from the same client, and in similar local network conditions. For these samples we ran queries to extract data regarding flows and connections per second as well as data transfer rates (bytes per second). Finally we normalized the data in each group (SD and HD) to establish a common bytes/sec scale. For example, all the HD data points for the x-axis (connection rate) and the y-axis (bytes/ second) were averaged to yield the x-avg and y-avg for that group. Then for each application the percentage difference from the average was plotted on a scale that had x-avg and y-avg as (0,0). What’s Next? The next Mu Application Quadrant Report will Connection Rate show the impact of different mobile devices (iPhone, Android phone, etc.) on the network. connections/sec About Mu Dynamics Mu Dynamics is the leader and pioneer in testing and validating application-aware networks. Our innovative solutions enable customers to rapidly recreate applications and determine the impact to their network. Hundreds of service providers, enterprises, government agencies and network equipment manufacturers use Mu to ensure that their networks are functional, scalable and secure. Headquartered in Sunnyvale, California, more information on Mu Dynamics can be found at http://www.mudynamics.com. Web: www.mudynamics.com Address: 686 W. Maude Avenue, Suite 104, Sunnyvale, CA 94085, USA Phone: 866-276-4640 or 408-329-6330 Fax: 408-329-6317 Copyright © 2011 Mu Dynamics. All rights reserved. Mu Dynamics, Mu Test Suite, Mu-4000, Mu-8000, Mu Dynamics logo, and Innovate with Confidence are trademarks of Mu Dynamics. Third-party trademarks mentioned are the property of their respective owners. Copyright ©2011, Mu Dynamics, Inc. 2