More Related Content
Similar to Year end-2012-stats-vs-2011 (20)
Year end-2012-stats-vs-2011
- 1. © 2013 American Chemistry Council, Inc.
(1) Except phenolic resins, which are reported on a gross weight basis.
(2) Sales & Captive Use data include imports.
(3) Canadian production and sales data included.
(4) Canadian and Mexican production and sales data included.
(5) Includes: polyurethanes (TDI, MDI and polyols), phenolic, urea, melamine, unsaturated polyester and other thermosets.
(6) Includes: PET, ABS, engineering resins, SB latex, and other thermoplastics.
Sources: Plastics Industry Producers' Statistics Group (PIPS), as compiled by Veris Consulting, Inc.; ACC
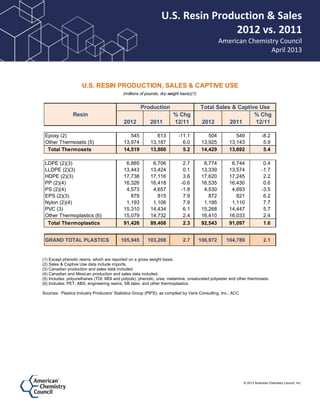
U.S. RESIN PRODUCTION, SALES & CAPTIVE USE
(millions of pounds, dry weight basis)(1)
Production Total Sales & Captive Use
Resin % Chg % Chg
2012 2011 12/11 2012 2011 12/11
Epoxy (2) 545 613 -11.1 504 549 -8.2
Other Thermosets (5) 13,974 13,187 6.0 13,925 13,143 5.9
Total Thermosets 14,519 13,800 5.2 14,429 13,692 5.4
LDPE (2)(3) 6,885 6,706 2.7 6,774 6,744 0.4
LLDPE (2)(3) 13,443 13,424 0.1 13,339 13,574 -1.7
HDPE (2)(3) 17,738 17,116 3.6 17,620 17,245 2.2
PP (2)(4) 16,326 16,418 -0.6 16,535 16,430 0.6
PS (2)(4) 4,573 4,657 -1.8 4,530 4,693 -3.5
EPS (2)(3) 879 815 7.9 872 821 6.2
Nylon (2)(4) 1,193 1,106 7.9 1,195 1,110 7.7
PVC (3) 15,310 14,434 6.1 15,268 14,447 5.7
Other Thermoplastics (6) 15,079 14,732 2.4 16,410 16,033 2.4
Total Thermoplastics 91,426 89,408 2.3 92,543 91,097 1.6
GRAND TOTAL PLASTICS 105,945 103,208 2.7 106,972 104,789 2.1
U.S. Resin Production & Sales
2012 vs. 2011
American Chemistry Council
April 2013