SlideShare a Scribd company logo
1 of 18
Download to read offline
20 years of VIX:
      Fear, Greed and Implications for Traditional Asset Classes


                                           The Abstract
        In this article, I investigate the statistical properties and relationships of VIX with
equities, commodities, real estate and bonds. I find that different VIX states result in
very different risk adjusted performance for all asset classes, not just equities, and that
significant deviations from normality are observed for each state as well as the full
sample. Additionally, I demonstrate that correlations among asset classes are unstable
and non-linear, leading to highly concentrated diversification benefits at the times of
market stress, which a broad set of exposures is likely to negate. Based on empirical
data, practical recommendations for investment analysis and risk management are
included throughout the article. A companion article on alternative investment strategies
called “20 Years of VIX: Fear, Greed and Implications for Alternative Investment
Strategies” is available at http://ssrn.com/abstract=1597904


                           Mikhail Munenzon, CFA, CAIA
                               mikhailmunenzon@gmail.com
Introduction

         Whaley (1993) introduced the VIX index. In the same year, the Chicago Board

Options Exchange (CBOE) introduced the CBOE Volatility Index and it quickly became

the benchmark for stock market volatility and, more broadly, investor sentiment. The

first VIX was a weighted measure of the implied volatility with 30 days to expiration

of eight S&P 100 at-the-money put and call options. Ten years later, it expanded to use

options based on a broader index, the SP 500, which allows for a more accurate view of

investors' expectations on future market volatility. On March 26, 2004, the first ever

trading in futures on the VIX index began on the CBOE.                    Based on the methodology for

SP 500, the index has historical information going back to the start of 1990.

         Why should an investor care about volatility? Black (1975) suggested that the

informed investors would try to take advantage of their views through the options market

because of the leverage such instruments provided. Therefore, clues from the options

market may have implications for the performance characteristics of a security (for

example, see Bali and Hovakimian (2009) and Doran and Krieger (2010)). Moreover,

starting with the work of Engle (1982) and Bollerslev(1986), evidence emerged

documenting the clustering behavior of volatility1 and its resulting predictability.

Consequently, if different volatility states are associated with different performance

characteristics of a security, an investor’s investment and risk management policies will

need to be flexible enough to incorporate that such information.

         In this article, I investigate the statistical characteristics of the VIX index and its

relationship not just with SP 500 but also with other traditional asset classes, which can

1
 High volatility is like to be followed by high volatility; low volatility is likely to be followed by low
volatility.


                                                       2
be useful to practitioners. This article is structured as follows. After an overview of data,

I will present key empirical results; concluding remarks follow.


Data and Methods

        I used data for the following asset classes: equities – SP 500 Total Return Index;

bonds - JPM Morgan Aggregate Bond Total Return Index; commodities – SP GSCI

Commodities Index; real estate – FTSE EPRA/NAREIT US Total Return Index2.

The daily data for the indices was downloaded via Bloomberg. The full historical time

horizon for this analysis is 1/2/1990 to 1/29/2010. Based on the level of VIX, I divided

the full historical sample into 6 groups to evaluate any differences in results as compared

to the full sample, assuming one remains invested only when VIX is in that particular

state. Such classification is broadly consistent with Figure 1 and practitioners’ views on

what constitutes low, medium and high volatility and provides a practical way of judging

any changes in performance and other characteristics of asset classes, given a VIX state.


Key Empirical Results

        Figure 1 shows the historical level of VIX and cumulative return graphs for the

asset classes and VIX. Though the starting and ending points for VIX are relatively

comparable, the range of results is very high; one also finds that there are extended

periods of high and low volatility. The figure also suggests that crashes don’t just happen

– they are generally preceded by periods of increasing turbulence, which ultimately push

markets over the edge.

2
  Some investors consider commodities and real estate alternative asset classes, as compared to stocks and
bonds. However, for the purposes of this analysis, I consider all such asset classes to be traditional
ingredients in an investment program.


                                                    3
Table 1 presents key statistical information on VIX and the asset classes for the

full historical period. For all the asset classes, cumulative returns are strongly positive,

especially real estate3. However, the peaks and troughs for each asset class are very large

– evidence of fat tails of distributions, as seen in high kurtosis. Moreover, the assumption

that returns follow a normal distribution, one of the fundamental assumptions of classical

finance, can be strongly rejected for all the indices4. Not only do we not observe

normality, but we also find serial correlation across all time series5, which is inconsistent

with a random walk model. In classical finance, correlation6, a linear measure of

dependency, plays a key role in portfolio risk measurement and optimization. In Table 4,

one can see that in the full sample, correlations among asset classes are relatively low

(particularly, between SP500 and SP GSCI indices) and all asset classes have very low

correlation with VIX. Finally, because of fat tails, historical VaR significantly

understates realistic losses one can experience in adverse scenarios, as measured by

historical CVaR7.

         Which states dominated historically? The first state (VIX below 20%) accounted

for over 50% of all days in the historical sample due to extended periods of calm in the

90s and, to a lesser extent, in the middle of this decade (Table 5). The first 3 states (VIX

3
  Secular decline in long term interest rates and the subsequent real estate bubble, which is still being
resolved, also played key roles.
4
  For a normal distribution, skewness should be 0 and kurtosis should be 3.
5
  Positive returns are likely to be followed by positive returns and negative returns are likely to be followed
by negative returns
6
  Throughout the paper, correlation refers to what is more formally known as Pearson product-moment
correlation coefficient, which is used extensively by practitioners and academics to model dependence.
7
  VaR(a) is defined as the probability of a loss less than or equal to quantity Q, with the confidence level of
a. Thus, it stops at the start of extreme events and does not analyze the tail. CVaR(a) is defined as the
average loss once Q is exceeded, with the confidence level of a. Historical based measures are evaluated
based on historical data and thus fully incorporate all features of a distribution of a return series. If one
assumes a normal distribution of returns, one can find VaR of a a return series via an analytical formula
with just its mean and volatility. However, such a measure will understate the realistic extent of losses
even more than the historical VaR. For example, for SP 500, the normal VaR(95%) in the full sample is
0.01%.. For more detail, the reader is referred to Alexander (2008).


                                                       4
at up to 30%) accounted for over 90% of all days. However, as seen in the historical VIX

chart, the last decade was far more volatile than the decade of the 90s. In addition, once

in a particular state, VIX is very likely to remain in that state for a period of time, as

transitions occur gradually.

        How similar are risk/return properties of asset classes in various states and

relative to the full historical sample? Very dissimilar (Tables 2 and 3). In fact, they are

so dissimilar that if one relies on the average figures from this long data sample, one may

face the risk of drowning in a pool that is on average only a foot deep by ignoring the full

spectrum of information for investment analysis and risk management. Only bonds

provide cumulatively positive returns across all the states. Unsurprisingly, equities are

extremely sensitive to different levels of VIX even if extreme changes in returns across

states may be surprising, going from the cumulative return feast in state 1 to famine in

state 6 and meaningful gains or losses in the intermediate states. It is worth noting that in

the full sample, the percentage of positive days is close to 50% for all assets, suggesting

that it is the magnitude of returns (or losses) that drove performance, rather than the

frequency of positive days. However, the percentage of positive days for equities drops

very quickly as VIX rises (again, only the bond market continues to deliver positive

returns in over 50% of days in each of the states). The picture for commodities and real

estate is a little more mixed than that for equities. While one loses money in those asset

classes in states 3, 4 (SP GSCI is actually very slightly positive on a cumulative basis)

and 6, one makes money in state 5. As with equities, the percentage of positive days for

commodities and equities drops as VIX rises (with the exception of commodities in state

4). Finally, it is interesting to observe that normal distribution remains a very poor


                                               5
descriptor of return frequencies for all the asset classes in all the states. Similarly, serial

correlation generally remains present as well.

        How consistent are cumulative returns for asset classes in various states (Figures

2-4)? They are very consistent at the extreme states 1 and 6. In state 1, all are positive,

especially equities and real estate. In state 6, all asset classes, except fixed income, drop

very sharply and fixed income produces a return. Also, equities and fixed income exhibit

a generally consistent pattern of returns in each state – with the exception of state 2,

equities do not appear to respond well to rising volatility and bonds show a generally

steady, upward pattern. However, the picture is mixed for the intermediate states for

commodities and real estate, with both having up and down periods in the same state.

For example, in state 3, SP GSCI is significantly down on a cumulative basis in the first

half of that state but then has a period of positive returns in the second half; this situation

is repeated in state 4 for real estate. In state 5, cumulatively positive returns for real

estate and commodities are almost entirely due to the period in early 2009, as the

extraordinary volatility of the 2008 crash began to subside. These results suggest that

other factors may be driving such divergent performances, such as interest rates or the

prior volatility state.

        Given the prior discussion of returns in different states, it is not surprising to find

how unstable correlations are across states (Table 4). For example, in state 6, equities,

commodities and real estate are almost perfectly synchronized while VIX and bonds have

significant negative correlation; all asset classes are also closely synchronized in state 1.

In state 3, however, such correlations for equities, commodities and real estate are quite

different. Such behavior suggests that not only are dependencies among asset classes


                                               6
time varying, but that they are also non-linear. Therefore, correlation may not be an

appropriate means of evaluating dependence among asset classes8. Moreover, while at

the points of extreme stress, diversification can provide protection at the asset class level,

such benefits are limited only to bonds, and this result is consistent across the full sample.

Finally, given the non-synchronized relationship of VIX with asset classes, it should play

a useful role in an investment program by helping investors minimize potential losses and

thus enhance portfolio performance.


Conclusions

         The level of VIX seems to have important and different implications for return

expectations for all asset classes, not just equities. This is particularly true for the

extreme levels of VIX. Though the historical range for VIX is very broad, it exhibits

clustering, which make it useful for forecasting. I further present evidence that during the

historical period used in the article, several important assumptions of classical finance –

normal distribution, randomness of data (no serial correlation) and the use of correlation

to describe dependence – find limited support in empirical data. Therefore, a practitioner

should generate value by incorporating more realistic assumptions to model markets for

investment analysis and risk management, such as non-normal distributions which can

incorporate skews and fat tails of returns and copulas which can capture non-linearity of

dependencies, particularly in the tails. Further, I demonstrate that only bonds

consistently provided downside protection at times of market stress in the full sample.


8
 Correlation will correctly describe dependence structure only in very particular cases, such as multivariate
normal distributions. Also, at extremes, correlation should be zero for a multivariate normal distribution,
which is not empirically supported. For a more detailed critique on the use of correlations to model
dependence, see Embrechts et al (2002).


                                                     7
Consequently, while diversification can add value at the asset class level, its benefits are

highly concentrated when they are needed most, which a broad set of exposures is likely

to minimize significantly. Also, given the performance characteristics of VIX and its

relationship with other assets, its inclusion in an investment program should provide

valuable benefits in risk management.

        The analytical framework presented in this article can be refined further by adding

more factors deemed important, such as inflation or information about the prior VIX

state; it can also be extended to sectors within an asset class and alternative investment

strategies. Finally, while we do not know which volatility states will dominate in the

future or how long they may last, greater awareness of the current investment

environment, its implications for risk adjusted performance and flexible investment

policies to position portfolios appropriately should help investors produce more

consistent results.


References

Alexander, C. 2008. Value at Risk Models John Wiley & Sons.

Bali, T. and A. Hovakimian. 2009. “Volatility Spreads and Expected stock Returns.”

Management Science, vol. 55, no. 11 (November): 1797-1812.

Black, F. 1975. “Fact and Fantasy in the Use of Options.” Financial Analysts Journal,

vol. 31, no. 4 (July/August): 36-41.

Bollerslev, T. 1986. “Generalized Autoregressive Conditional Heteroskedasticity.”

Journal of Econometrics 31: 307-327.


                                              8
Doran J. and K. Krieger. 2010. “Implications for Asset Returns in the Implied Volatility

Skew.” Financial Analysts Journal, vol. 66, no, 1 (January/February): 65-76.

Engle, R. 1982. “Autoregressive Conditional Heteroskedasticity with Estimates of the

Variance of UK inflation.” Econometrica 50: 987-1007.

Embrechts, P, A. McNeil, and D. Straumann. 2002. “Correlation and dependence in risk

management: Properties and Pitfalls.” In M. Dempster (e.d), Risk Management: Value at

Risk and Beyond. Cambridge University Press.

Whaley, R. 1993. “Derivatives on Market Volatility: Hedging Tools Long Overdue.”

Journal of Derivatives, 1 (Fall): 71-84.


                                            9
Cumulative Return                                                                                      VIX


                                                                                    0
                                                                                    2
                                                                                    4
                                                                                    6
                                                                                    8
                                                                                   10
                                                                                   12
                                                                                   14
                                                                                   16
                                                                                   18
                                                                                   20
                                                                                                                                                                                                                                                             Figure 1


                                                                                                                                                                      0
                                                                                                                                                                          10
                                                                                                                                                                               20
                                                                                                                                                                                    30
                                                                                                                                                                                         40
                                                                                                                                                                                              50
                                                                                                                                                                                                   60
                                                                                                                                                                                                        70
                                                                                                                                                                                                             80
                                                                                                                                                                                                                  90
                                                                        1/2/1990                                                                           1/2/1990
                                                                        1/2/1991                                                                           1/2/1991
                                                                        1/2/1992                                                                           1/2/1992
                                                                        1/2/1993                                                                           1/2/1993


                                           SP 500 Total Return
                                                                        1/2/1994                                                                           1/2/1994

                                                                        1/2/1995                                                                           1/2/1995

                                                                        1/2/1996                                                                           1/2/1996

                                                                        1/2/1997                                                                           1/2/1997


FTSE EPRA/NAREIT US Total Return
                                                                        1/2/1998                                                                           1/2/1998

                                                                        1/2/1999                                                                           1/2/1999

                                                                        1/2/2000                                                                           1/2/2000
                                                                                                                                                    Date


                                                                 Date
                                                                        1/2/2001                                                                           1/2/2001

                                                                                                                                                           1/2/2002


                                           SP GSCI
                                                                        1/2/2002
                                                                                                                                                                                                                       Historical VIX (1/2/1990-1/29/2010)


                                                                        1/2/2003                                                                           1/2/2003

                                                                        1/2/2004                                                                           1/2/2004
                                                                                                       Cumulative Return - Full Historical Sample


                                                                        1/2/2005
                                                                                                                                                           1/2/2005

                                                                        1/2/2006
                                                                                                                                                           1/2/2006

                                                                        1/2/2007
                                                                                                                                                           1/2/2007

                                                                                                                                                           1/2/2008
                                                                        1/2/2008
                                                                                                                                                           1/2/2009
                                                                        1/2/2009


JP Morgan US Aggregate Bond Total Return
                                                                                                                                                           1/2/2010
                                                                        1/2/2010
Cumulative Return                                                                                                                                                           Cumulative Return


                                                                                                                                                                                                                                           0
                                                                                                                                                                                                                                               2
                                                                                                                                                                                                                                                   4
                                                                                                                                                                                                                                                       6
                                                                                                                                                                                                                                                           8
                                                                                                                                                                                                                                                               10
                                                                                                                                                                                                                                                                    12
                                                                                                                                                                                                                                                                         14
                                                                                                                                                                                                                                                                              16
                                                                                                                                                                                                                                                                                   18
                                                                                                                                                                                                                                                                                        20


                                                                 0.5
                                                                       1
                                                                           1.5
                                                                                 2
                                                                                      2.5
                                                                                            3
                                                                                                                                                                                                                                                                                                                                         Figure 2
                                                                                                                                                                                                                              '1/3/1990'
                                                    '1/5/1990'
                                                                                                                                                                                                                              '4/4/1991'
                                                   '4/17/1990'
                                                                                                                                                                                                                             '8/22/1991'
                                                  '12/21/1990'                                                                                                                                                               '1/17/1992'
                                                    '4/8/1992'                                                                                                                                                                '6/3/1992'


SP 500 Total Return
                                                                                                                                                                                                                            '10/21/1992'


                                                                                                                                                                                               SP 500 Total Return
                                                    '4/1/1997'
                                                                                                                                                                                                                              '3/5/1993'
                                                    '8/8/1997'
                                                                                                                                                                                                                             '7/20/1993'
                                                   '12/5/1997'                                                                                                                                                               '12/2/1993'
                                                   '4/16/1998'                                                                                                                                                               '4/21/1994'


                                                                                                                                                    FTSE EPRA/NAREIT US Total Return
                                                  '11/24/1998'                                                                                                                                                                '9/5/1994'


FTSE EPRA/NAREIT US Total Return
                                                                                                                                                                                                                             '1/18/1995'
                                                   '4/28/1999'
                                                                                                                                                                                                                              '6/2/1995'
                                                    '9/9/1999'                                                                                                                                                              '10/17/1995'
                                                  '12/14/1999'                                                                                                                                                               '2/29/1996'

                                                    '3/8/2000'                                                                                                                                                               '7/19/1996'

                                                                                                                                                                                                                     Date


                                           Date
                                                                                                                                                                                                                            '12/11/1996'
                                                    '7/6/2000'
                                                                                                                                                                                                                             '2/19/1998'


SP GSCI
                                                   '1/30/2001'                                                                                                                                 SP GSCI
                                                                                                                                                                                                                             '8/28/2000'
                                                   '6/15/2001'                                                                                                                                                               '7/18/2003'

                                                  '11/21/2001'                                                                                                                                                              '12/19/2003'
                                                                                                                                                                                                                             '5/11/2004'
                                                                                                                                                                                                                                                                                             Cumulative Return - State 1 of VIX (<=20)


                                                   '2/12/2002'
                                                                                                                                                                                                                             '9/23/2004'
                                                    '1/3/2003'
                                                                                                Cumulative Return - State 2 of VIX (>20 and <=25)

                                                                                                                                                                                                                              '2/7/2005'
                                                    '8/5/2003'                                                                                                                                                               '6/22/2005'

                                                  '10/30/2007'                                                                                                                                                               '11/4/2005'
                                                                                                                                                                                                                             '3/21/2006'
                                                    '4/4/2008'
                                                                                                                                                                                                                              '8/8/2006'
                                                    '8/1/2008'
                                                                                                                                                                                                                            '12/21/2006'
                                                                                                                                                    JP Morgan US Aggregate Bond Total Return


JP Morgan US Aggregate Bond Total Return
                                                   '9/22/2009'                                                                                                                                                                '5/7/2007'
                                                  '12/18/2009'                                                                                                                                                               '5/16/2008'
Cumulative Return                                                                                                                              Cumulative Return


                                                                                                                                                                                                                                0.5
                                                                                                                                                                                                                                      0.7
                                                                                                                                                                                                                                             0.9
                                                                                                                                                                                                                                                    1.1
                                                                                                                                                                                                                                                          1.3
                                                                                                                                                                                                                                                                                                                    Figure 3


                                                                                       0.6
                                                                                       0.7
                                                                                       0.8
                                                                                       0.9
                                                                                         1
                                                                                       1.1
                                                                                       1.2
                                                                                       1.3
                                                                                       1.4
                                                                          '8/7/1990'                                                                                                                               '1/5/1990'

                                                                        '10/11/1990'                                                                                                                              '2/21/1990'

                                                                         '11/2/1990'                                                                                                                              '4/17/1990'

                                                                        '10/29/1997'                                                                                                                             '11/16/1990'


                                                                                                                                                               SP 500 Total Return
                                                                          '8/4/1998'                                                                                                                             '12/21/1990'


                                           SP 500 Total Return
                                                                         '9/25/1998'                                                                                                                              '2/21/1991'

                                                                        '10/27/1998'                                                                                                                               '4/8/1992'

                                                                         '2/10/1999'                                                                                                                               '1/9/1997'


FTSE EPRA/NAREIT US Total Return
                                                                         '3/21/2001'                                                                                                                               '4/1/1997'


                                                                                                                                                               FTSE EPRA/NAREIT US Total Return
                                                                         '9/11/2001'                                                                                                                              '6/19/1997'

                                                                         '10/5/2001'                                                                                                                               '8/8/1997'

                                                                        '10/29/2001'                                                                                                                              '9/18/1997'

                                                                         '7/29/2002'                                                                                                                              '12/5/1997'

                                                                                                                                                                                                          Date


                                                                 Date
                                                                         '9/26/2002'                                                                                                                               '2/5/1998'

                                                                                                                                                               SP GSCI
                                                                        '10/29/2002'                                                                                                                              '4/16/1998'
                                                                                                                                                                                                                   '6/3/1998'


                                           SP GSCI
                                                                         '12/5/2002'
                                                                          '2/4/2003'                                                                                                                             '11/24/1998'

                                                                         '2/18/2003'                                                                                                                              '3/18/1999'


                                                                                                           Cumulative Return - State 4 of VIX (>30 and <=35)
                                                                                                                                                                                                                                                                Cumulative Return - State 3 of VIX (>25 and <=30)


                                                                          '3/5/2003'                                                                                                                              '4/28/1999'

                                                                         '3/19/2003'                                                                                                                              '7/23/1999'

                                                                         '9/16/2008'                                                                                                                               '9/9/1999'

                                                                          '5/7/2009'                                                                                                                              '11/3/1999'

                                                                         '5/25/2009'                                                                                                                             '12/14/1999'


JP Morgan US Aggregate Bond Total Return
                                                                                                                                                               JP Morgan US Aggregate Bond Total Return


                                                                         '6/18/2009'                                                                                                                              '1/25/2000'
Cumulative Return                                                                                                                            Cumulative Return


                                                                 0
                                                                     0.2
                                                                           0.4
                                                                                 0.6
                                                                                       0.8
                                                                                             1
                                                                                                 1.2
                                                                                                                                                                                                                   0.7
                                                                                                                                                                                                                   0.8
                                                                                                                                                                                                                   0.9
                                                                                                                                                                                                                     1
                                                                                                                                                                                                                   1.1
                                                                                                                                                                                                                   1.2
                                                                                                                                                                                                                   1.3
                                                                                                                                                                                                                   1.4
                                                                                                                                                                                                                   1.5
                                                                                                                                                                                                                   1.6
                                                                                                                                                                                                                                                                                           Figure 4


                                                   '8/31/1998'
                                                                                                                                                                                                      '8/6/1990'
                                                   '9/30/1998'
                                                                                                                                                                                                    '10/30/1997'
                                                   '10/9/1998'
                                                                                                                                                                                                    '11/12/1997'
                                                   '7/22/2002'
                                                   '10/7/2002'                                                                                                                                        '9/2/1998'


                                                                                                                                                  SP 500 Total Return


SP 500 Total Return
                                                   '10/7/2008'                                                                                                                                       '9/16/1998'

                                                  '10/16/2008'                                                                                                                                       '9/29/1998'
                                                  '10/27/2008'                                                                                                                                       '9/26/2001'
                                                   '11/5/2008'


FTSE EPRA/NAREIT US Total Return
                                                                                                                                                                                                     '7/15/2002'


                                                                                                                                                  FTSE EPRA/NAREIT US Total Return
                                                  '11/14/2008'
                                                                                                                                                                                                     '7/24/2002'
                                                  '11/25/2008'
                                                                                                                                                                                                      '8/8/2002'
                                                   '12/4/2008'


                                           Date
                                                                                                                                                                                                      '9/4/2002'
                                                                                                                                                                                             Date


                                                  '12/15/2008'
                                                                                                                                                                                                     '9/12/2002'
                                                  '12/24/2008'
                                                                                                                                                  SP GSCI


                                                                                                                                                                                                     '9/20/2002'


SP GSCI
                                                    '1/9/2009'
                                                   '1/20/2009'                                                                                                                                       '10/2/2002'
                                                                                                       Cumulative Return - State 6 of VIX (>40)


                                                   '1/30/2009'                                                                                                                                      '10/14/2002'
                                                                                                                                                                                                                                       Cumulative Return - State 5 of Vix (>35 and <=40)


                                                   '2/10/2009'                                                                                                                                       '9/30/2008'
                                                   '2/19/2009'                                                                                                                                        '1/5/2009'
                                                    '3/2/2009'
                                                                                                                                                                                                      '4/9/2009'
                                                   '3/11/2009'
                                                                                                                                                                                                     '4/16/2009'
                                                   '3/20/2009'
                                                                                                                                                                                                     '4/24/2009'


JP Morgan US Aggregate Bond Total Return
                                                   '3/31/2009'
                                                                                                                                                  JP Morgan US Aggregate Bond Total Return


                                                                                                                                                                                                      '5/1/2009'
Table 1
1/2/1990-1/31/2010                                            SPX       GSCI     NAREIT JPMAGG                 VIX
daily data
Arithmetic avg return                                    0.0357%     0.0253%     0.0554%     0.0264%     0.1763%
Compounded avg return                                    0.0291%     0.0158%     0.0426%     0.0261%     0.0068%
max                                                        11.6%         7.8%       18.4%        1.3%       64.2%
min                                                         -9.0%      -16.9%      -19.5%       -1.5%      -25.9%
vol                                                          1.2%        1.4%        1.6%        0.3%        5.9%
VaR (95%)                                                   -1.7%       -2.1%       -1.7%       -0.4%       -8.2%
VaR (99%)                                                   -3.1%       -3.7%       -5.2%       -0.7%      -12.4%
CVaR(95%)                                                   -2.7%       -3.2%       -3.8%       -0.5%      -11.2%
CVaR(99%)                                                   -4.6%       -5.2%       -8.0%       -0.8%      -15.8%
Skewness                                                      0.00       -0.40        0.47       -0.14        1.23
Kurtosis                                                    12.71        10.74       33.85        4.77       10.91
Number of days                                              5,238        5,238       5,238      5,238        5,238
Normality at 95% confidence level?                             No           No          No         No           No
p-values                                                     0.1%        0.1%        0.1%        0.1%        0.1%
No serial correlation at 95% confidence level?                 No           No          No         No           No
p-values                                                     0.0%        0.0%        0.0%        0.0%        0.0%
Cumulative Return                                         358.7%      129.2%      833.0%      292.9%        42.8%
% of days with positive returns                            51.7%        49.3%       51.9%      53.0%        45.8%

Notes:
Jarque-Bera test was used to evaluate normality of a time series; null hypothesis is stated in the question.
Ljung-Box test with 20 lags was used to evaluate serial correlation of a time series;
null hypothesis is stated in the question.
SPX - SP500 Total Return
GSCI - SP GSCI
NAREIT - FTSE EPRA/NAREIT US Total Return
JPMAGG - JPM Morgan Aggregate Bond Total Return
VIX - VIX Index
Table 2
State 1 - VIX <=20                                             SPX         GSCI      NAREIT JPMAGG                   VIX
daily
Arithmetic avg return                                      0.0983%      0.0411%     0.1004%     0.0254%        -0.1932%
Compounded avg return                                      0.0962%      0.0351%     0.0976%     0.0252%        -0.3318%
max                                                            2.9%         6.8%        3.6%        1.0%           64.2%
min                                                           -3.5%        -4.6%       -4.8%       -1.1%          -25.9%
vol                                                            0.7%         1.1%        0.7%        0.2%            5.3%
VaR (95%)                                                     -1.0%        -1.8%       -1.1%       -0.3%           -8.0%
VaR (99%)                                                     -1.6%        -2.8%       -2.0%       -0.6%          -12.1%
CVaR(95%)                                                     -1.4%        -2.4%       -1.7%       -0.5%          -10.8%
CVaR(99%)                                                     -1.9%        -3.4%       -2.8%       -0.7%          -15.3%
Skewness                                                        0.02         0.18       -0.33       -0.04            1.25
Kurtosis                                                        4.16         5.06        7.03        4.77           13.94
Number of days                                                 2,945        2,945      2,945       2,945            2,945
Normality at 95% confidence level?                                No           No          No          No              No
p-values                                                       0.1%         0.1%        0.1%        0.1%            0.1%
No serial correlation at 95% confidence level?                   Yes          Yes          No          No              No
p-values                                                      49.5%        13.0%        1.1%        0.9%            0.0%
Cumulative Return                                          1595.7%       181.1%     1669.5%      109.9%         -100.0%

% of days with positive returns                              55.3%        49.3%       55.2%       52.7%           43.5%

State 2 - VIX >20 & <=25                                       SPX         GSCI      NAREIT JPMAGG                   VIX
daily
Arithmetic avg return                                      0.0461%      0.0482%     0.0794%     0.0232%        0.4603%
Compounded avg return                                      0.0402%      0.0398%     0.0729%     0.0228%        0.2832%
max                                                            4.8%         6.2%        6.5%        0.8%          51.7%
min                                                           -3.7%        -5.5%       -6.7%       -1.5%         -23.1%
vol                                                            1.1%         1.3%        1.1%        0.3%           6.1%
VaR (95%)                                                     -1.7%        -2.1%       -1.5%       -0.4%          -7.8%
VaR (99%)                                                     -2.5%        -3.2%       -3.1%       -0.7%         -11.7%
CVaR(95%)                                                     -2.2%        -2.8%       -2.5%       -0.6%         -10.5%
CVaR(99%)                                                     -2.8%        -3.9%       -3.9%       -0.8%         -14.5%
Skewness                                                        0.24        -0.04        0.58       -0.27           1.51
Kurtosis                                                        3.78         4.22        9.21        4.53          12.41
Number of days                                                 1,210        1,210       1,210       1,210          1,210
Normality at 95% confidence level?                                No           No          No          No             No
p-values                                                       0.1%         0.1%        0.1%        0.1%           0.1%
No serial correlation at 95% confidence level?                   Yes          Yes          No         Yes             No
p-values                                                       9.4%        22.4%        0.0%       40.9%           0.0%
Cumulative Return                                             62.7%        61.9%     141.4%        31.8%       2961.5%
% of days with positive returns                               49.4%        49.9%       50.7%       51.7%          47.7%

State 3 - VIX >25 & <=30                                       SPX         GSCI      NAREIT JPMAGG                   VIX
daily
Arithmetic avg return                                     -0.0776%     -0.0227% -0.0296%        0.0230%        0.4789%
Compounded avg return                                     -0.0872%     -0.0373% -0.0392%        0.0226%        0.2802%
max                                                            5.0%         5.9%     8.8%           0.9%          40.7%
min                                                           -3.8%       -16.9%    -7.0%          -0.9%         -20.0%
vol                                                            1.4%         1.7%     1.4%           0.3%           6.4%
VaR (95%)                                                     -2.3%        -2.8%    -2.1%          -0.5%          -9.5%
VaR (99%)                                                     -2.9%        -4.7%    -4.3%          -0.8%         -12.6%
CVaR(95%)                                                     -2.7%        -4.1%    -3.5%          -0.6%         -11.8%
CVaR(99%)                                                     -3.2%        -7.1%    -5.5%          -0.8%         -15.0%
Skewness                                                        0.27        -1.76     0.20          -0.36           0.72
Kurtosis                                                        3.23        19.72     9.96           3.68           6.01
Number of days                                                   590          590      590            590            590
Normality at 95% confidence level?                                No           No       No             No             No
p-values                                                       1.9%         0.1%     0.1%           0.1%           0.1%
No serial correlation at 95% confidence level?                   Yes          Yes       No            Yes            Yes
p-values                                                      11.0%        12.8%     0.0%          84.1%          56.6%
Cumulative Return                                            -40.2%       -19.8%   -20.7%          14.3%        421.0%
% of days with positive returns                               44.6%        48.8%    45.6%          54.6%          49.3%


Notes:
Jarque-Bera test was used to evaluate normality of a time series; null hypothesis is stated in the question.
Ljung-Box test with 20 lags was used to evaluate serial correlation of a time series;
null hypothesis is stated in the question.
SPX - SP500 Total Return
GSCI - SP GSCI
NAREIT - FTSE EPRA/NAREIT US Total Return
JPMAGG - JPM Morgan Aggregate Bond Total Return
VIX - VIX Index
Table 3
State 4 - VIX >30 & <=35                                     SPX        GSCI     NAREIT JPMAGG                 VIX
daily
Arithmetic avg return                                   -0.1244%     0.0223% 0.0049%         0.0447%     1.4675%
Compounded avg return                                   -0.1412%     0.0080% -0.0186%        0.0443%     1.2604%
max                                                          5.4%        5.1%    10.9%           0.8%       34.3%
min                                                         -6.9%       -4.3%    -8.9%          -0.7%      -14.4%
vol                                                          1.8%        1.7%     2.2%           0.3%        6.6%
VaR (95%)                                                   -2.9%       -3.1%    -3.4%          -0.5%       -8.1%
VaR (99%)                                                   -4.9%       -4.0%    -7.2%          -0.7%      -12.1%
CVaR(95%)                                                   -4.1%       -3.6%    -5.5%          -0.6%      -10.1%
CVaR(99%)                                                   -5.8%       -4.2%    -8.2%          -0.7%      -13.4%
Skewness                                                      0.04        0.11     0.59          -0.15        1.00
Kurtosis                                                      4.09        3.42    10.43           3.23        5.82
Number of days                                                235         235      235             235        235
Normality at 95% confidence level?                             No         Yes       No            Yes          No
p-values                                                     1.0%       28.9%     0.1%          47.3%        0.1%
No serial correlation at 95% confidence level?                Yes         Yes       No              No        Yes
p-values                                                    49.6%        6.1%     0.0%           0.6%       21.7%
Cumulative Return                                          -28.2%        1.9%    -4.3%          11.0%    1798.1%
% of days with positive returns                             46.4%       51.5%    47.7%          59.1%       52.8%

State 5 - VIX >35 & <=40                                     SPX        GSCI     NAREIT JPMAGG                 VIX
daily
Arithmetic avg return                                    0.0166%     0.3792%     0.4106%     0.0263%     0.6211%
Compounded avg return                                   -0.0061%     0.3565%     0.3527%     0.0259%     0.3153%
max                                                          5.7%        7.8%       13.6%        0.7%       24.9%
min                                                         -4.7%       -8.8%      -11.2%       -1.1%      -17.6%
vol                                                          2.1%        2.1%        3.4%        0.3%        8.0%
VaR (95%)                                                   -3.5%       -2.5%       -4.2%       -0.4%      -11.4%
VaR (99%)                                                   -4.5%       -7.0%       -9.8%       -1.0%      -16.7%
CVaR(95%)                                                   -4.0%       -4.1%       -6.8%       -0.6%      -13.4%
CVaR(99%)                                                   -4.5%       -7.0%       -9.8%       -1.0%      -16.7%
Skewness                                                      0.29        0.09        0.61       -0.94        0.78
Kurtosis                                                      3.09        7.89        6.32        5.81        4.09
Number of days                                                 100         100        100          100         100
Normality at 95% confidence level?                            Yes           No         No           No          No
p-values                                                    40.0%        0.1%        0.1%        0.1%        0.6%
No serial correlation at 95% confidence level?                Yes         Yes         Yes         Yes         Yes
p-values                                                    84.1%      27.8%        65.3%      35.0%        81.3%
Cumulative Return                                           -0.6%      42.7%        42.2%        2.6%       37.0%
% of days with positive returns                             49.0%      56.0%        47.0%      52.0%        44.0%

State 6 - VIX>40                                             SPX        GSCI     NAREIT JPMAGG                 VIX
daily
Arithmetic avg return                                   -0.5372% -0.4839% -0.7983%           0.0562%     1.5559%
Compounded avg return                                   -0.5940% -0.5300% -1.0065%           0.0555%     1.1540%
max                                                         11.6%     7.5%    18.4%              1.3%       34.5%
min                                                         -9.0%    -8.1%   -19.5%             -1.0%      -24.7%
vol                                                          3.4%     3.0%     6.5%              0.4%        9.2%
VaR (95%)                                                   -5.9%    -5.9%   -10.0%             -0.5%      -10.9%
VaR (99%)                                                   -8.9%    -7.6%   -15.0%             -1.0%      -21.1%
CVaR(95%)                                                   -7.5%    -6.7%   -13.0%             -0.8%      -16.0%
CVaR(99%)                                                   -9.0%    -7.9%   -17.3%             -1.0%      -23.0%
Skewness                                                      0.41     0.12     0.49              0.12        0.66
Kurtosis                                                      4.22     3.25     3.64              4.36        4.77
Number of days                                                 158      158     158               158         158
Normality at 95% confidence level?                              No     Yes       No                No          No
p-values                                                     0.7%    50.0%     1.9%              0.9%        0.1%
No serial correlation at 95% confidence level?                Yes      Yes      Yes                No          No
p-values                                                    62.0%    33.2%    30.2%              0.6%        1.9%
Cumulative Return                                          -61.0%   -56.8%   -79.8%              9.2%     512.8%
% of days with positive returns                             39.2%    37.3%    34.2%            53.8%        51.3%


Notes:
Jarque-Bera test was used to evaluate normality of a time series; null hypothesis is stated in the question.
Ljung-Box test with 20 lags was used to evaluate serial correlation of a time series;
null hypothesis is stated in the question.
SPX - SP500 Total Return
GSCI - SP GSCI
NAREIT - FTSE EPRA/NAREIT US Total Return
JPMAGG - JPM Morgan Aggregate Bond Total Return
VIX - VIX Index
Table 4
Correlation matrices

Full sample
           SPX          GSCI     NAREIT    JPMAGG VIX
SPX                1
GSCI        0.614909           1
NAREIT      0.828916    0.846607         1
JPMAGG 0.822595         0.770811 0.864026         1
VIX         0.155275    0.061055 -0.029318 0.276768     1


State 1 - VIX <=20                                          State 4 - VIX >30 & <=35
            SPX         GSCI     NAREIT    JPMAGG VIX                   SPX        GSCI     NAREIT JPMAGG VIX
SPX                 1                                       SPX                  1
GSCI         0.898321           1                           GSCI        -0.288855         1
NAREIT       0.974663    0.929054         1                 NAREIT       0.308306 -0.536519        1
JPMAGG 0.910627          0.728673 0.883676          1       JPMAGG        -0.71221 0.149066 0.116173       1
VIX         -0.465434   -0.284836 -0.447933 -0.673159   1   VIX         -0.739751 -0.118798 0.32146 0.842166         1

State 2 - VIX >20 & <=25                                    State 5 - VIX >35 & <=40
            SPX        GSCI    NAREIT JPMAGG VIX                        SPX        GSCI     NAREIT JPMAGG VIX
SPX                  1                                      SPX                  1
GSCI         0.786621        1                              GSCI         0.291233         1
NAREIT       0.727929 0.711477         1                    NAREIT       0.555915 0.720048          1
JPMAGG 0.838083 0.81479 0.914554                 1          JPMAGG -0.364912 0.019158 0.28198                 1
VIX         -0.357736 0.011339 -0.171163 -0.151194      1   VIX         -0.717426 -0.173092 -0.557295 -0.219695      1

State 3 - VIX >25 & <=30                                    State 6 - VIX>40
            SPX        GSCI     NAREIT JPMAGG VIX                       SPX          GSCI     NAREIT    JPMAGG VIX
SPX                  1                                      SPX                  1
GSCI        -0.168537         1                             GSCI         0.947808            1
NAREIT       0.086168 -0.305081        1                    NAREIT          0.9922    0.960259         1
JPMAGG -0.682311 0.032938 -0.248043             1           JPMAGG -0.668409         -0.811675 -0.693375        1
VIX         -0.901783 0.206418 -0.433721 0.729271       1   VIX         -0.839971    -0.708645 -0.822588 0.232618    1
Table 5
Transition probability matrix for VIX
                                          Next day State
Current State              1          2        3         4       5       6
                1      95.9%       4.1%    0.0%       0.0%    0.0%    0.0%
                2       9.9%      82.0%    7.9%       0.2%    0.0%    0.0%
                3       0.0%      16.3%   75.1%       8.5%    0.2%    0.0%
                4       0.0%       0.4%   22.1%      68.5%    8.1%    0.9%
                5       0.0%       0.0%    0.0%      22.0%   64.0%   14.0%
                6       0.0%       0.0%    0.0%       0.0%   10.1%   89.9%


                    Average Maximum % of all days
VIX State           Duration Duration in State
                1         24.3      578   56.2%
                2          5.6       37   23.1%
                3          4.0       16   11.3%
                4          3.2       25     4.5%
                5          2.8       10     1.9%
                6          9.9       64     3.0%


Notes:
Based on daily data.

More Related Content

Featured

2024 State of Marketing Report – by Hubspot
2024 State of Marketing Report – by Hubspot2024 State of Marketing Report – by Hubspot
2024 State of Marketing Report – by HubspotMarius Sescu
 
Everything You Need To Know About ChatGPT
Everything You Need To Know About ChatGPTEverything You Need To Know About ChatGPT
Everything You Need To Know About ChatGPTExpeed Software
 
Product Design Trends in 2024 | Teenage Engineerings
Product Design Trends in 2024 | Teenage EngineeringsProduct Design Trends in 2024 | Teenage Engineerings
Product Design Trends in 2024 | Teenage EngineeringsPixeldarts
 
How Race, Age and Gender Shape Attitudes Towards Mental Health
How Race, Age and Gender Shape Attitudes Towards Mental HealthHow Race, Age and Gender Shape Attitudes Towards Mental Health
How Race, Age and Gender Shape Attitudes Towards Mental HealthThinkNow
 
AI Trends in Creative Operations 2024 by Artwork Flow.pdf
AI Trends in Creative Operations 2024 by Artwork Flow.pdfAI Trends in Creative Operations 2024 by Artwork Flow.pdf
AI Trends in Creative Operations 2024 by Artwork Flow.pdfmarketingartwork
 
PEPSICO Presentation to CAGNY Conference Feb 2024
PEPSICO Presentation to CAGNY Conference Feb 2024PEPSICO Presentation to CAGNY Conference Feb 2024
PEPSICO Presentation to CAGNY Conference Feb 2024Neil Kimberley
 
Content Methodology: A Best Practices Report (Webinar)
Content Methodology: A Best Practices Report (Webinar)Content Methodology: A Best Practices Report (Webinar)
Content Methodology: A Best Practices Report (Webinar)contently
 
How to Prepare For a Successful Job Search for 2024
How to Prepare For a Successful Job Search for 2024How to Prepare For a Successful Job Search for 2024
How to Prepare For a Successful Job Search for 2024Albert Qian
 
Social Media Marketing Trends 2024 // The Global Indie Insights
Social Media Marketing Trends 2024 // The Global Indie InsightsSocial Media Marketing Trends 2024 // The Global Indie Insights
Social Media Marketing Trends 2024 // The Global Indie InsightsKurio // The Social Media Age(ncy)
 
Trends In Paid Search: Navigating The Digital Landscape In 2024
Trends In Paid Search: Navigating The Digital Landscape In 2024Trends In Paid Search: Navigating The Digital Landscape In 2024
Trends In Paid Search: Navigating The Digital Landscape In 2024Search Engine Journal
 
5 Public speaking tips from TED - Visualized summary
5 Public speaking tips from TED - Visualized summary5 Public speaking tips from TED - Visualized summary
5 Public speaking tips from TED - Visualized summarySpeakerHub
 
ChatGPT and the Future of Work - Clark Boyd
ChatGPT and the Future of Work - Clark Boyd ChatGPT and the Future of Work - Clark Boyd
ChatGPT and the Future of Work - Clark Boyd Clark Boyd
 
Getting into the tech field. what next
Getting into the tech field. what next Getting into the tech field. what next
Getting into the tech field. what next Tessa Mero
 
Google's Just Not That Into You: Understanding Core Updates & Search Intent
Google's Just Not That Into You: Understanding Core Updates & Search IntentGoogle's Just Not That Into You: Understanding Core Updates & Search Intent
Google's Just Not That Into You: Understanding Core Updates & Search IntentLily Ray
 
Time Management & Productivity - Best Practices
Time Management & Productivity -  Best PracticesTime Management & Productivity -  Best Practices
Time Management & Productivity - Best PracticesVit Horky
 
The six step guide to practical project management
The six step guide to practical project managementThe six step guide to practical project management
The six step guide to practical project managementMindGenius
 
Beginners Guide to TikTok for Search - Rachel Pearson - We are Tilt __ Bright...
Beginners Guide to TikTok for Search - Rachel Pearson - We are Tilt __ Bright...Beginners Guide to TikTok for Search - Rachel Pearson - We are Tilt __ Bright...
Beginners Guide to TikTok for Search - Rachel Pearson - We are Tilt __ Bright...RachelPearson36
 

Featured (20)

2024 State of Marketing Report – by Hubspot
2024 State of Marketing Report – by Hubspot2024 State of Marketing Report – by Hubspot
2024 State of Marketing Report – by Hubspot
 
Everything You Need To Know About ChatGPT
Everything You Need To Know About ChatGPTEverything You Need To Know About ChatGPT
Everything You Need To Know About ChatGPT
 
Product Design Trends in 2024 | Teenage Engineerings
Product Design Trends in 2024 | Teenage EngineeringsProduct Design Trends in 2024 | Teenage Engineerings
Product Design Trends in 2024 | Teenage Engineerings
 
How Race, Age and Gender Shape Attitudes Towards Mental Health
How Race, Age and Gender Shape Attitudes Towards Mental HealthHow Race, Age and Gender Shape Attitudes Towards Mental Health
How Race, Age and Gender Shape Attitudes Towards Mental Health
 
AI Trends in Creative Operations 2024 by Artwork Flow.pdf
AI Trends in Creative Operations 2024 by Artwork Flow.pdfAI Trends in Creative Operations 2024 by Artwork Flow.pdf
AI Trends in Creative Operations 2024 by Artwork Flow.pdf
 
Skeleton Culture Code
Skeleton Culture CodeSkeleton Culture Code
Skeleton Culture Code
 
PEPSICO Presentation to CAGNY Conference Feb 2024
PEPSICO Presentation to CAGNY Conference Feb 2024PEPSICO Presentation to CAGNY Conference Feb 2024
PEPSICO Presentation to CAGNY Conference Feb 2024
 
Content Methodology: A Best Practices Report (Webinar)
Content Methodology: A Best Practices Report (Webinar)Content Methodology: A Best Practices Report (Webinar)
Content Methodology: A Best Practices Report (Webinar)
 
How to Prepare For a Successful Job Search for 2024
How to Prepare For a Successful Job Search for 2024How to Prepare For a Successful Job Search for 2024
How to Prepare For a Successful Job Search for 2024
 
Social Media Marketing Trends 2024 // The Global Indie Insights
Social Media Marketing Trends 2024 // The Global Indie InsightsSocial Media Marketing Trends 2024 // The Global Indie Insights
Social Media Marketing Trends 2024 // The Global Indie Insights
 
Trends In Paid Search: Navigating The Digital Landscape In 2024
Trends In Paid Search: Navigating The Digital Landscape In 2024Trends In Paid Search: Navigating The Digital Landscape In 2024
Trends In Paid Search: Navigating The Digital Landscape In 2024
 
5 Public speaking tips from TED - Visualized summary
5 Public speaking tips from TED - Visualized summary5 Public speaking tips from TED - Visualized summary
5 Public speaking tips from TED - Visualized summary
 
ChatGPT and the Future of Work - Clark Boyd
ChatGPT and the Future of Work - Clark Boyd ChatGPT and the Future of Work - Clark Boyd
ChatGPT and the Future of Work - Clark Boyd
 
Getting into the tech field. what next
Getting into the tech field. what next Getting into the tech field. what next
Getting into the tech field. what next
 
Google's Just Not That Into You: Understanding Core Updates & Search Intent
Google's Just Not That Into You: Understanding Core Updates & Search IntentGoogle's Just Not That Into You: Understanding Core Updates & Search Intent
Google's Just Not That Into You: Understanding Core Updates & Search Intent
 
How to have difficult conversations
How to have difficult conversations How to have difficult conversations
How to have difficult conversations
 
Introduction to Data Science
Introduction to Data ScienceIntroduction to Data Science
Introduction to Data Science
 
Time Management & Productivity - Best Practices
Time Management & Productivity -  Best PracticesTime Management & Productivity -  Best Practices
Time Management & Productivity - Best Practices
 
The six step guide to practical project management
The six step guide to practical project managementThe six step guide to practical project management
The six step guide to practical project management
 
Beginners Guide to TikTok for Search - Rachel Pearson - We are Tilt __ Bright...
Beginners Guide to TikTok for Search - Rachel Pearson - We are Tilt __ Bright...Beginners Guide to TikTok for Search - Rachel Pearson - We are Tilt __ Bright...
Beginners Guide to TikTok for Search - Rachel Pearson - We are Tilt __ Bright...
 

20 Years of VIX: Fear, Greed and Implications for Traditional Asset Classes

  • 1. 20 years of VIX: Fear, Greed and Implications for Traditional Asset Classes The Abstract In this article, I investigate the statistical properties and relationships of VIX with equities, commodities, real estate and bonds. I find that different VIX states result in very different risk adjusted performance for all asset classes, not just equities, and that significant deviations from normality are observed for each state as well as the full sample. Additionally, I demonstrate that correlations among asset classes are unstable and non-linear, leading to highly concentrated diversification benefits at the times of market stress, which a broad set of exposures is likely to negate. Based on empirical data, practical recommendations for investment analysis and risk management are included throughout the article. A companion article on alternative investment strategies called “20 Years of VIX: Fear, Greed and Implications for Alternative Investment Strategies” is available at http://ssrn.com/abstract=1597904 Mikhail Munenzon, CFA, CAIA mikhailmunenzon@gmail.com
  • 2. Introduction Whaley (1993) introduced the VIX index. In the same year, the Chicago Board Options Exchange (CBOE) introduced the CBOE Volatility Index and it quickly became the benchmark for stock market volatility and, more broadly, investor sentiment. The first VIX was a weighted measure of the implied volatility with 30 days to expiration of eight S&P 100 at-the-money put and call options. Ten years later, it expanded to use options based on a broader index, the SP 500, which allows for a more accurate view of investors' expectations on future market volatility. On March 26, 2004, the first ever trading in futures on the VIX index began on the CBOE. Based on the methodology for SP 500, the index has historical information going back to the start of 1990. Why should an investor care about volatility? Black (1975) suggested that the informed investors would try to take advantage of their views through the options market because of the leverage such instruments provided. Therefore, clues from the options market may have implications for the performance characteristics of a security (for example, see Bali and Hovakimian (2009) and Doran and Krieger (2010)). Moreover, starting with the work of Engle (1982) and Bollerslev(1986), evidence emerged documenting the clustering behavior of volatility1 and its resulting predictability. Consequently, if different volatility states are associated with different performance characteristics of a security, an investor’s investment and risk management policies will need to be flexible enough to incorporate that such information. In this article, I investigate the statistical characteristics of the VIX index and its relationship not just with SP 500 but also with other traditional asset classes, which can 1 High volatility is like to be followed by high volatility; low volatility is likely to be followed by low volatility. 2
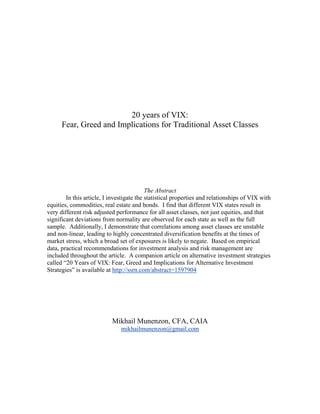
  • 3. be useful to practitioners. This article is structured as follows. After an overview of data, I will present key empirical results; concluding remarks follow. Data and Methods I used data for the following asset classes: equities – SP 500 Total Return Index; bonds - JPM Morgan Aggregate Bond Total Return Index; commodities – SP GSCI Commodities Index; real estate – FTSE EPRA/NAREIT US Total Return Index2. The daily data for the indices was downloaded via Bloomberg. The full historical time horizon for this analysis is 1/2/1990 to 1/29/2010. Based on the level of VIX, I divided the full historical sample into 6 groups to evaluate any differences in results as compared to the full sample, assuming one remains invested only when VIX is in that particular state. Such classification is broadly consistent with Figure 1 and practitioners’ views on what constitutes low, medium and high volatility and provides a practical way of judging any changes in performance and other characteristics of asset classes, given a VIX state. Key Empirical Results Figure 1 shows the historical level of VIX and cumulative return graphs for the asset classes and VIX. Though the starting and ending points for VIX are relatively comparable, the range of results is very high; one also finds that there are extended periods of high and low volatility. The figure also suggests that crashes don’t just happen – they are generally preceded by periods of increasing turbulence, which ultimately push markets over the edge. 2 Some investors consider commodities and real estate alternative asset classes, as compared to stocks and bonds. However, for the purposes of this analysis, I consider all such asset classes to be traditional ingredients in an investment program. 3
  • 4. Table 1 presents key statistical information on VIX and the asset classes for the full historical period. For all the asset classes, cumulative returns are strongly positive, especially real estate3. However, the peaks and troughs for each asset class are very large – evidence of fat tails of distributions, as seen in high kurtosis. Moreover, the assumption that returns follow a normal distribution, one of the fundamental assumptions of classical finance, can be strongly rejected for all the indices4. Not only do we not observe normality, but we also find serial correlation across all time series5, which is inconsistent with a random walk model. In classical finance, correlation6, a linear measure of dependency, plays a key role in portfolio risk measurement and optimization. In Table 4, one can see that in the full sample, correlations among asset classes are relatively low (particularly, between SP500 and SP GSCI indices) and all asset classes have very low correlation with VIX. Finally, because of fat tails, historical VaR significantly understates realistic losses one can experience in adverse scenarios, as measured by historical CVaR7. Which states dominated historically? The first state (VIX below 20%) accounted for over 50% of all days in the historical sample due to extended periods of calm in the 90s and, to a lesser extent, in the middle of this decade (Table 5). The first 3 states (VIX 3 Secular decline in long term interest rates and the subsequent real estate bubble, which is still being resolved, also played key roles. 4 For a normal distribution, skewness should be 0 and kurtosis should be 3. 5 Positive returns are likely to be followed by positive returns and negative returns are likely to be followed by negative returns 6 Throughout the paper, correlation refers to what is more formally known as Pearson product-moment correlation coefficient, which is used extensively by practitioners and academics to model dependence. 7 VaR(a) is defined as the probability of a loss less than or equal to quantity Q, with the confidence level of a. Thus, it stops at the start of extreme events and does not analyze the tail. CVaR(a) is defined as the average loss once Q is exceeded, with the confidence level of a. Historical based measures are evaluated based on historical data and thus fully incorporate all features of a distribution of a return series. If one assumes a normal distribution of returns, one can find VaR of a a return series via an analytical formula with just its mean and volatility. However, such a measure will understate the realistic extent of losses even more than the historical VaR. For example, for SP 500, the normal VaR(95%) in the full sample is 0.01%.. For more detail, the reader is referred to Alexander (2008). 4
  • 5. at up to 30%) accounted for over 90% of all days. However, as seen in the historical VIX chart, the last decade was far more volatile than the decade of the 90s. In addition, once in a particular state, VIX is very likely to remain in that state for a period of time, as transitions occur gradually. How similar are risk/return properties of asset classes in various states and relative to the full historical sample? Very dissimilar (Tables 2 and 3). In fact, they are so dissimilar that if one relies on the average figures from this long data sample, one may face the risk of drowning in a pool that is on average only a foot deep by ignoring the full spectrum of information for investment analysis and risk management. Only bonds provide cumulatively positive returns across all the states. Unsurprisingly, equities are extremely sensitive to different levels of VIX even if extreme changes in returns across states may be surprising, going from the cumulative return feast in state 1 to famine in state 6 and meaningful gains or losses in the intermediate states. It is worth noting that in the full sample, the percentage of positive days is close to 50% for all assets, suggesting that it is the magnitude of returns (or losses) that drove performance, rather than the frequency of positive days. However, the percentage of positive days for equities drops very quickly as VIX rises (again, only the bond market continues to deliver positive returns in over 50% of days in each of the states). The picture for commodities and real estate is a little more mixed than that for equities. While one loses money in those asset classes in states 3, 4 (SP GSCI is actually very slightly positive on a cumulative basis) and 6, one makes money in state 5. As with equities, the percentage of positive days for commodities and equities drops as VIX rises (with the exception of commodities in state 4). Finally, it is interesting to observe that normal distribution remains a very poor 5
  • 6. descriptor of return frequencies for all the asset classes in all the states. Similarly, serial correlation generally remains present as well. How consistent are cumulative returns for asset classes in various states (Figures 2-4)? They are very consistent at the extreme states 1 and 6. In state 1, all are positive, especially equities and real estate. In state 6, all asset classes, except fixed income, drop very sharply and fixed income produces a return. Also, equities and fixed income exhibit a generally consistent pattern of returns in each state – with the exception of state 2, equities do not appear to respond well to rising volatility and bonds show a generally steady, upward pattern. However, the picture is mixed for the intermediate states for commodities and real estate, with both having up and down periods in the same state. For example, in state 3, SP GSCI is significantly down on a cumulative basis in the first half of that state but then has a period of positive returns in the second half; this situation is repeated in state 4 for real estate. In state 5, cumulatively positive returns for real estate and commodities are almost entirely due to the period in early 2009, as the extraordinary volatility of the 2008 crash began to subside. These results suggest that other factors may be driving such divergent performances, such as interest rates or the prior volatility state. Given the prior discussion of returns in different states, it is not surprising to find how unstable correlations are across states (Table 4). For example, in state 6, equities, commodities and real estate are almost perfectly synchronized while VIX and bonds have significant negative correlation; all asset classes are also closely synchronized in state 1. In state 3, however, such correlations for equities, commodities and real estate are quite different. Such behavior suggests that not only are dependencies among asset classes 6
  • 7. time varying, but that they are also non-linear. Therefore, correlation may not be an appropriate means of evaluating dependence among asset classes8. Moreover, while at the points of extreme stress, diversification can provide protection at the asset class level, such benefits are limited only to bonds, and this result is consistent across the full sample. Finally, given the non-synchronized relationship of VIX with asset classes, it should play a useful role in an investment program by helping investors minimize potential losses and thus enhance portfolio performance. Conclusions The level of VIX seems to have important and different implications for return expectations for all asset classes, not just equities. This is particularly true for the extreme levels of VIX. Though the historical range for VIX is very broad, it exhibits clustering, which make it useful for forecasting. I further present evidence that during the historical period used in the article, several important assumptions of classical finance – normal distribution, randomness of data (no serial correlation) and the use of correlation to describe dependence – find limited support in empirical data. Therefore, a practitioner should generate value by incorporating more realistic assumptions to model markets for investment analysis and risk management, such as non-normal distributions which can incorporate skews and fat tails of returns and copulas which can capture non-linearity of dependencies, particularly in the tails. Further, I demonstrate that only bonds consistently provided downside protection at times of market stress in the full sample. 8 Correlation will correctly describe dependence structure only in very particular cases, such as multivariate normal distributions. Also, at extremes, correlation should be zero for a multivariate normal distribution, which is not empirically supported. For a more detailed critique on the use of correlations to model dependence, see Embrechts et al (2002). 7
  • 8. Consequently, while diversification can add value at the asset class level, its benefits are highly concentrated when they are needed most, which a broad set of exposures is likely to minimize significantly. Also, given the performance characteristics of VIX and its relationship with other assets, its inclusion in an investment program should provide valuable benefits in risk management. The analytical framework presented in this article can be refined further by adding more factors deemed important, such as inflation or information about the prior VIX state; it can also be extended to sectors within an asset class and alternative investment strategies. Finally, while we do not know which volatility states will dominate in the future or how long they may last, greater awareness of the current investment environment, its implications for risk adjusted performance and flexible investment policies to position portfolios appropriately should help investors produce more consistent results. References Alexander, C. 2008. Value at Risk Models John Wiley & Sons. Bali, T. and A. Hovakimian. 2009. “Volatility Spreads and Expected stock Returns.” Management Science, vol. 55, no. 11 (November): 1797-1812. Black, F. 1975. “Fact and Fantasy in the Use of Options.” Financial Analysts Journal, vol. 31, no. 4 (July/August): 36-41. Bollerslev, T. 1986. “Generalized Autoregressive Conditional Heteroskedasticity.” Journal of Econometrics 31: 307-327. 8
  • 9. Doran J. and K. Krieger. 2010. “Implications for Asset Returns in the Implied Volatility Skew.” Financial Analysts Journal, vol. 66, no, 1 (January/February): 65-76. Engle, R. 1982. “Autoregressive Conditional Heteroskedasticity with Estimates of the Variance of UK inflation.” Econometrica 50: 987-1007. Embrechts, P, A. McNeil, and D. Straumann. 2002. “Correlation and dependence in risk management: Properties and Pitfalls.” In M. Dempster (e.d), Risk Management: Value at Risk and Beyond. Cambridge University Press. Whaley, R. 1993. “Derivatives on Market Volatility: Hedging Tools Long Overdue.” Journal of Derivatives, 1 (Fall): 71-84. 9
  • 10. Cumulative Return VIX 0 2 4 6 8 10 12 14 16 18 20 Figure 1 0 10 20 30 40 50 60 70 80 90 1/2/1990 1/2/1990 1/2/1991 1/2/1991 1/2/1992 1/2/1992 1/2/1993 1/2/1993 SP 500 Total Return 1/2/1994 1/2/1994 1/2/1995 1/2/1995 1/2/1996 1/2/1996 1/2/1997 1/2/1997 FTSE EPRA/NAREIT US Total Return 1/2/1998 1/2/1998 1/2/1999 1/2/1999 1/2/2000 1/2/2000 Date Date 1/2/2001 1/2/2001 1/2/2002 SP GSCI 1/2/2002 Historical VIX (1/2/1990-1/29/2010) 1/2/2003 1/2/2003 1/2/2004 1/2/2004 Cumulative Return - Full Historical Sample 1/2/2005 1/2/2005 1/2/2006 1/2/2006 1/2/2007 1/2/2007 1/2/2008 1/2/2008 1/2/2009 1/2/2009 JP Morgan US Aggregate Bond Total Return 1/2/2010 1/2/2010
  • 11. Cumulative Return Cumulative Return 0 2 4 6 8 10 12 14 16 18 20 0.5 1 1.5 2 2.5 3 Figure 2 '1/3/1990' '1/5/1990' '4/4/1991' '4/17/1990' '8/22/1991' '12/21/1990' '1/17/1992' '4/8/1992' '6/3/1992' SP 500 Total Return '10/21/1992' SP 500 Total Return '4/1/1997' '3/5/1993' '8/8/1997' '7/20/1993' '12/5/1997' '12/2/1993' '4/16/1998' '4/21/1994' FTSE EPRA/NAREIT US Total Return '11/24/1998' '9/5/1994' FTSE EPRA/NAREIT US Total Return '1/18/1995' '4/28/1999' '6/2/1995' '9/9/1999' '10/17/1995' '12/14/1999' '2/29/1996' '3/8/2000' '7/19/1996' Date Date '12/11/1996' '7/6/2000' '2/19/1998' SP GSCI '1/30/2001' SP GSCI '8/28/2000' '6/15/2001' '7/18/2003' '11/21/2001' '12/19/2003' '5/11/2004' Cumulative Return - State 1 of VIX (<=20) '2/12/2002' '9/23/2004' '1/3/2003' Cumulative Return - State 2 of VIX (>20 and <=25) '2/7/2005' '8/5/2003' '6/22/2005' '10/30/2007' '11/4/2005' '3/21/2006' '4/4/2008' '8/8/2006' '8/1/2008' '12/21/2006' JP Morgan US Aggregate Bond Total Return JP Morgan US Aggregate Bond Total Return '9/22/2009' '5/7/2007' '12/18/2009' '5/16/2008'
  • 12. Cumulative Return Cumulative Return 0.5 0.7 0.9 1.1 1.3 Figure 3 0.6 0.7 0.8 0.9 1 1.1 1.2 1.3 1.4 '8/7/1990' '1/5/1990' '10/11/1990' '2/21/1990' '11/2/1990' '4/17/1990' '10/29/1997' '11/16/1990' SP 500 Total Return '8/4/1998' '12/21/1990' SP 500 Total Return '9/25/1998' '2/21/1991' '10/27/1998' '4/8/1992' '2/10/1999' '1/9/1997' FTSE EPRA/NAREIT US Total Return '3/21/2001' '4/1/1997' FTSE EPRA/NAREIT US Total Return '9/11/2001' '6/19/1997' '10/5/2001' '8/8/1997' '10/29/2001' '9/18/1997' '7/29/2002' '12/5/1997' Date Date '9/26/2002' '2/5/1998' SP GSCI '10/29/2002' '4/16/1998' '6/3/1998' SP GSCI '12/5/2002' '2/4/2003' '11/24/1998' '2/18/2003' '3/18/1999' Cumulative Return - State 4 of VIX (>30 and <=35) Cumulative Return - State 3 of VIX (>25 and <=30) '3/5/2003' '4/28/1999' '3/19/2003' '7/23/1999' '9/16/2008' '9/9/1999' '5/7/2009' '11/3/1999' '5/25/2009' '12/14/1999' JP Morgan US Aggregate Bond Total Return JP Morgan US Aggregate Bond Total Return '6/18/2009' '1/25/2000'
  • 13. Cumulative Return Cumulative Return 0 0.2 0.4 0.6 0.8 1 1.2 0.7 0.8 0.9 1 1.1 1.2 1.3 1.4 1.5 1.6 Figure 4 '8/31/1998' '8/6/1990' '9/30/1998' '10/30/1997' '10/9/1998' '11/12/1997' '7/22/2002' '10/7/2002' '9/2/1998' SP 500 Total Return SP 500 Total Return '10/7/2008' '9/16/1998' '10/16/2008' '9/29/1998' '10/27/2008' '9/26/2001' '11/5/2008' FTSE EPRA/NAREIT US Total Return '7/15/2002' FTSE EPRA/NAREIT US Total Return '11/14/2008' '7/24/2002' '11/25/2008' '8/8/2002' '12/4/2008' Date '9/4/2002' Date '12/15/2008' '9/12/2002' '12/24/2008' SP GSCI '9/20/2002' SP GSCI '1/9/2009' '1/20/2009' '10/2/2002' Cumulative Return - State 6 of VIX (>40) '1/30/2009' '10/14/2002' Cumulative Return - State 5 of Vix (>35 and <=40) '2/10/2009' '9/30/2008' '2/19/2009' '1/5/2009' '3/2/2009' '4/9/2009' '3/11/2009' '4/16/2009' '3/20/2009' '4/24/2009' JP Morgan US Aggregate Bond Total Return '3/31/2009' JP Morgan US Aggregate Bond Total Return '5/1/2009'
  • 14. Table 1 1/2/1990-1/31/2010 SPX GSCI NAREIT JPMAGG VIX daily data Arithmetic avg return 0.0357% 0.0253% 0.0554% 0.0264% 0.1763% Compounded avg return 0.0291% 0.0158% 0.0426% 0.0261% 0.0068% max 11.6% 7.8% 18.4% 1.3% 64.2% min -9.0% -16.9% -19.5% -1.5% -25.9% vol 1.2% 1.4% 1.6% 0.3% 5.9% VaR (95%) -1.7% -2.1% -1.7% -0.4% -8.2% VaR (99%) -3.1% -3.7% -5.2% -0.7% -12.4% CVaR(95%) -2.7% -3.2% -3.8% -0.5% -11.2% CVaR(99%) -4.6% -5.2% -8.0% -0.8% -15.8% Skewness 0.00 -0.40 0.47 -0.14 1.23 Kurtosis 12.71 10.74 33.85 4.77 10.91 Number of days 5,238 5,238 5,238 5,238 5,238 Normality at 95% confidence level? No No No No No p-values 0.1% 0.1% 0.1% 0.1% 0.1% No serial correlation at 95% confidence level? No No No No No p-values 0.0% 0.0% 0.0% 0.0% 0.0% Cumulative Return 358.7% 129.2% 833.0% 292.9% 42.8% % of days with positive returns 51.7% 49.3% 51.9% 53.0% 45.8% Notes: Jarque-Bera test was used to evaluate normality of a time series; null hypothesis is stated in the question. Ljung-Box test with 20 lags was used to evaluate serial correlation of a time series; null hypothesis is stated in the question. SPX - SP500 Total Return GSCI - SP GSCI NAREIT - FTSE EPRA/NAREIT US Total Return JPMAGG - JPM Morgan Aggregate Bond Total Return VIX - VIX Index
  • 15. Table 2 State 1 - VIX <=20 SPX GSCI NAREIT JPMAGG VIX daily Arithmetic avg return 0.0983% 0.0411% 0.1004% 0.0254% -0.1932% Compounded avg return 0.0962% 0.0351% 0.0976% 0.0252% -0.3318% max 2.9% 6.8% 3.6% 1.0% 64.2% min -3.5% -4.6% -4.8% -1.1% -25.9% vol 0.7% 1.1% 0.7% 0.2% 5.3% VaR (95%) -1.0% -1.8% -1.1% -0.3% -8.0% VaR (99%) -1.6% -2.8% -2.0% -0.6% -12.1% CVaR(95%) -1.4% -2.4% -1.7% -0.5% -10.8% CVaR(99%) -1.9% -3.4% -2.8% -0.7% -15.3% Skewness 0.02 0.18 -0.33 -0.04 1.25 Kurtosis 4.16 5.06 7.03 4.77 13.94 Number of days 2,945 2,945 2,945 2,945 2,945 Normality at 95% confidence level? No No No No No p-values 0.1% 0.1% 0.1% 0.1% 0.1% No serial correlation at 95% confidence level? Yes Yes No No No p-values 49.5% 13.0% 1.1% 0.9% 0.0% Cumulative Return 1595.7% 181.1% 1669.5% 109.9% -100.0% % of days with positive returns 55.3% 49.3% 55.2% 52.7% 43.5% State 2 - VIX >20 & <=25 SPX GSCI NAREIT JPMAGG VIX daily Arithmetic avg return 0.0461% 0.0482% 0.0794% 0.0232% 0.4603% Compounded avg return 0.0402% 0.0398% 0.0729% 0.0228% 0.2832% max 4.8% 6.2% 6.5% 0.8% 51.7% min -3.7% -5.5% -6.7% -1.5% -23.1% vol 1.1% 1.3% 1.1% 0.3% 6.1% VaR (95%) -1.7% -2.1% -1.5% -0.4% -7.8% VaR (99%) -2.5% -3.2% -3.1% -0.7% -11.7% CVaR(95%) -2.2% -2.8% -2.5% -0.6% -10.5% CVaR(99%) -2.8% -3.9% -3.9% -0.8% -14.5% Skewness 0.24 -0.04 0.58 -0.27 1.51 Kurtosis 3.78 4.22 9.21 4.53 12.41 Number of days 1,210 1,210 1,210 1,210 1,210 Normality at 95% confidence level? No No No No No p-values 0.1% 0.1% 0.1% 0.1% 0.1% No serial correlation at 95% confidence level? Yes Yes No Yes No p-values 9.4% 22.4% 0.0% 40.9% 0.0% Cumulative Return 62.7% 61.9% 141.4% 31.8% 2961.5% % of days with positive returns 49.4% 49.9% 50.7% 51.7% 47.7% State 3 - VIX >25 & <=30 SPX GSCI NAREIT JPMAGG VIX daily Arithmetic avg return -0.0776% -0.0227% -0.0296% 0.0230% 0.4789% Compounded avg return -0.0872% -0.0373% -0.0392% 0.0226% 0.2802% max 5.0% 5.9% 8.8% 0.9% 40.7% min -3.8% -16.9% -7.0% -0.9% -20.0% vol 1.4% 1.7% 1.4% 0.3% 6.4% VaR (95%) -2.3% -2.8% -2.1% -0.5% -9.5% VaR (99%) -2.9% -4.7% -4.3% -0.8% -12.6% CVaR(95%) -2.7% -4.1% -3.5% -0.6% -11.8% CVaR(99%) -3.2% -7.1% -5.5% -0.8% -15.0% Skewness 0.27 -1.76 0.20 -0.36 0.72 Kurtosis 3.23 19.72 9.96 3.68 6.01 Number of days 590 590 590 590 590 Normality at 95% confidence level? No No No No No p-values 1.9% 0.1% 0.1% 0.1% 0.1% No serial correlation at 95% confidence level? Yes Yes No Yes Yes p-values 11.0% 12.8% 0.0% 84.1% 56.6% Cumulative Return -40.2% -19.8% -20.7% 14.3% 421.0% % of days with positive returns 44.6% 48.8% 45.6% 54.6% 49.3% Notes: Jarque-Bera test was used to evaluate normality of a time series; null hypothesis is stated in the question. Ljung-Box test with 20 lags was used to evaluate serial correlation of a time series; null hypothesis is stated in the question. SPX - SP500 Total Return GSCI - SP GSCI NAREIT - FTSE EPRA/NAREIT US Total Return JPMAGG - JPM Morgan Aggregate Bond Total Return VIX - VIX Index
  • 16. Table 3 State 4 - VIX >30 & <=35 SPX GSCI NAREIT JPMAGG VIX daily Arithmetic avg return -0.1244% 0.0223% 0.0049% 0.0447% 1.4675% Compounded avg return -0.1412% 0.0080% -0.0186% 0.0443% 1.2604% max 5.4% 5.1% 10.9% 0.8% 34.3% min -6.9% -4.3% -8.9% -0.7% -14.4% vol 1.8% 1.7% 2.2% 0.3% 6.6% VaR (95%) -2.9% -3.1% -3.4% -0.5% -8.1% VaR (99%) -4.9% -4.0% -7.2% -0.7% -12.1% CVaR(95%) -4.1% -3.6% -5.5% -0.6% -10.1% CVaR(99%) -5.8% -4.2% -8.2% -0.7% -13.4% Skewness 0.04 0.11 0.59 -0.15 1.00 Kurtosis 4.09 3.42 10.43 3.23 5.82 Number of days 235 235 235 235 235 Normality at 95% confidence level? No Yes No Yes No p-values 1.0% 28.9% 0.1% 47.3% 0.1% No serial correlation at 95% confidence level? Yes Yes No No Yes p-values 49.6% 6.1% 0.0% 0.6% 21.7% Cumulative Return -28.2% 1.9% -4.3% 11.0% 1798.1% % of days with positive returns 46.4% 51.5% 47.7% 59.1% 52.8% State 5 - VIX >35 & <=40 SPX GSCI NAREIT JPMAGG VIX daily Arithmetic avg return 0.0166% 0.3792% 0.4106% 0.0263% 0.6211% Compounded avg return -0.0061% 0.3565% 0.3527% 0.0259% 0.3153% max 5.7% 7.8% 13.6% 0.7% 24.9% min -4.7% -8.8% -11.2% -1.1% -17.6% vol 2.1% 2.1% 3.4% 0.3% 8.0% VaR (95%) -3.5% -2.5% -4.2% -0.4% -11.4% VaR (99%) -4.5% -7.0% -9.8% -1.0% -16.7% CVaR(95%) -4.0% -4.1% -6.8% -0.6% -13.4% CVaR(99%) -4.5% -7.0% -9.8% -1.0% -16.7% Skewness 0.29 0.09 0.61 -0.94 0.78 Kurtosis 3.09 7.89 6.32 5.81 4.09 Number of days 100 100 100 100 100 Normality at 95% confidence level? Yes No No No No p-values 40.0% 0.1% 0.1% 0.1% 0.6% No serial correlation at 95% confidence level? Yes Yes Yes Yes Yes p-values 84.1% 27.8% 65.3% 35.0% 81.3% Cumulative Return -0.6% 42.7% 42.2% 2.6% 37.0% % of days with positive returns 49.0% 56.0% 47.0% 52.0% 44.0% State 6 - VIX>40 SPX GSCI NAREIT JPMAGG VIX daily Arithmetic avg return -0.5372% -0.4839% -0.7983% 0.0562% 1.5559% Compounded avg return -0.5940% -0.5300% -1.0065% 0.0555% 1.1540% max 11.6% 7.5% 18.4% 1.3% 34.5% min -9.0% -8.1% -19.5% -1.0% -24.7% vol 3.4% 3.0% 6.5% 0.4% 9.2% VaR (95%) -5.9% -5.9% -10.0% -0.5% -10.9% VaR (99%) -8.9% -7.6% -15.0% -1.0% -21.1% CVaR(95%) -7.5% -6.7% -13.0% -0.8% -16.0% CVaR(99%) -9.0% -7.9% -17.3% -1.0% -23.0% Skewness 0.41 0.12 0.49 0.12 0.66 Kurtosis 4.22 3.25 3.64 4.36 4.77 Number of days 158 158 158 158 158 Normality at 95% confidence level? No Yes No No No p-values 0.7% 50.0% 1.9% 0.9% 0.1% No serial correlation at 95% confidence level? Yes Yes Yes No No p-values 62.0% 33.2% 30.2% 0.6% 1.9% Cumulative Return -61.0% -56.8% -79.8% 9.2% 512.8% % of days with positive returns 39.2% 37.3% 34.2% 53.8% 51.3% Notes: Jarque-Bera test was used to evaluate normality of a time series; null hypothesis is stated in the question. Ljung-Box test with 20 lags was used to evaluate serial correlation of a time series; null hypothesis is stated in the question. SPX - SP500 Total Return GSCI - SP GSCI NAREIT - FTSE EPRA/NAREIT US Total Return JPMAGG - JPM Morgan Aggregate Bond Total Return VIX - VIX Index
  • 17. Table 4 Correlation matrices Full sample SPX GSCI NAREIT JPMAGG VIX SPX 1 GSCI 0.614909 1 NAREIT 0.828916 0.846607 1 JPMAGG 0.822595 0.770811 0.864026 1 VIX 0.155275 0.061055 -0.029318 0.276768 1 State 1 - VIX <=20 State 4 - VIX >30 & <=35 SPX GSCI NAREIT JPMAGG VIX SPX GSCI NAREIT JPMAGG VIX SPX 1 SPX 1 GSCI 0.898321 1 GSCI -0.288855 1 NAREIT 0.974663 0.929054 1 NAREIT 0.308306 -0.536519 1 JPMAGG 0.910627 0.728673 0.883676 1 JPMAGG -0.71221 0.149066 0.116173 1 VIX -0.465434 -0.284836 -0.447933 -0.673159 1 VIX -0.739751 -0.118798 0.32146 0.842166 1 State 2 - VIX >20 & <=25 State 5 - VIX >35 & <=40 SPX GSCI NAREIT JPMAGG VIX SPX GSCI NAREIT JPMAGG VIX SPX 1 SPX 1 GSCI 0.786621 1 GSCI 0.291233 1 NAREIT 0.727929 0.711477 1 NAREIT 0.555915 0.720048 1 JPMAGG 0.838083 0.81479 0.914554 1 JPMAGG -0.364912 0.019158 0.28198 1 VIX -0.357736 0.011339 -0.171163 -0.151194 1 VIX -0.717426 -0.173092 -0.557295 -0.219695 1 State 3 - VIX >25 & <=30 State 6 - VIX>40 SPX GSCI NAREIT JPMAGG VIX SPX GSCI NAREIT JPMAGG VIX SPX 1 SPX 1 GSCI -0.168537 1 GSCI 0.947808 1 NAREIT 0.086168 -0.305081 1 NAREIT 0.9922 0.960259 1 JPMAGG -0.682311 0.032938 -0.248043 1 JPMAGG -0.668409 -0.811675 -0.693375 1 VIX -0.901783 0.206418 -0.433721 0.729271 1 VIX -0.839971 -0.708645 -0.822588 0.232618 1
  • 18. Table 5 Transition probability matrix for VIX Next day State Current State 1 2 3 4 5 6 1 95.9% 4.1% 0.0% 0.0% 0.0% 0.0% 2 9.9% 82.0% 7.9% 0.2% 0.0% 0.0% 3 0.0% 16.3% 75.1% 8.5% 0.2% 0.0% 4 0.0% 0.4% 22.1% 68.5% 8.1% 0.9% 5 0.0% 0.0% 0.0% 22.0% 64.0% 14.0% 6 0.0% 0.0% 0.0% 0.0% 10.1% 89.9% Average Maximum % of all days VIX State Duration Duration in State 1 24.3 578 56.2% 2 5.6 37 23.1% 3 4.0 16 11.3% 4 3.2 25 4.5% 5 2.8 10 1.9% 6 9.9 64 3.0% Notes: Based on daily data.