Download to read offline
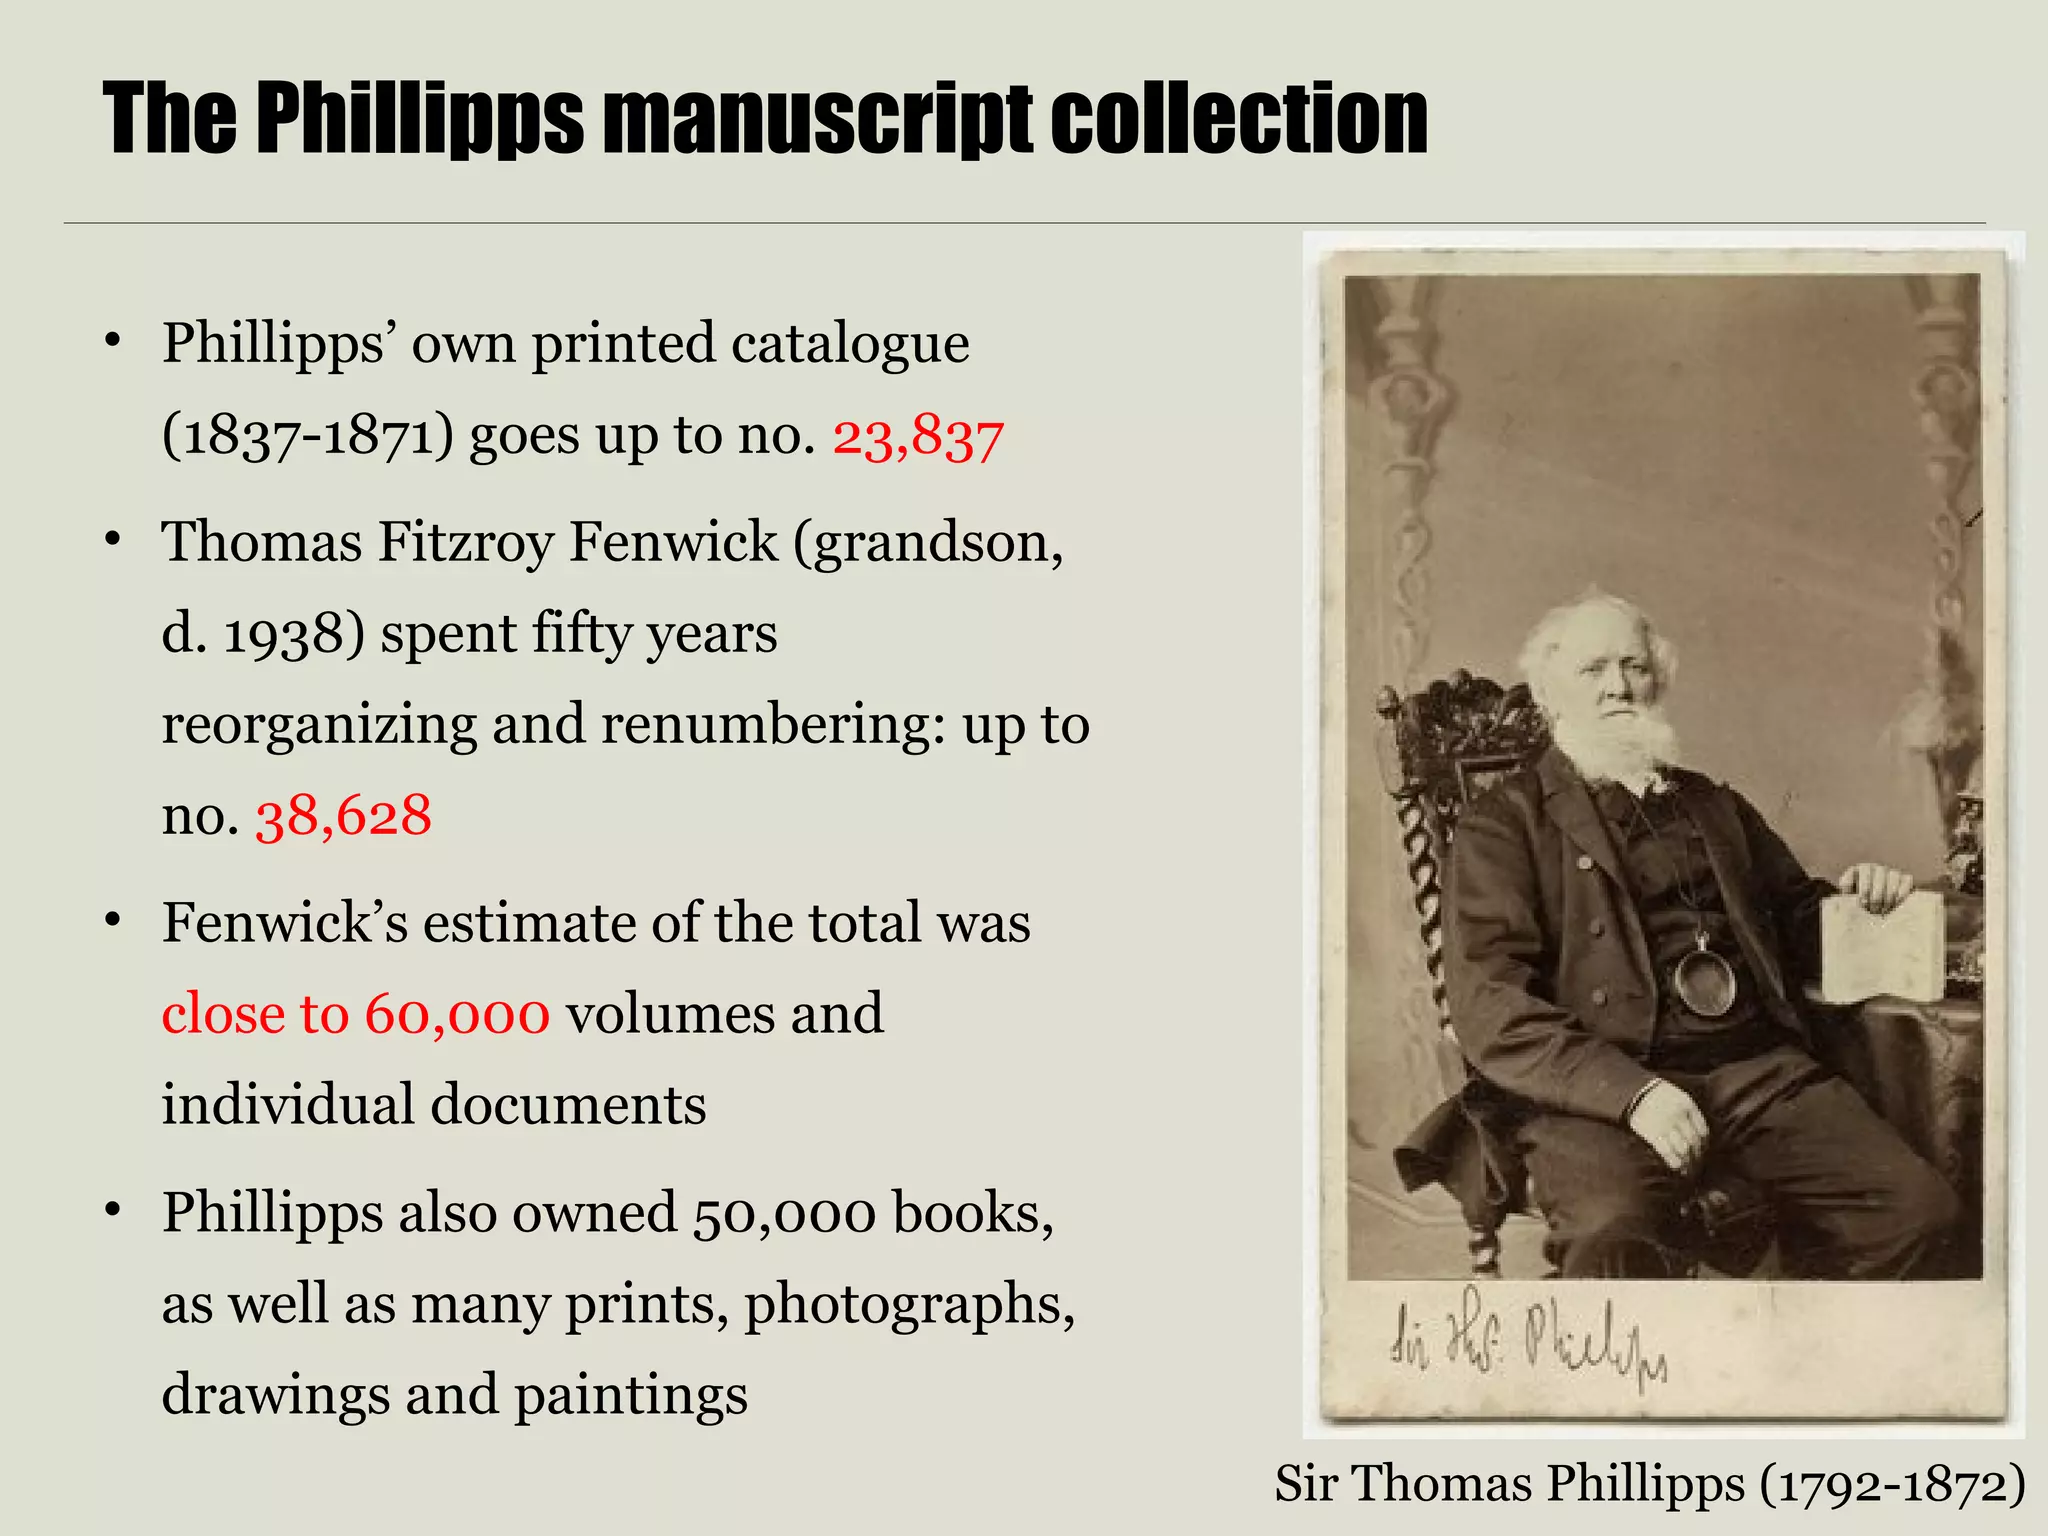
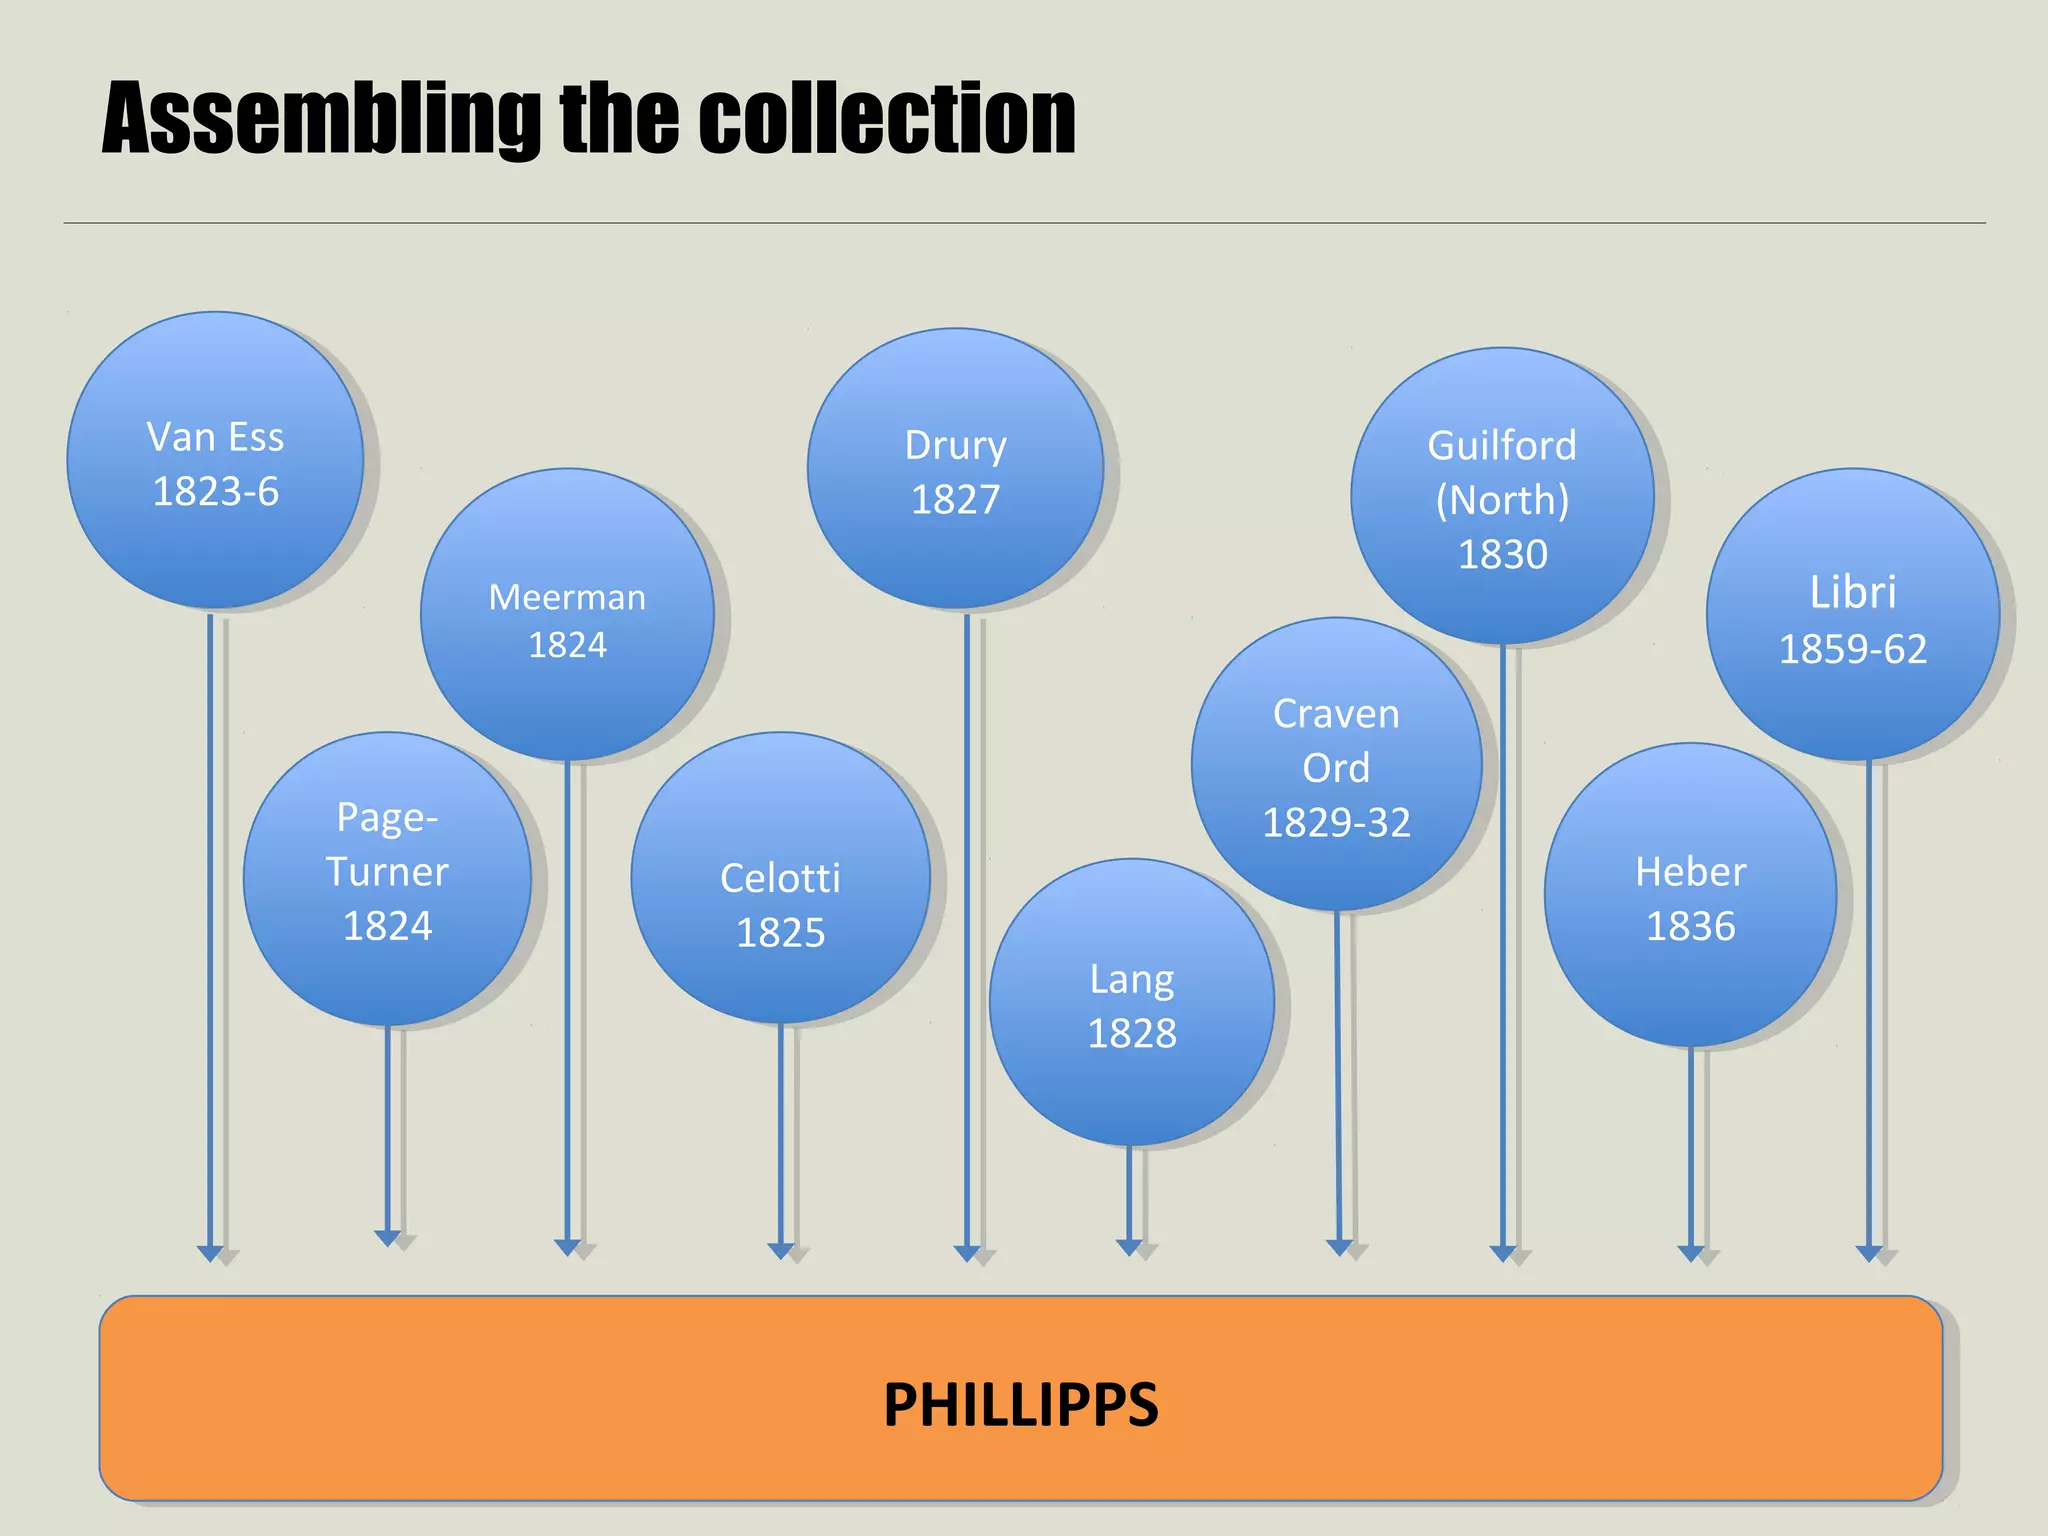
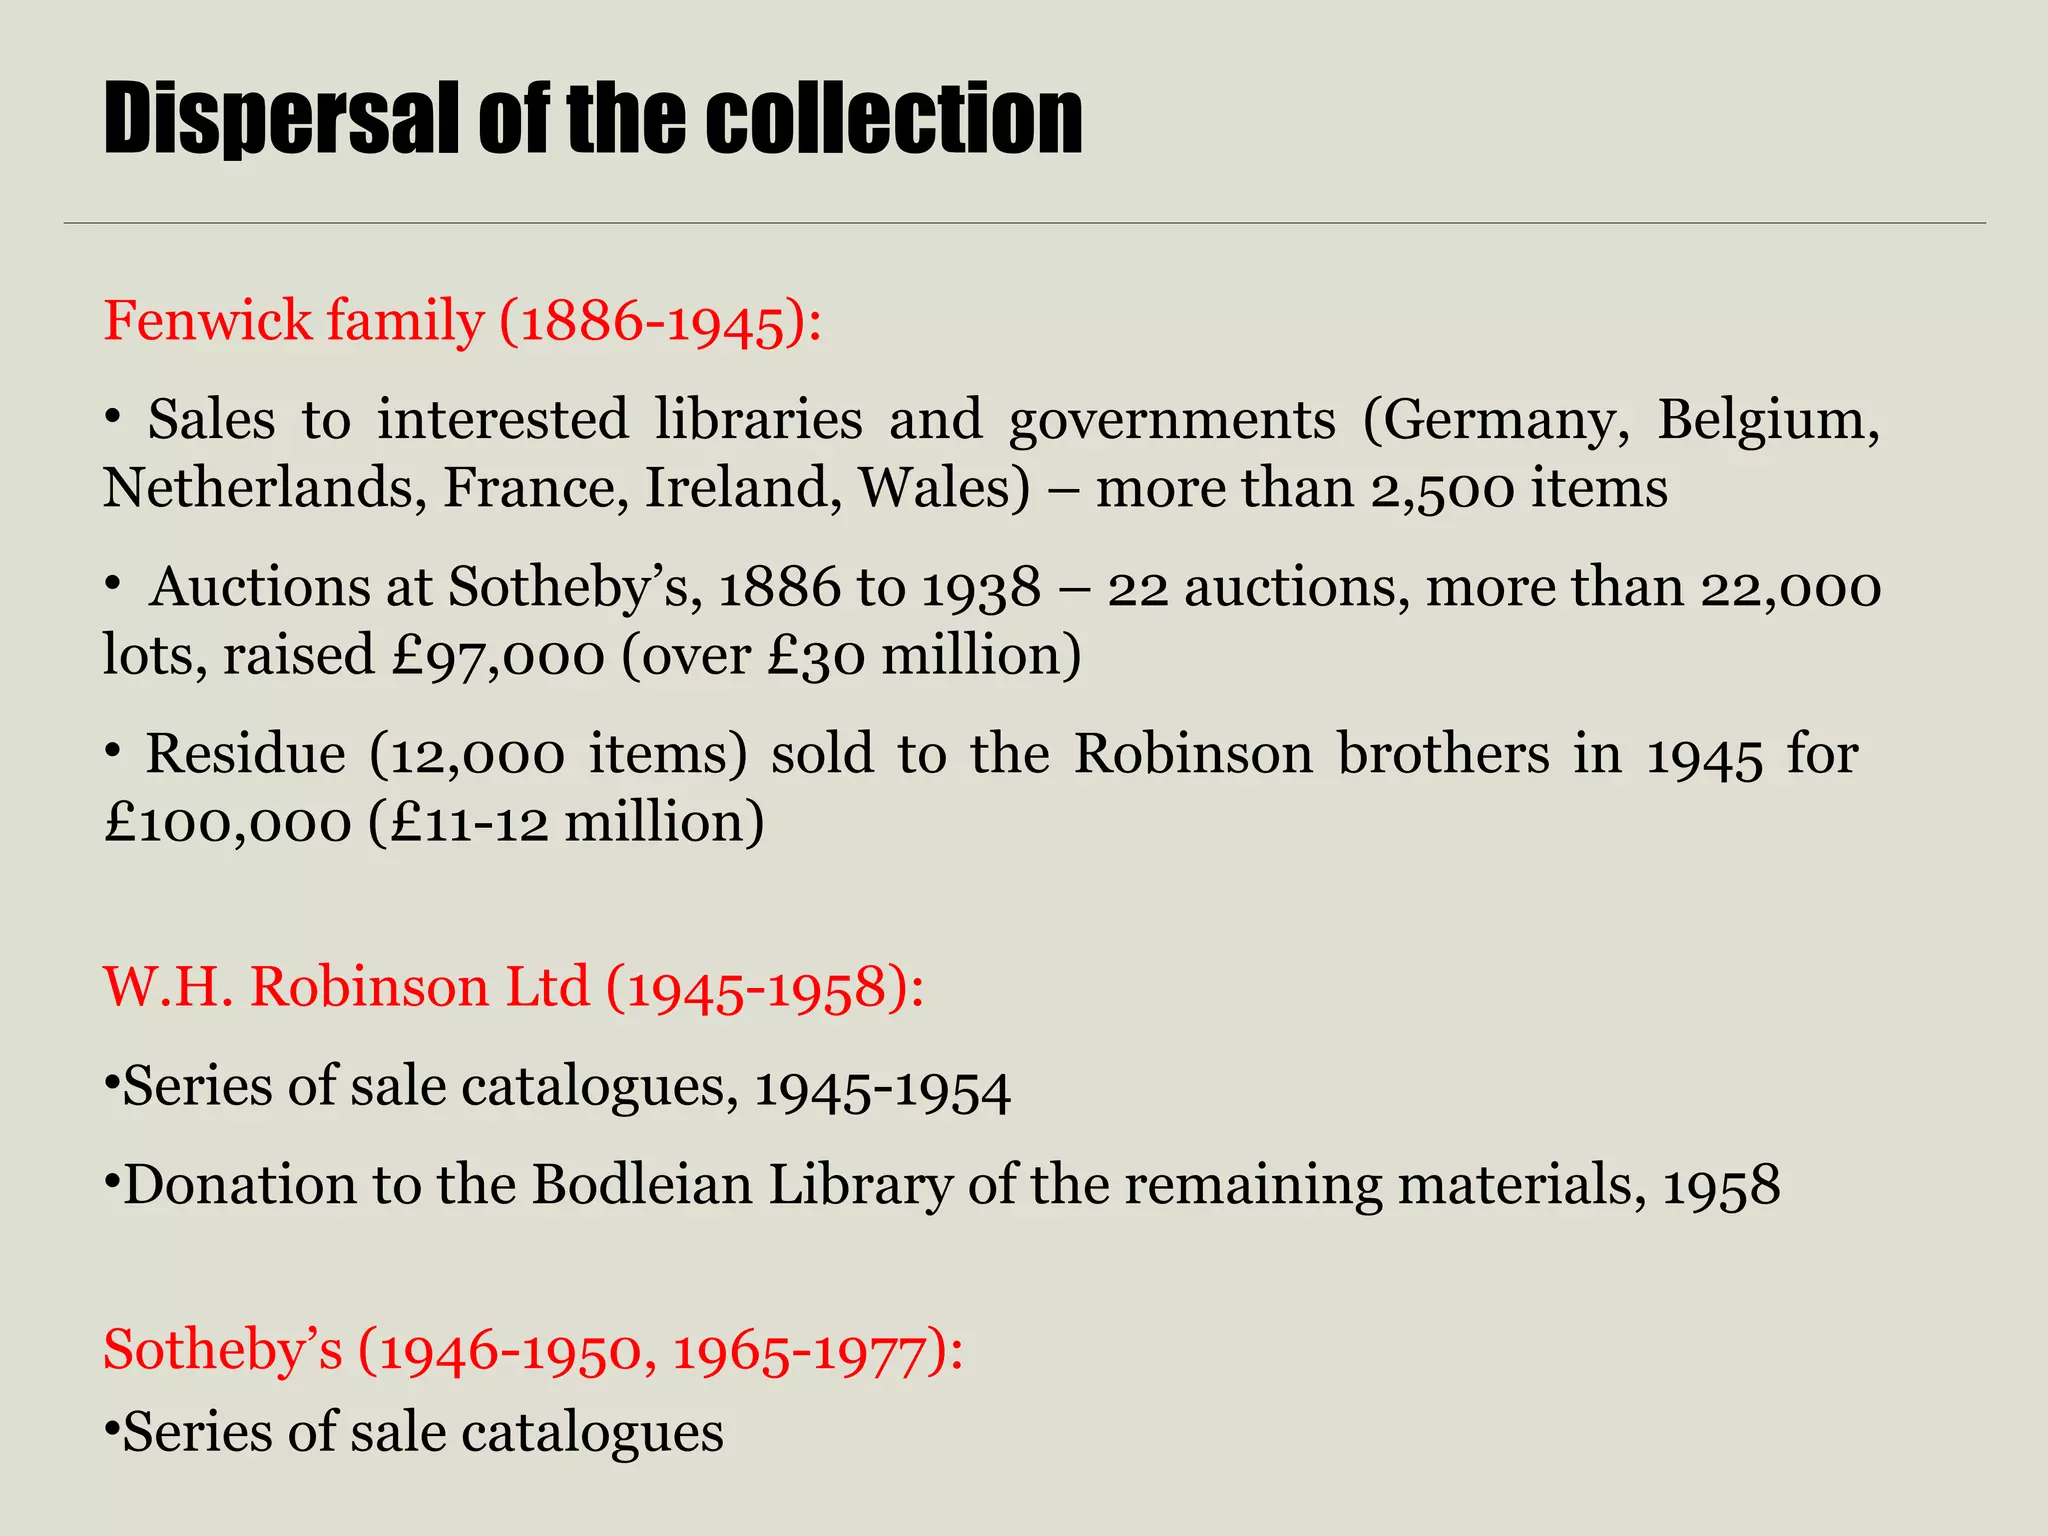

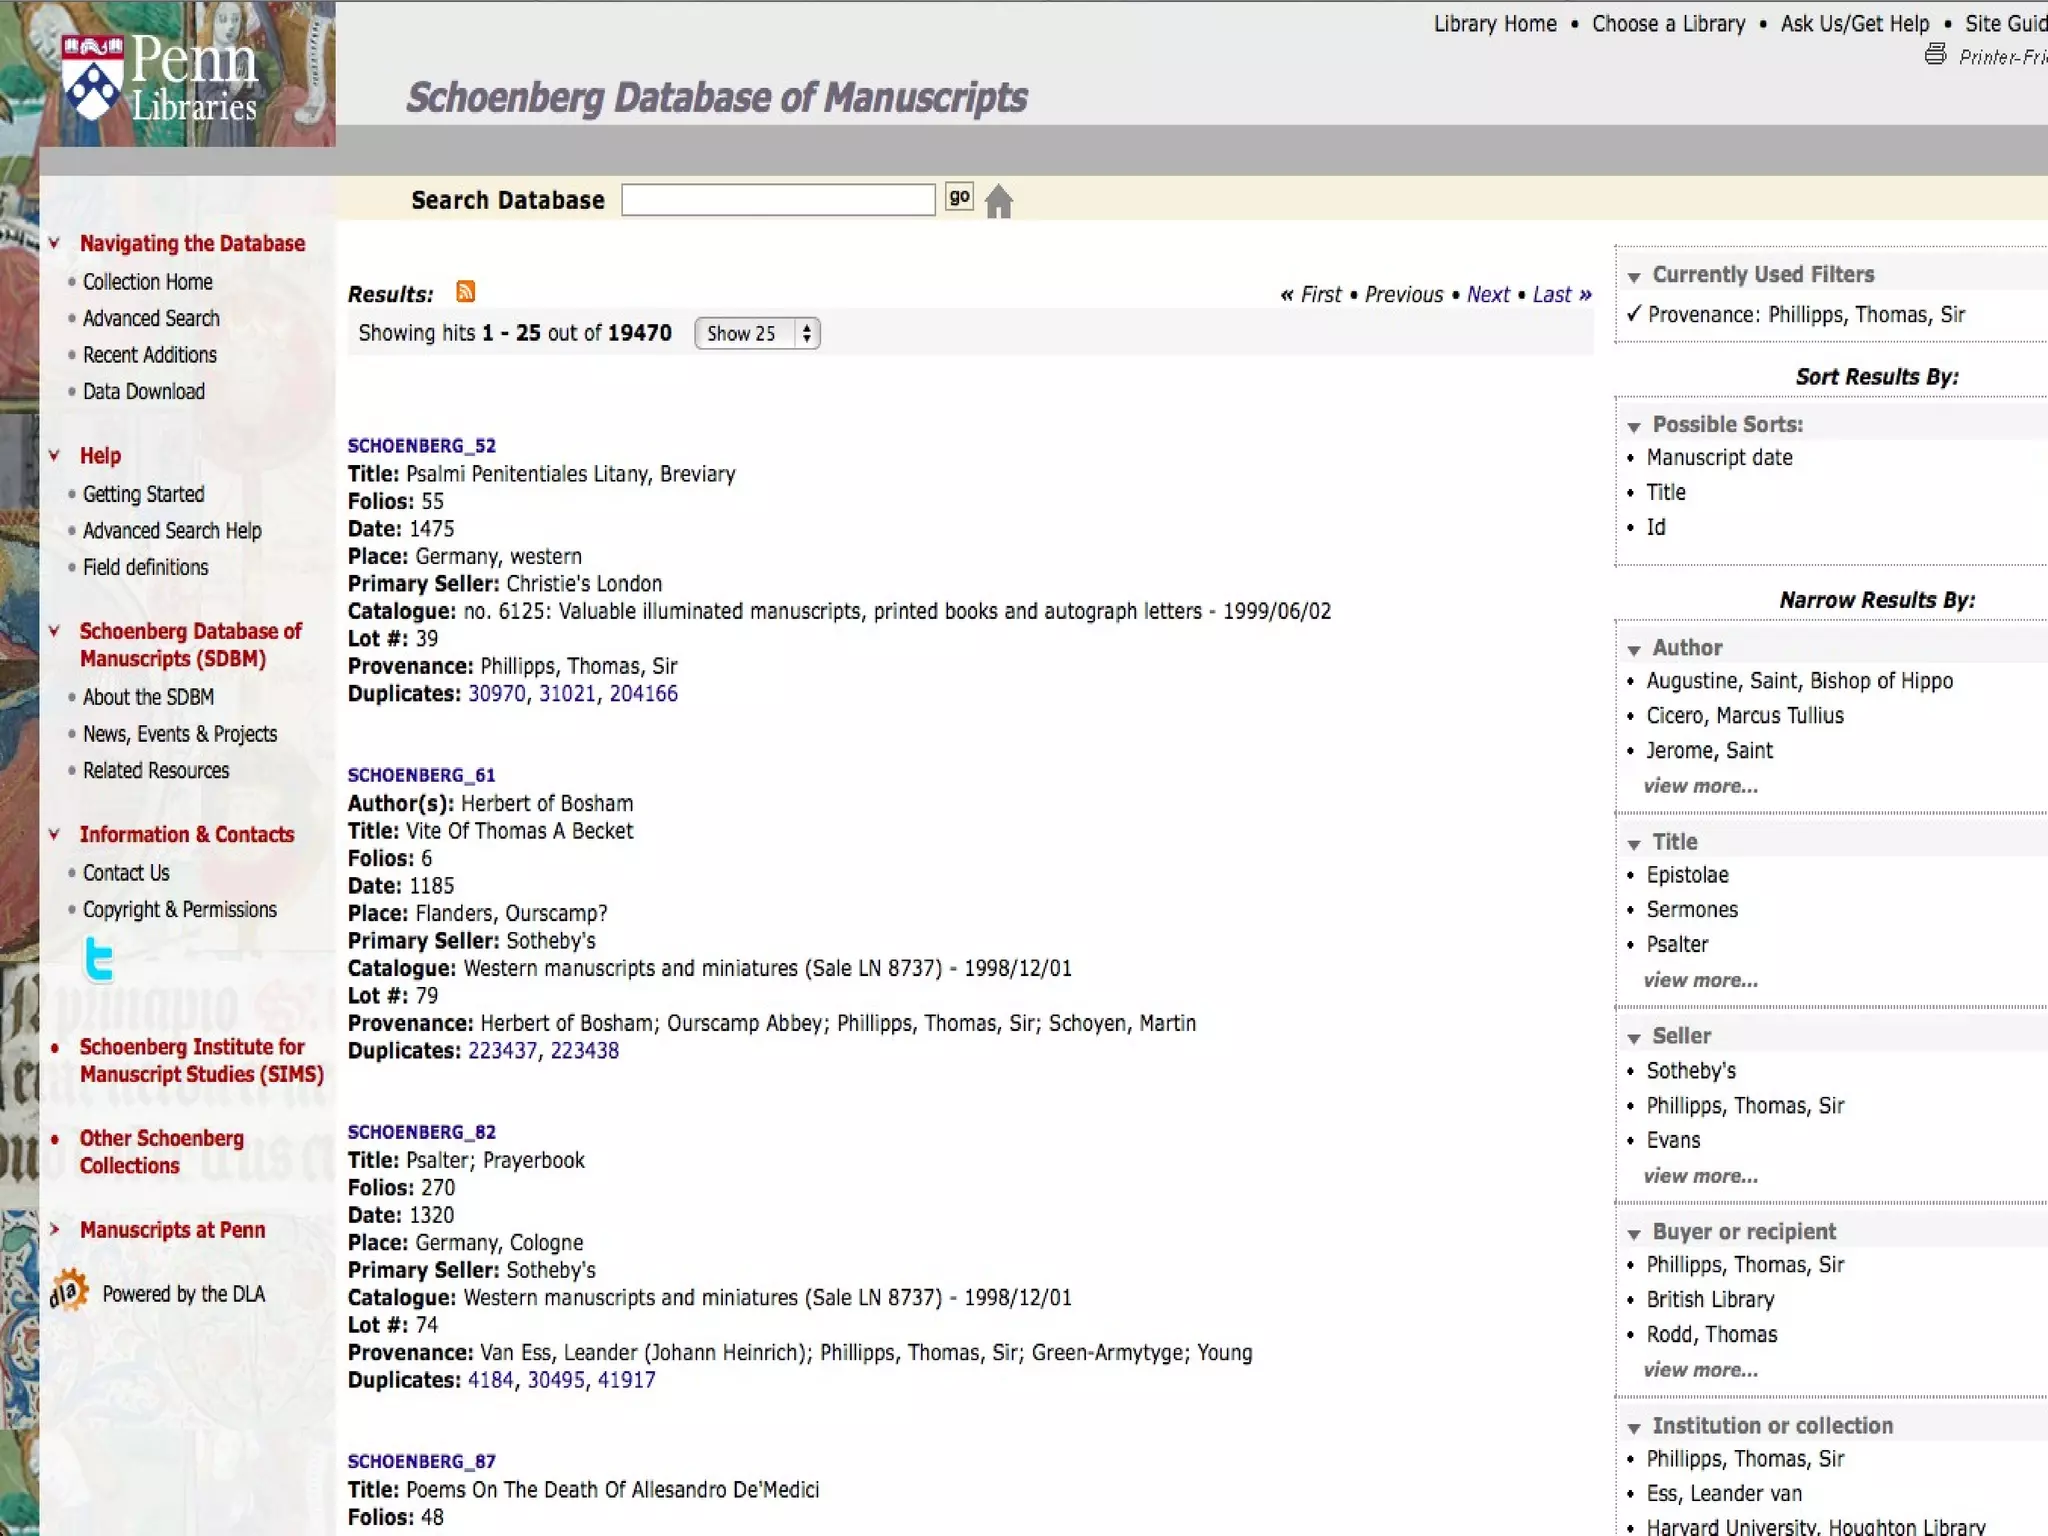
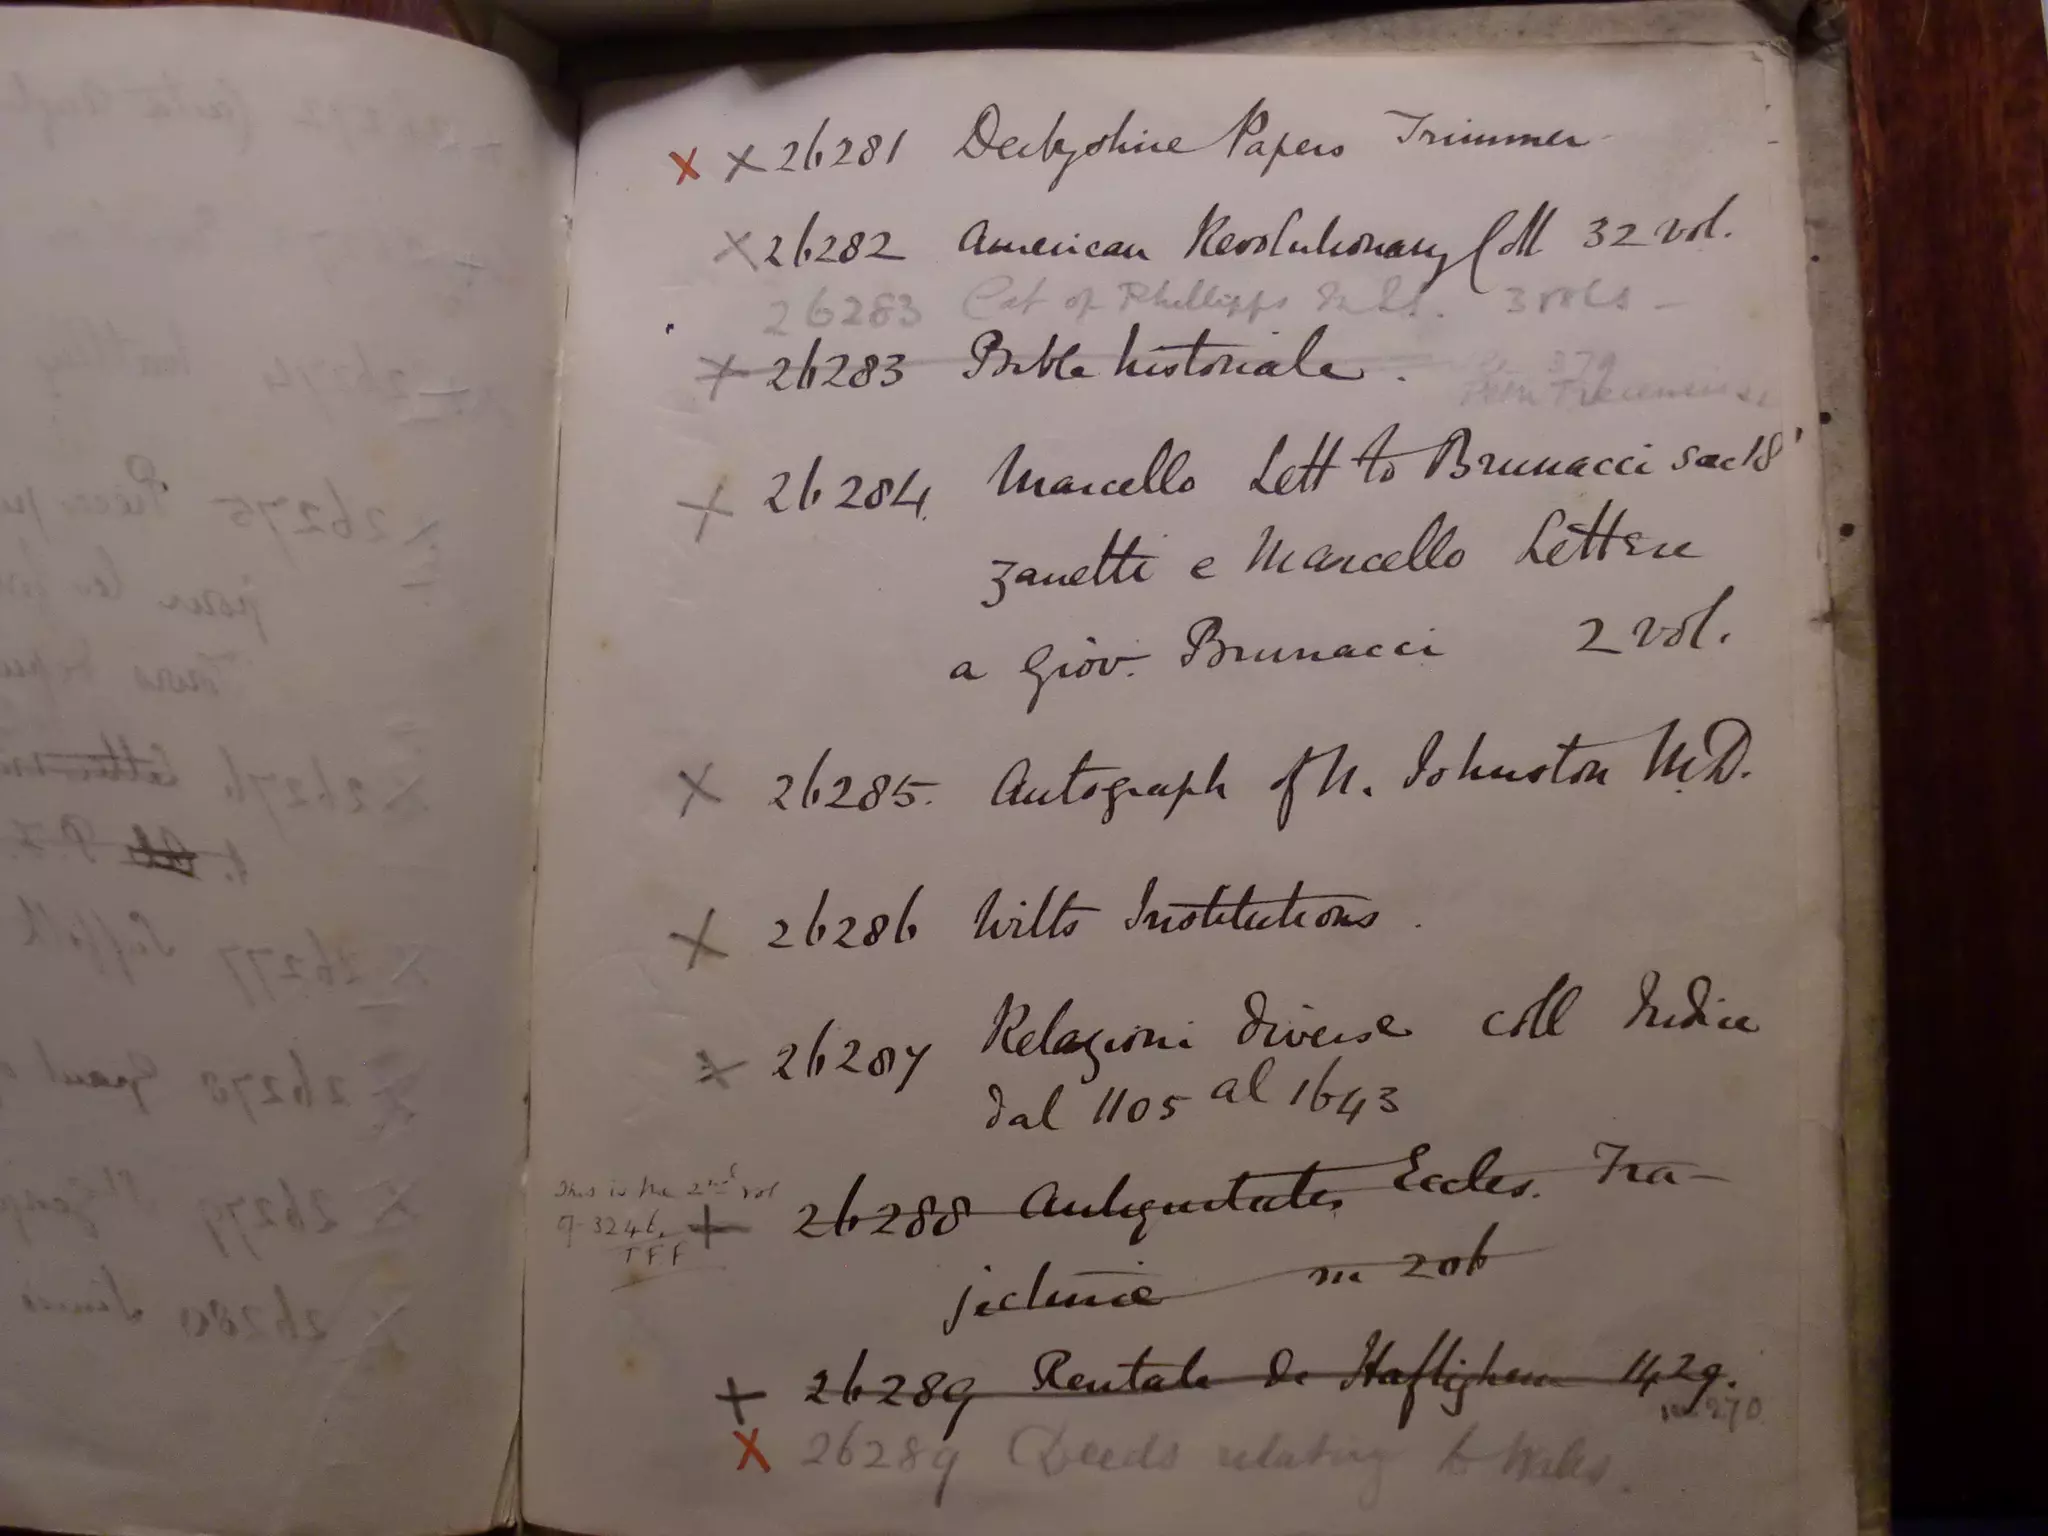
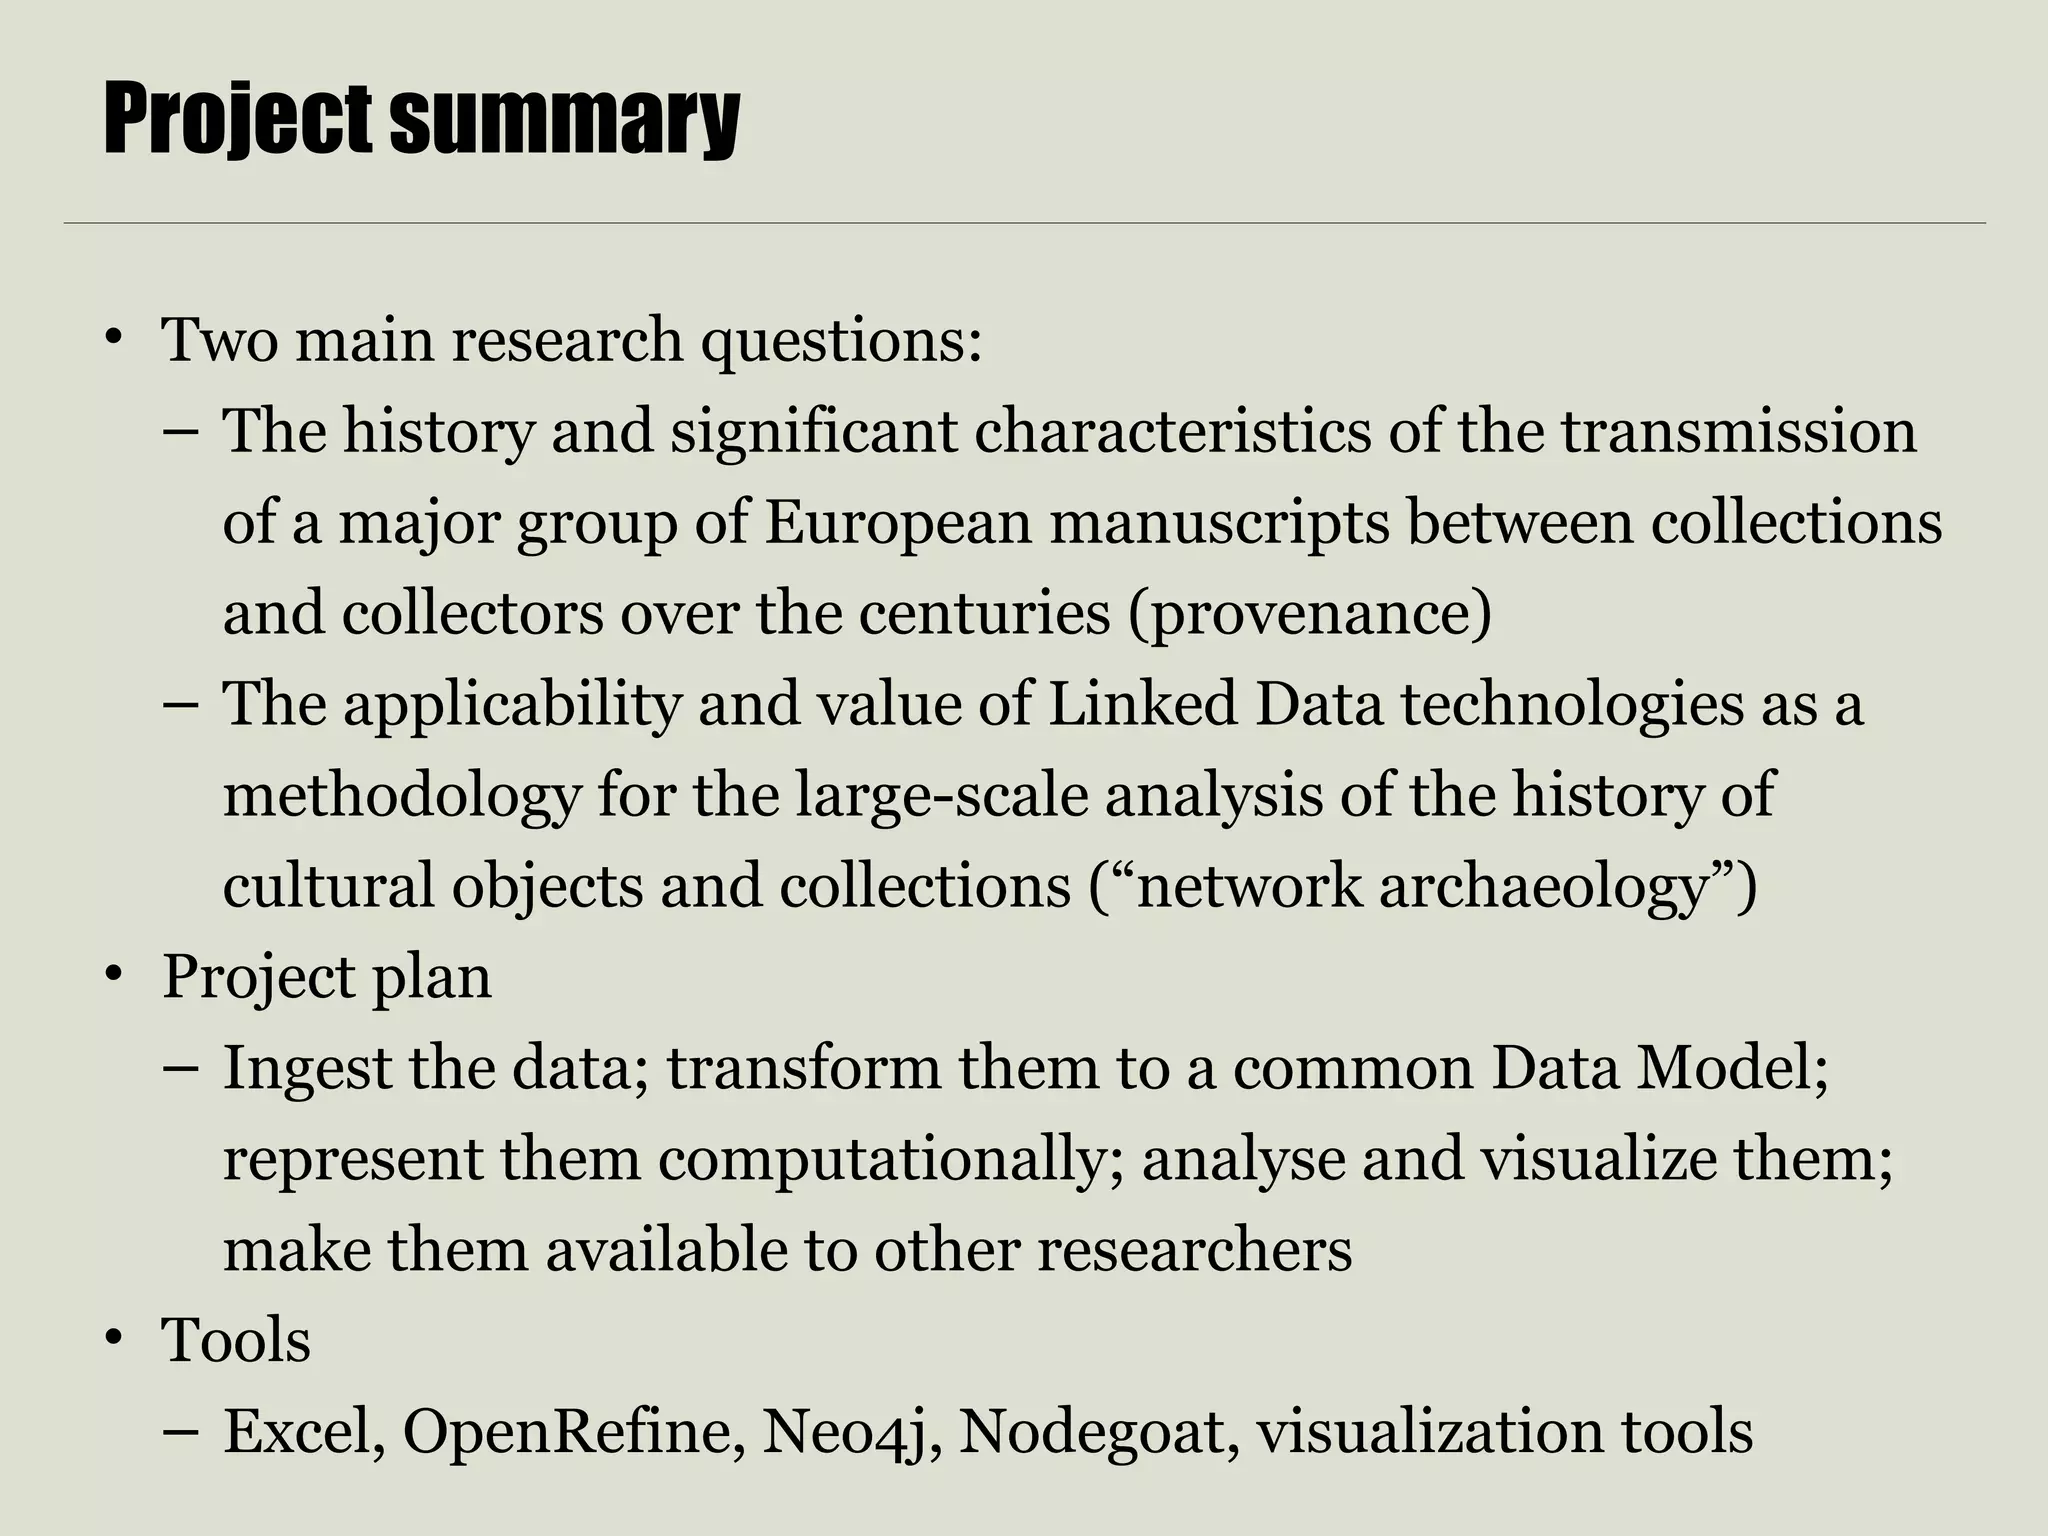
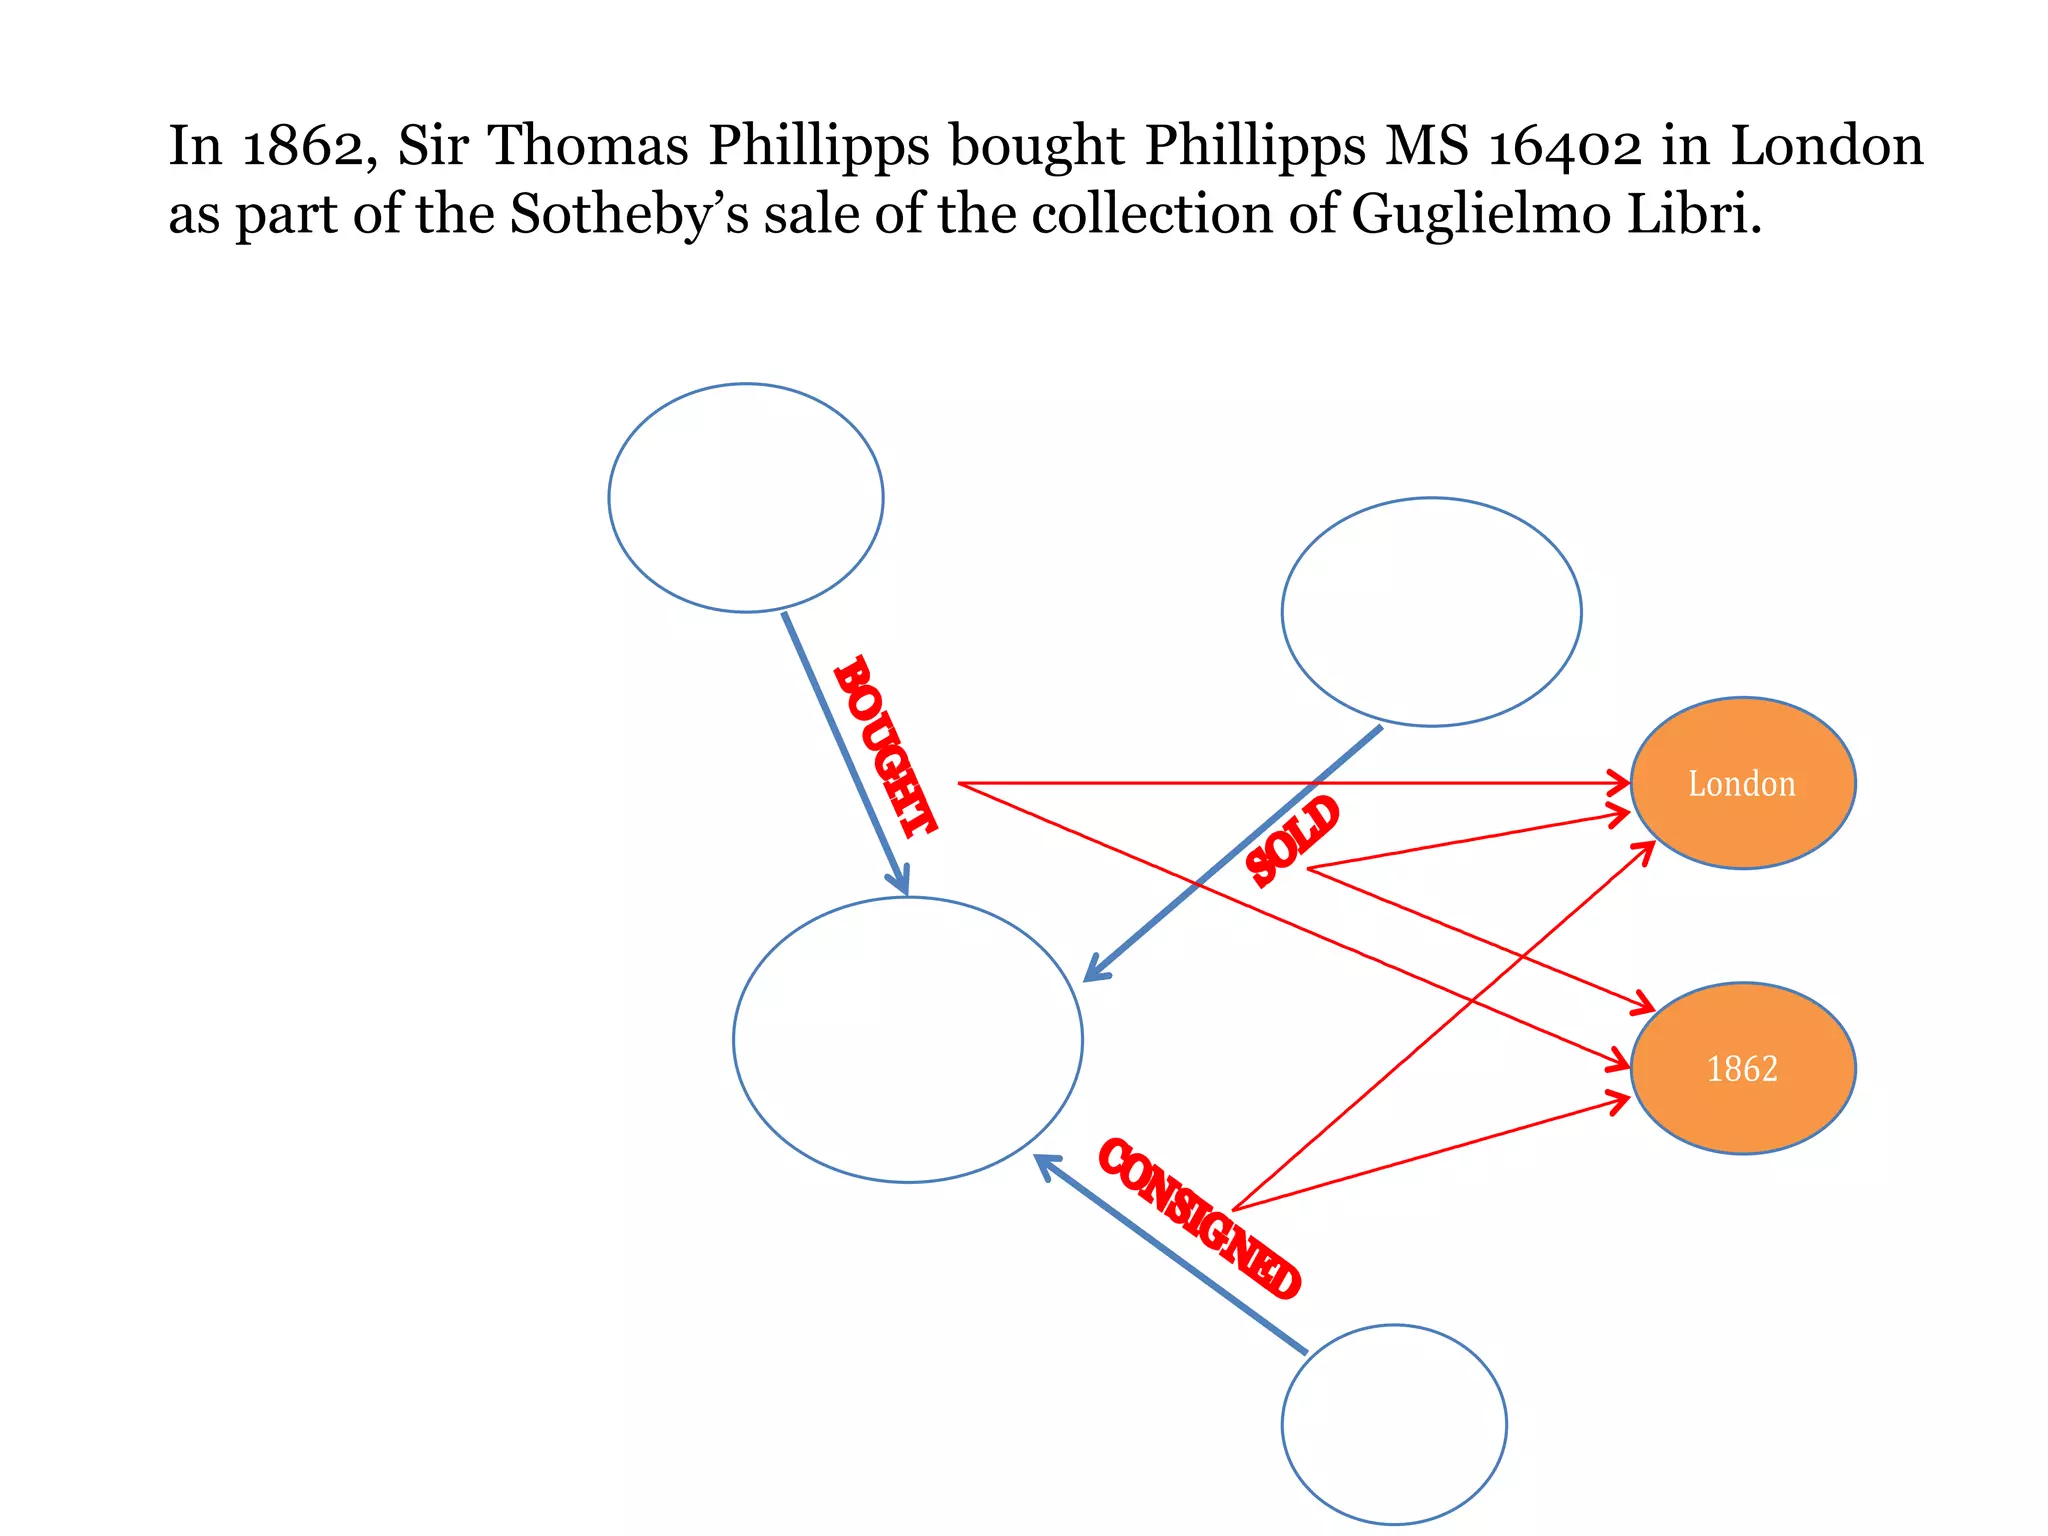


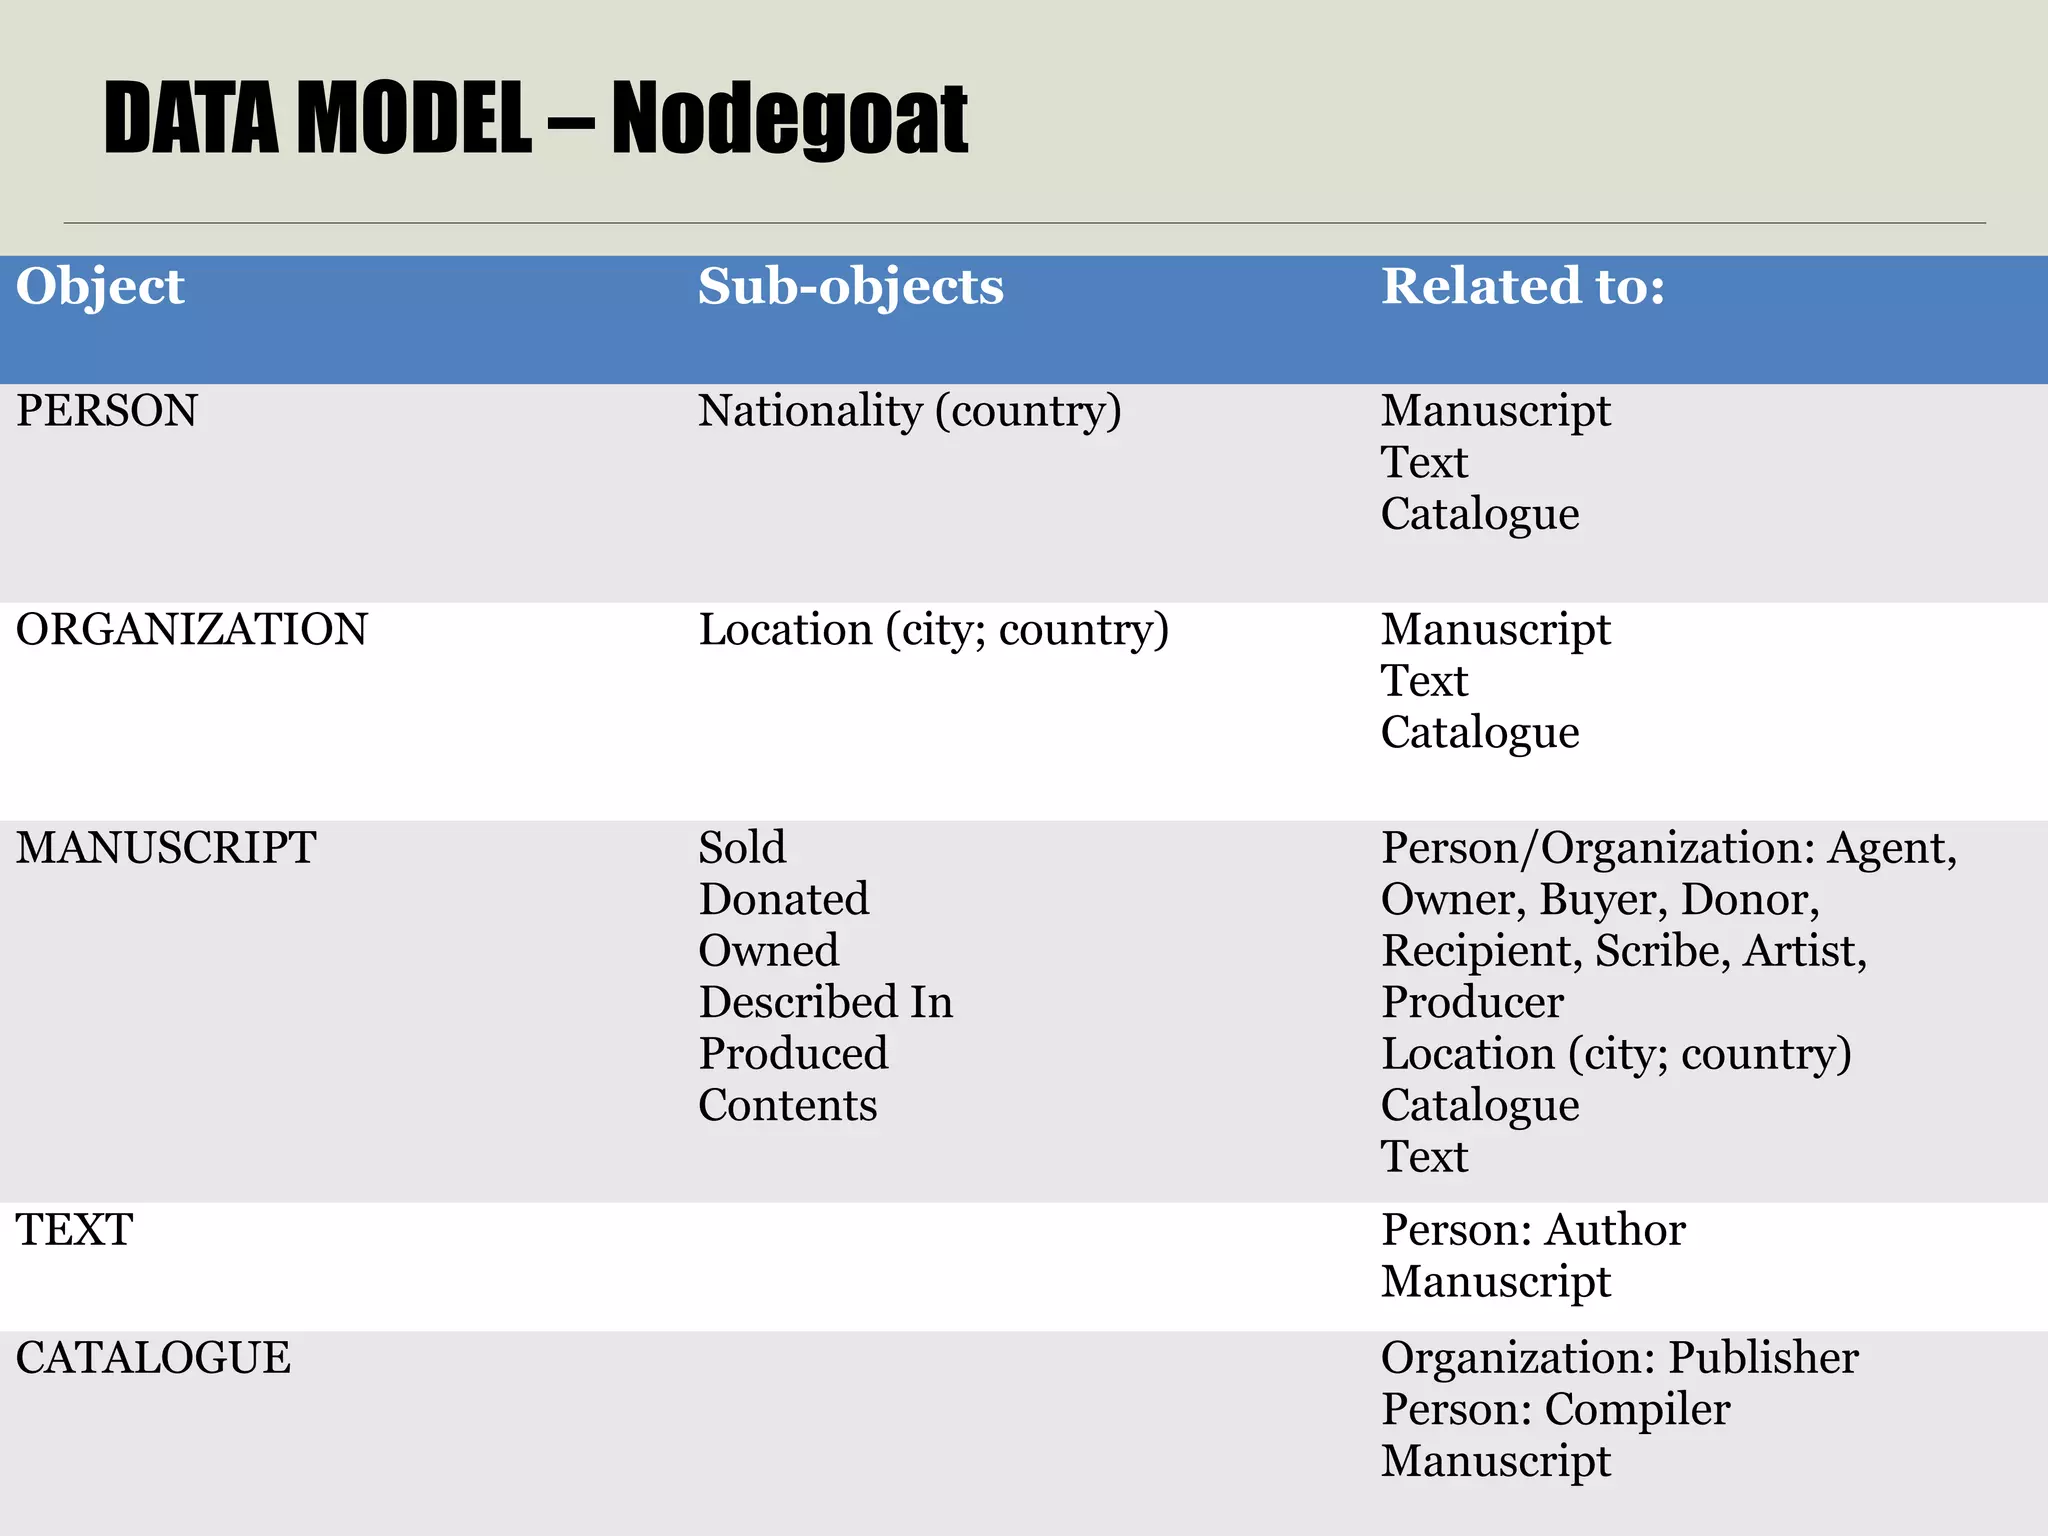


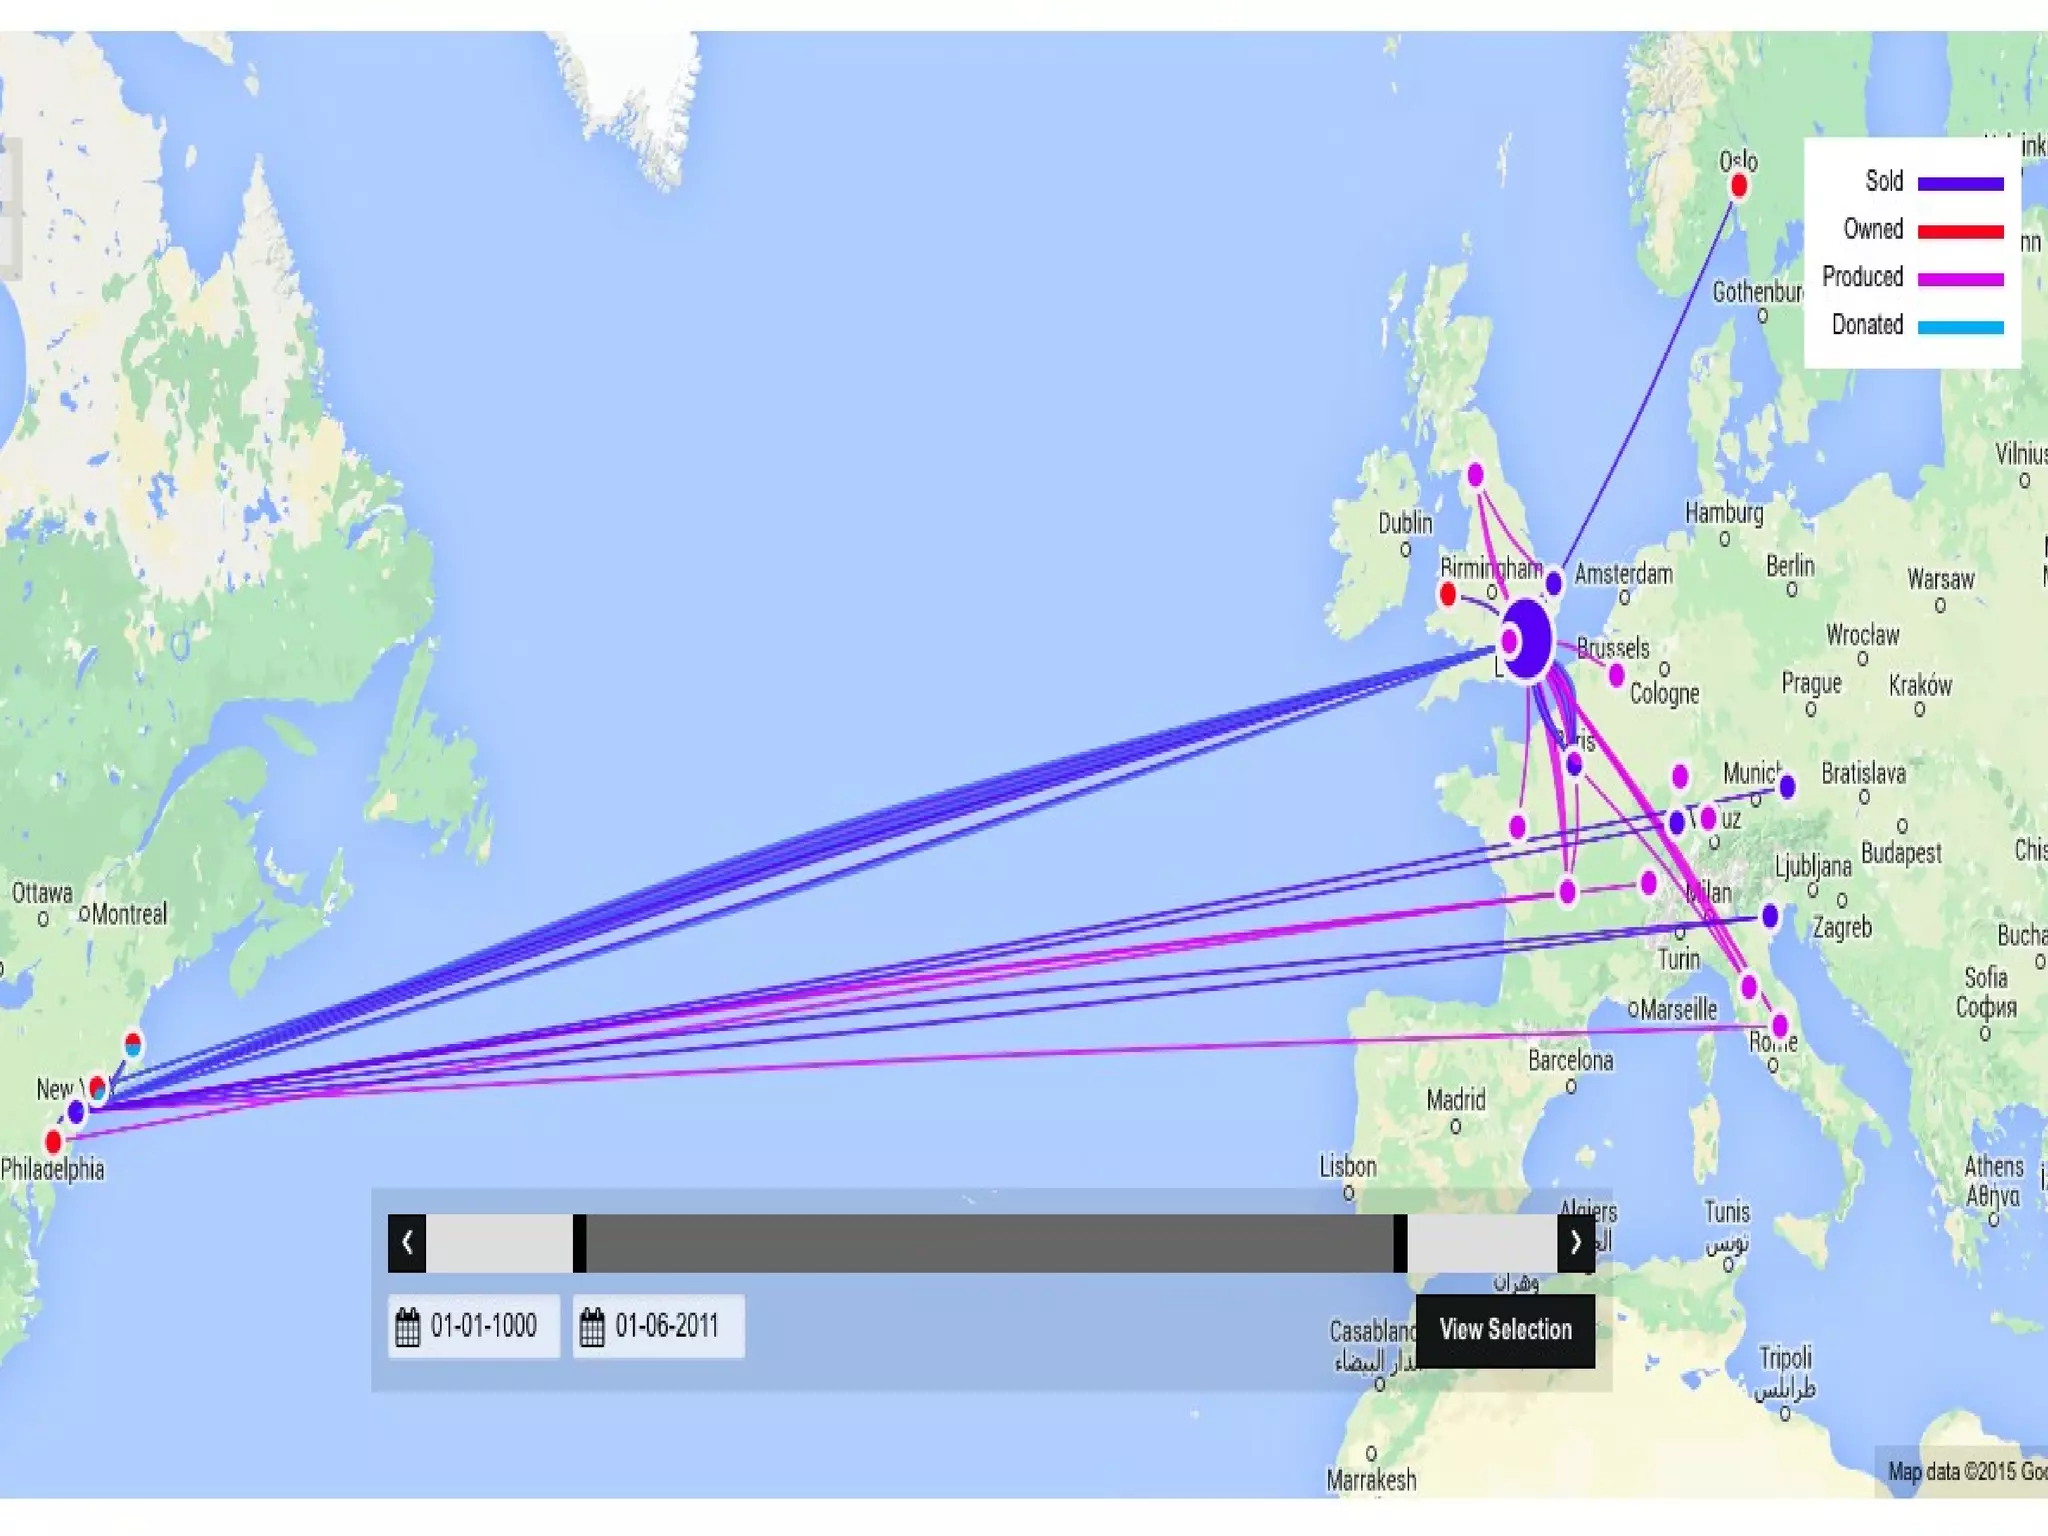

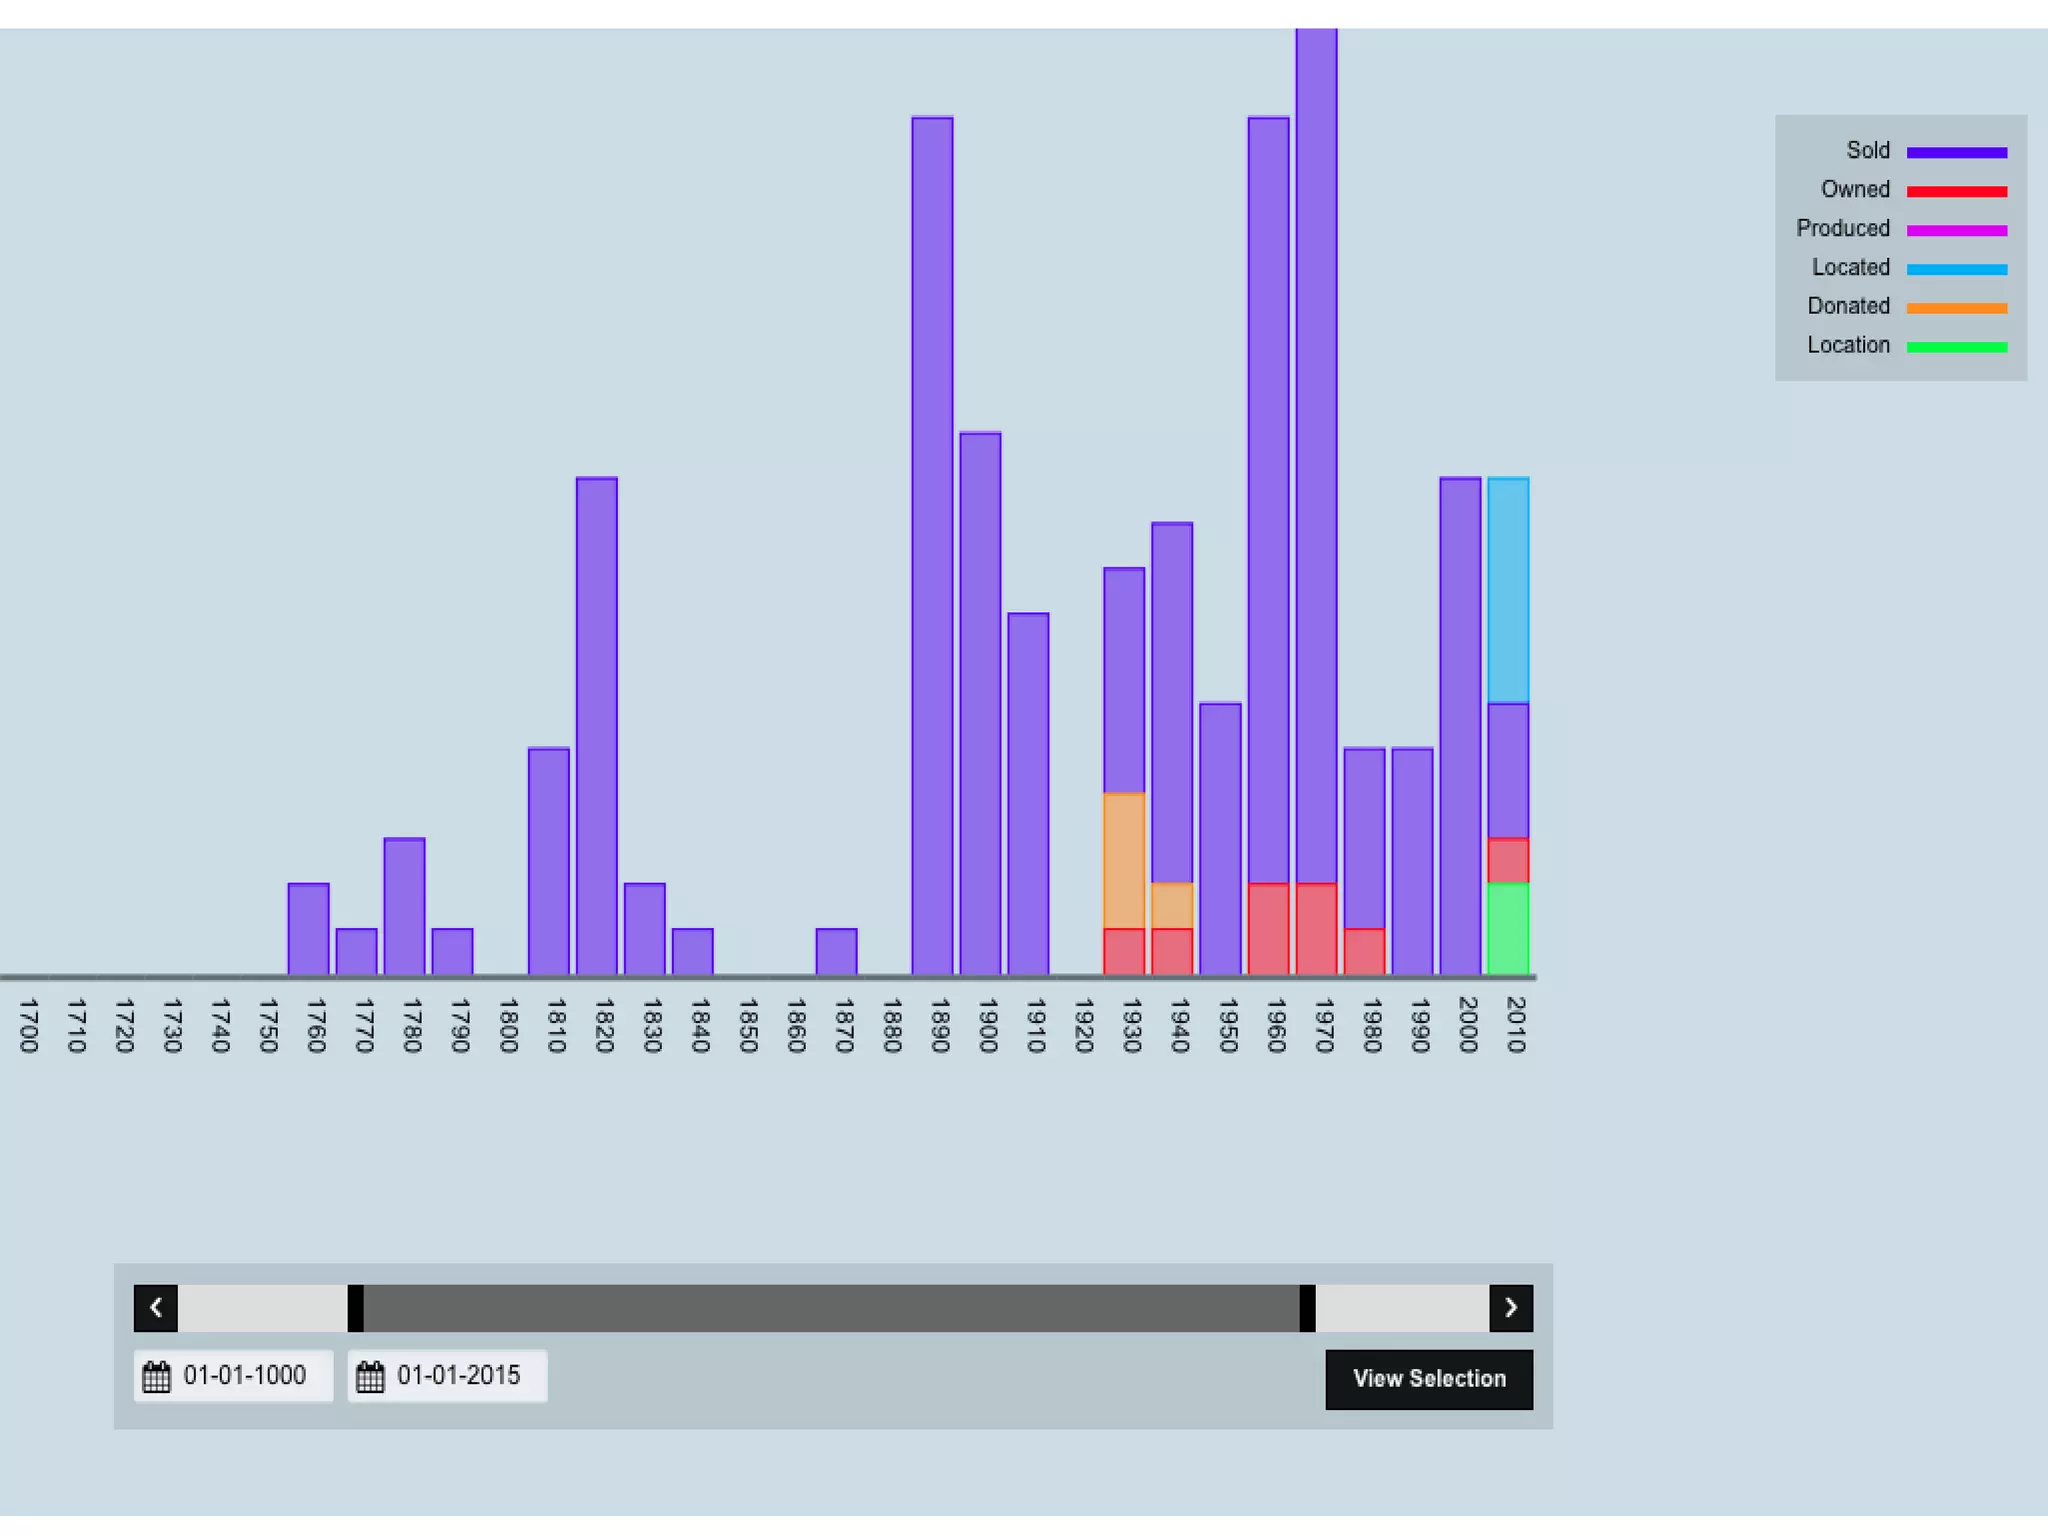

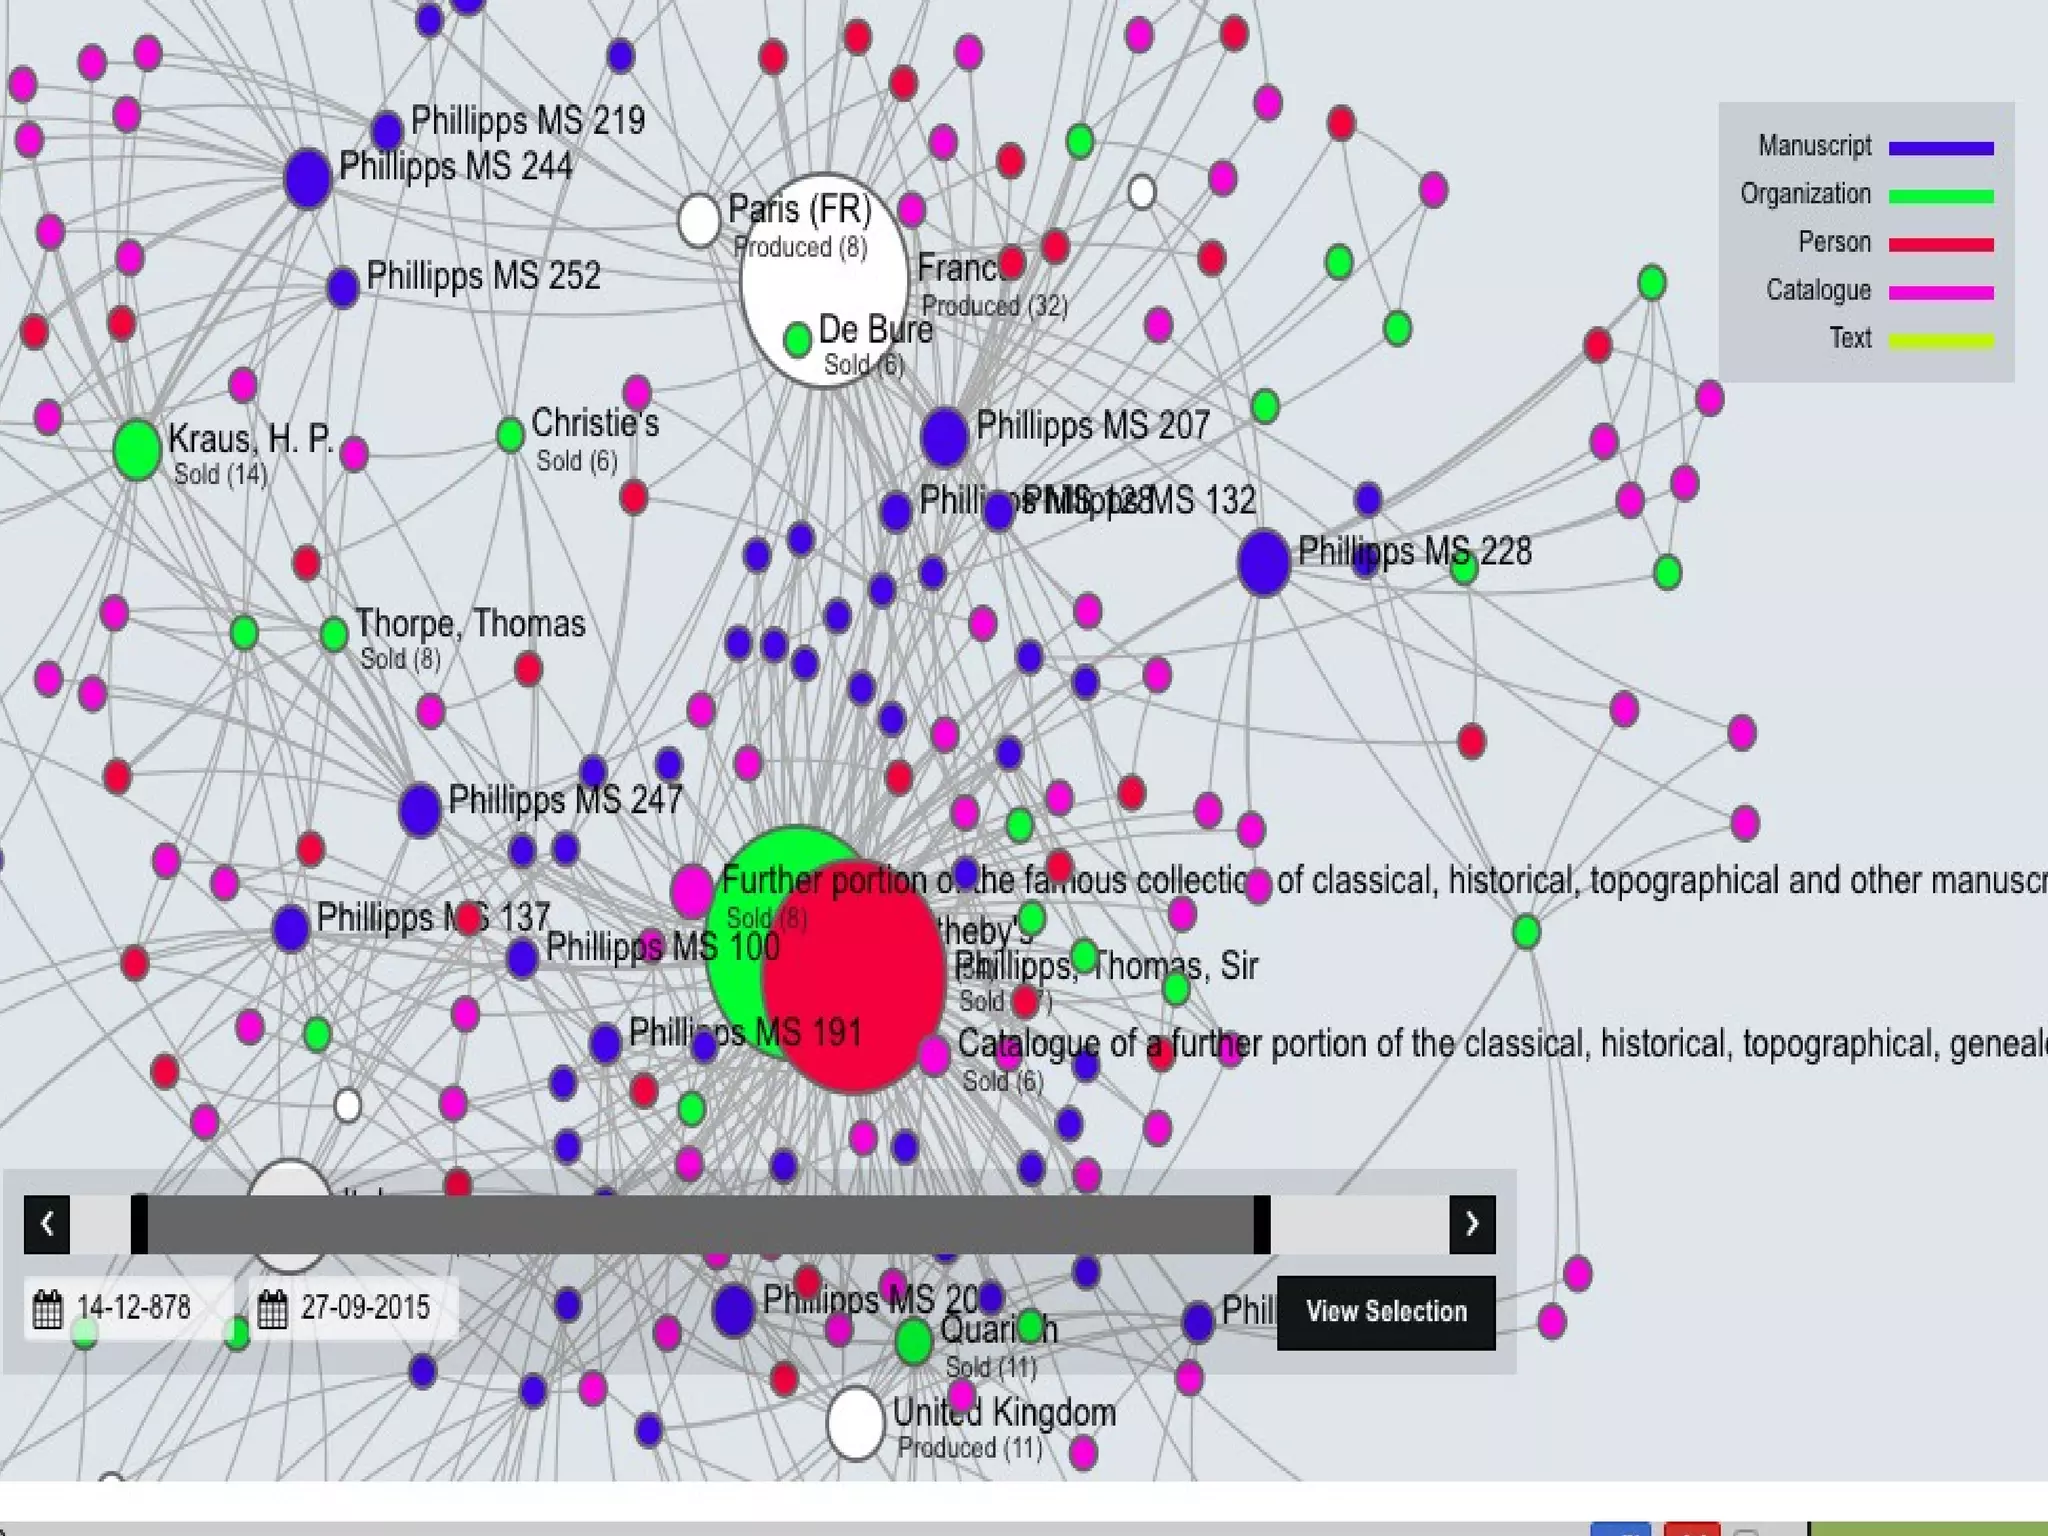


The document summarizes the history and dispersal of the Phillipps manuscript collection. It was assembled by Sir Thomas Phillipps in the 19th century and grew to over 60,000 volumes, making it one of the largest medieval manuscript collections ever amassed by a private collector. After Phillipps' death, the collection was reorganized and portions were sold off over the subsequent decades to libraries and at auction. The document outlines the project to digitally represent the provenance of manuscripts in the collection using linked data approaches and visualize their transmission over time and between collectors.

![[DCSB] Dr Gabriel Bodard (KCL) “A View on Digital Classics Collaboration: fro...](https://cdn.slidesharecdn.com/ss_thumbnails/dcsbbodard2310121-121126064343-phpapp01-thumbnail.jpg?width=640&height=640&fit=bounds)


![[DCSB] Amiz Zeldes (HU, Berlin) "Towards Digital Coptic: Searching and Visual...](https://cdn.slidesharecdn.com/ss_thumbnails/dcsbzeldes2014-01-14-140224011915-phpapp02-thumbnail.jpg?width=640&height=640&fit=bounds)


