DED-2007-growth-summary
- 1. SectionA2
SectionB23
SectionC27
SectionD30
SectionE43
SectionFResidentialDevelopment...........48
SectionGNonresidentialDevelopment.........66
SectionHRezoningActivity..................78
SectionI83
LoudounCountyDepartmentofEconomicDevelopment••1HarrisonStreet,SE•5thFloor•MSC63•Leesburg,VA20175
703-777-0426•1-800-LOUDOUN•FAX703-771-5363•biz.loudoun.gov
WhiletheGrowthSummaryisanannualpublication,theDepartmentofEconomic
Developmentalsoproducesamonthlylookatourlocaleconomy,theEconomicIndicators.
Thecurrentmonth,aswellasanarchiveofpreviousmonths,canbefoundonourwebsite
athttp://biz.loudoun.gov.
Maps...........................
Ifyouhavecomments,suggestions,orquestionsregardingtheinformationcontainedin
theGrowthSummary,pleasecontacttheDepartmentofEconomicDevelopmentat
703-777-0426.
•In2007,severalinternationalairlinesintroducednewservicestomeetpassenger
demandatWashingtonDullesInternationalAirport,contributingtoa13.9percentincrease
•Theamountofnon-residentialsquarefootagethatwaspermittedin2007hita6-year
high,totaling4.3millionsquarefeet.
•Loudounexperienceddramaticjobgrowthoverthepastdecade,increasingby103
percent.Almost2,500newjobswereaddedin2007.
•Thenonresidentialvacancyrateendeditsdownwardtrend,risingslightlyto13.9percent
from12.7percentin2006.
•ThemedianhouseholdincomeinLoudounCountyfor2006was$99,371thesecond
highestinthenation.
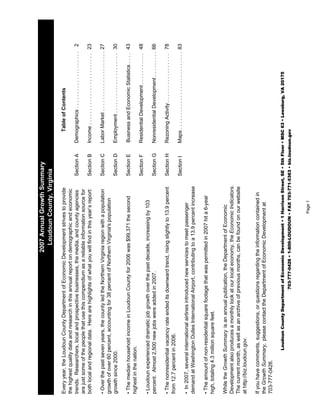
•Overthepastsevenyears,thecountyledtheNorthernVirginiaregionwithapopulation
growthofover60percent,accountingfor38percentofNorthernVirginia'spopulation
growthsince2000.
2007AnnualGrowthSummary
LoudounCounty,Virginia
Income..........................
Demographics....................
LaborMarket.....................
Employment.....................
BusinessandEconomicStatistics....
TableofContentsEveryyear,theLoudounCountyDepartmentofEconomicDevelopmentstrivestoprovide
thehighestqualitydataandresearchinthisannualreportondemographicandeconomic
trends.Researchers,localandprospectivebusinesses,themedia,andcountyagencies
arejustsomeofthepeoplethatusethiscompendiumasareliableinformationsourcefor
bothlocalandregionaldata.Herearehighlightsofwhatyouwillfindinthisyear’sreport:
Page1
- 3. TableA-1a
DecennialPopulationTrends,1930-2030
LoudounCounty,Virginia
Year1930(a)
1940(a)
1950(a)
1960(a)
1970(a)
1980(a)
1990(a)
2000(a)
2010(b)
2020(b)
2030(b)
Population19,85220,29121,14724,54937,15057,42786,129169,599291,734384,377449,926
PercentChange-3.5%2.2%4.2%16.1%51.3%54.6%50.0%96.9%72.0%31.8%17.1%
TableA-1b
AnnualPopulationTrends,2000-2035
LoudounCounty,Virginia
ActualEstimateEstimateEstimateEstimateEstimateEstimateEstimateForecastForecastForecastForecastForecast
Year2000(a)
2001(b)
2002(b)
2003(b)
2004(b)
2005(b)
2006(b)
2007(b)
2008(b)
2009(b)
2010(b)
2011(b)
2012(b)
Population169,599185,120196,314211,146229,429247,342262,609271,069279,082285,674291,734298,326305,560
PercentChange--9.2%6.0%7.6%8.7%7.8%6.2%3.2%3.0%2.4%2.1%2.3%2.4%
ForecastForecastForecastForecastForecastForecastForecastForecastForecastForecastForecastForecastForecast
Year2013(b)
2014(b)
2015(b)
2016(b)
2017(b)
2018(b)
2019(b)
2020(b)
2021(b)
2022(b)
2023(b)
2024(b)
2025(b)
Population313,356321,470330,184339,847350,478361,288373,089384,377395,102404,601413,733421,587428,331
PercentChange2.6%2.6%2.7%2.9%3.1%3.1%3.3%3.0%2.8%2.4%2.3%1.9%1.6%
ForecastForecastForecastForecastForecastForecastForecastForecastForecastForecast
Year2026(b)
2027(b)
2028(b)
2029(b)
2030(b)
2031(b)
2032(b)
2033(b)
2034(b)
2035(b)
Population434,145439,136443,140446,533449,926453,441456,884460,052463,080465,695
PercentChange1.4%1.1%0.9%0.8%0.8%0.8%0.8%0.7%0.7%0.6%
Note:DataisupdatedinbetweenAnnualGrowthSummarypublications.PleaseseetheLoudounCountydemographicswebpageforthemostup-to-datedata.
PopulationTrends--LoudounCounty
Sources:(a)U.S.CensusBureau,DecennialCensus1930to2000;(b)LoudounCountyGovernment,2007FiscalImpactCommitteeGuidelines,Table4.
ConstructionoftheinfrastructuretosupportWashingtonDullesInternationalAirportinitiatedLoudoun'srapidgrowthover40yearsago.Between2006and
2007thecounty'spopulationincreasedby3.2percent,or8,460people.Thepopulationisexpectedtocontinuegrowing,increasingby29percentinthenext10
years,2007to2017.
Page3
- 4. ActualEstimateEstimateEstimateEstimateEstimateEstimateEstimateForecastForecastForecastForecastForecast
Year2000(a)
2001(b)
2002(b)
2003(b)
2004(b)
2005(b)
2006(b)
2007(b)
2008(b)
2009(b)
2010(b)
2011(b)
2012(b)
Households59,90065,35769,40074,70381,25887,47992,79695,66698,413100,633102,692105,026107,598
PercentChange--9.1%6.2%7.6%8.8%7.7%6.1%3.1%2.9%2.3%2.0%2.3%2.4%
ForecastForecastForecastForecastForecastForecastForecastForecastForecastForecastForecastForecastForecast
Year2013(b)
2014(b)
2015(b)
2016(b)
2017(b)
2018(b)
2019(b)
2020(b)
2021(b)
2022(b)
2023(b)
2024(b)
2025(b)
Households110,421113,363116,506120,033123,940127,905132,163136,209140,036143,388146,573149,273151,588
PercentChange2.6%2.7%2.8%3.0%3.3%3.2%3.3%3.1%2.8%2.4%2.2%1.8%1.6%
ForecastForecastForecastForecastForecastForecastForecastForecastForecastForecast
Year2026(b)
2027(b)
2028(b)
2029(b)
2030(b)
2031(b)
2032(b)
2033(b)
2034(b)
2035(b)
Households153,573155,293156,688157,892159,097160,339161,547162,668163,743164,670
PercentChange1.3%1.1%0.9%0.8%0.8%0.8%0.8%0.7%0.7%0.6%
Note:DataisupdatedinbetweenAnnualGrowthSummarypublications.PleaseseetheLoudounCountydemographicswebpageforthemostup-to-datedata.
HouseholdTrends--LoudounCounty
Ahouseholdisasingle,occupiedhousingunitthatmaybeinhabitedbyasingleperson,oneormorefamilies,oroneormoreunrelatedindividuals.The
numberofhouseholdsisforecastedtoincreaseby30percentoverthenextdecade,2007to2017.
Sources:(a)U.S.CensusBureau,DecennialCensus1930to2000;(b)LoudounCountyGovernment,2007FiscalImpactCommitteeGuidelines,Table4.
TableA-2
HouseholdTrends,2000-2035
LoudounCounty,Virginia
Page4
- 5. ActualEstimateEstimateEstimateEstimateEstimateEstimateEstimateForecastForecastForecastForecastForecast
Year2000(a)
2001(b)
2002(b)
2003(b)
2004(b)
2005(b)
2006(b)
2007(b)
2008(b)
2009(b)
2010(b)
2011(b)
2012(b)
HousingUnits62,16068,52373,00578,79485,85192,44398,246101,359104,337106,702108,884111,379114,133
PercentChange--10.2%6.5%7.9%9.0%7.7%6.3%3.2%2.9%2.3%2.0%2.3%2.5%
ForecastForecastForecastForecastForecastForecastForecastForecastForecastForecastForecastForecastForecast
Year2013(b)
2014(b)
2015(b)
2016(b)
2017(b)
2018(b)
2019(b)
2020(b)
2021(b)
2022(b)
2023(b)
2024(b)
2025(b)
HousingUnits117,169120,334123,714127,514131,729136,005140,584144,932149,044152,646156,064158,955161,434
PercentChange2.7%2.7%2.8%3.1%3.3%3.2%3.4%3.1%2.8%2.4%2.2%1.9%1.6%
ForecastForecastForecastForecastForecastForecastForecastForecastForecastForecast
Year2026(b)
2027(b)
2028(b)
2029(b)
2030(b)
2031(b)
2032(b)
2033(b)
2034(b)
2035(b)
HousingUnits163,559165,404166,904168,204169,504170,844172,144173,354174,514175,514
PercentChange1.3%1.1%0.9%0.8%0.8%0.8%0.8%0.7%0.7%0.6%
(1)Housingunittotalsmaynotequalsumtheofsingle-familydetached,single-familyattached,andmulti-familyduetorounding.
(2)DataisupdatedinbetweenAnnualGrowthSummarypublications.PleaseseetheLoudounCountydemographicswebpageforthemostup-to-datedata.
HousingUnitTrends--LoudounCounty
Sources:(a)U.S.CensusBureau,DecennialCensus1930to2000;(b)LoudounCountyGovernment,2007FiscalImpactCommitteeGuidelines,Table4.
Notes:
Ahousingunitisahabitableunitthatiseithervacantoroccupiedbyasingleperson,oneormorefamilies,oroneormoreunrelatedindividuals.In2007,
LoudounCounty'shousingunitcountsurpassedthe100,000mark.Therewereanestimated101,359housingunits,anincreaseof63%since2000.
TableA-3a
HousingUnitTrends,2000-2035
LoudounCounty,Virginia
Page5
- 6. TableA-3b
HousingUnitTrendsbyPlanningSubarea,2000-2035
LoudounCounty,Virginia
Census
ActualEstimateEstimateEstimateForecastForecastForecastForecastForecastForecastForecastForecast
200020052006200720082009201020152020202520302035
Ashburn12,00724,87526,94928,17729,22829,90830,57834,81140,38943,05345,05346,873
Dulles3,0068,63010,20411,17812,28413,32814,34720,29227,26532,22433,57433,959
Leesburg11,94017,55818,15918,42818,65018,81918,95920,69123,99827,96329,88231,062
Northwest2,4323,0443,2503,3963,5023,6023,6784,2935,4466,5467,3909,045
Potomac13,72415,20415,38615,43615,53415,59115,64015,68115,69115,80115,90115,901
Route15North9641,2381,3901,4871,5961,6681,7232,1532,9943,8424,4024,555
Route15South9381,0631,1171,1831,2621,3121,3621,7292,2222,6372,9522,974
Route7West4,4686,5657,0297,2627,4377,5577,6578,56710,25012,05212,68912,734
Southwest2,6983,0013,0743,1093,1383,2083,2283,3383,7434,0764,4165,166
Sterling9,98311,26511,68811,70311,70611,70911,71212,15912,93413,24013,24513,245
Total62,16092,44398,246101,359104,337106,702108,884123,714144,932161,434169,504175,514
Notes:
(1)DataisupdatedinbetweenAnnualGrowthSummarypublications.PleaseseetheLoudounCountydemographicswebpageforthemostup-to-datedata.
(2)Totalsmaynotequalthesumoftheplanningsubareasduetorounding.
HousingUnitTrendsbyPlanningSubarea,2000-2035
Between2006and2007housingunitsincreasedthefastestintheDullesplanningsubarea,growingby9.5percent.Thelargestamountofgrowthbetween2006
and2007occurredintheAshburnplanningsubarea,growingby1,228.Thegreatesthousingunitgrowthisexpectedtocontinueinthesetwosubareasinthe
near-term.
Source:LoudounCountyGovernment,2007FiscalImpactCommitteeGuidelines,Table5.
Planning
Subarea
Annual,2005-2010FiveYearForecasts,2015-2035
Page6
- 7. TableA-4a
Single-FamilyDetachedHousingUnitTrends,2000-2035
LoudounCounty,Virginia
ActualEstimateEstimateEstimateEstimateEstimateEstimateEstimateForecastForecastForecastForecastForecast
Year2000(a)
2001(b)
2002(b)
2003(b)
2004(b)
2005(b)
2006(b)
2007(b)
2008(b)
2009(b)
2010(b)
2011(b)
2012(b)
HousingUnits35,92938,60940,43643,31046,62650,12453,27555,16156,73658,09459,28860,42761,686
PercentChange--7.5%4.7%7.1%7.7%7.5%6.3%3.5%2.9%2.4%2.1%1.9%2.1%
ForecastForecastForecastForecastForecastForecastForecastForecastForecastForecastForecastForecastForecast
Year2013(b)
2014(b)
2015(b)
2016(b)
2017(b)
2018(b)
2019(b)
2020(b)
2021(b)
2022(b)
2023(b)
2024(b)
2025(b)
HousingUnits63,00164,39165,93667,56269,30571,07173,15175,27277,40479,53181,71183,70185,441
PercentChange2.1%2.2%2.4%2.5%2.6%2.5%2.9%2.9%2.8%2.7%2.7%2.4%2.1%
ForecastForecastForecastForecastForecastForecastForecastForecastForecastForecast
Year2026(b)
2027(b)
2028(b)
2029(b)
2030(b)
2031(b)
2032(b)
2033(b)
2034(b)
2035(b)
HousingUnits87,01188,33189,37190,21191,05191,93192,81193,60194,35195,001
PercentChange1.8%1.5%1.2%0.9%0.9%1.0%1.0%0.9%0.8%0.7%
Single-FamilyDetachedHousingUnitTrends--LoudounCounty
Single-familydetachedhousingunitsconsistofsingle-familyhomesnotattachedtootherhomes,mobilehomes,andRVvans.Therateofgrowthfortheseunits
isexpectedtomoderateinthenear-term,andthendeclineafter2020.
Sources:(a)U.S.CensusBureau,DecennialCensus1930to2000;(b)LoudounCountyGovernment,2007FiscalImpactCommitteeGuidelines,Table4.
Note:DataisupdatedinbetweenAnnualGrowthSummarypublications.PleaseseetheLoudounCountydemographicswebpageforthemostup-to-datedata.
Page7
- 8. TableA-4b
Single-FamilyDetachedHousingUnitTrendsbyPlanningSubarea,2000-2035
LoudounCounty,Virginia
Census
ActualEstimateEstimateEstimateForecastForecastForecastForecastForecastForecastForecastForecast
200020052006200720082009201020152020202520302035
Ashburn5,54010,47011,58812,24712,76313,12313,44314,48014,83114,89214,89214,892
Dulles1,8004,5835,3765,8766,3386,8387,3439,99712,36414,88615,91616,061
Leesburg5,9668,9609,2419,3869,5269,6359,71510,48512,90716,00317,87719,057
Northwest2,3332,9443,1493,2913,3823,4663,5264,1075,2606,3607,2048,859
Potomac7,2997,7367,7397,7427,7477,7497,7507,7597,7697,7797,7847,784
Route15North9331,2071,3591,4531,5441,6041,6592,0892,9303,7784,3384,491
Route15South8911,0161,0701,1361,2091,2591,3091,6762,1692,5842,8992,921
Route7West3,8605,5075,9516,1846,3586,4786,5787,2638,55210,33110,96811,013
Southwest2,4502,7382,8092,8382,8582,9282,9483,0583,4633,7964,1364,886
Sterling4,8574,9634,9935,0085,0115,0145,0175,0225,0275,0325,0375,037
Total35,92950,12453,27555,16156,73658,09459,28865,93675,27285,44191,05195,001
Notes:
(1)DataisupdatedinbetweenAnnualGrowthSummarypublications.PleaseseetheLoudounCountydemographicswebpageforthemostup-to-datedata.
(2)Totalsmaynotequalthesumoftheplanningsubareasduetorounding.
Single-FamilyDetachedHousingUnitTrendsbyPlanningSubarea,2000-2035
Between2006and2007single-familydetachedunitsincreasedthefastestintheDullesplanningsubarea,growingby9.3percent.Thelargestamountof
growthbetween2006and2007occurredintheAshburnplanningsubarea,growingby659.Between2007and2035,single-familydetachedunitsare
forecastedtohavethegreatestgrowthintheDullessubarea,taperoffintheAshburnsubarea,andcontinueintheplanningsubareastothewest.
Source:LoudounCountyDepartmentofManagementandFinancialServices.
FiveYearForecasts,2015-2035Annual,2005-2010
PlanningSubarea
Page8
- 9. TableA-5a
Single-FamilyAttachedHousingUnitTrends,2000-2035
LoudounCounty,Virginia
ActualEstimateEstimateEstimateEstimateEstimateEstimateEstimateForecastForecastForecastForecastForecast
Year2000(a)
2001(b)
2002(b)
2003(b)
2004(b)
2005(b)
2006(b)
2007(b)
2008(b)
2009(b)
2010(b)
2011(b)
2012(b)
HousingUnits17,38919,76621,34422,95225,19927,19928,75629,62630,72431,60432,43033,30634,216
PercentChange--13.7%8.0%7.5%9.8%7.9%5.7%3.0%3.7%2.9%2.6%2.7%2.7%
ForecastForecastForecastForecastForecastForecastForecastForecastForecastForecastForecastForecastForecast
Year2013(b)
2014(b)
2015(b)
2016(b)
2017(b)
2018(b)
2019(b)
2020(b)
2021(b)
2022(b)
2023(b)
2024(b)
2025(b)
HousingUnits35,10635,98636,89137,91539,03740,21241,45242,49943,34743,80244,12244,32344,453
PercentChange2.6%2.5%2.5%2.8%3.0%3.0%3.1%2.5%2.0%1.0%0.7%0.5%0.3%
ForecastForecastForecastForecastForecastForecastForecastForecastForecastForecast
Year2026(b)
2027(b)
2028(b)
2029(b)
2030(b)
2031(b)
2032(b)
2033(b)
2034(b)
2035(b)
HousingUnits44,47844,49844,49844,49844,49844,49844,49844,49844,49844,498
PercentChange0.1%0.0%0.0%0.0%0.0%0.0%0.0%0.0%0.0%0.0%
Sources:(a)U.S.CensusBureau,DecennialCensus1930to2000;(b)LoudounCountyGovernment,2007FiscalImpactCommitteeGuidelines,Table4.
Note:DataisupdatedinbetweenAnnualGrowthSummarypublications.PleaseseetheLoudounCountydemographicswebpageforthemostup-to-datedata.
Single-familyattachedhousingunitsconsistoftownhomesandduplexes.Aswithsingle-familydetachedunits,therateofgrowthfortheseunitsisexpectedto
moderateinthenear-term.Growthintheseunitsisforecastedtodeclinebeginningabouttheyear2020,withlittlecapacityforfurtherdevelopmentbasedon
currentplannedlanduse.
Single-FamilyAttachedHousingUnitTrends--LoudounCounty
Page9
- 10. TableA-5b
Single-FamilyAttachedHousingUnitTrendsbyPlanningSubarea,2000-2035
LoudounCounty,Virginia
Census
ActualEstimateEstimateEstimateForecastForecastForecastForecastForecastForecastForecastForecast
200020052006200720082009201020152020202520302035
Ashburn4,3418,3968,8549,1749,5179,83710,13711,80714,01914,54014,54014,540
Dulles9383,1563,9194,3934,9805,4525,9028,11210,71811,70411,70411,704
Leesburg2,9805,1225,3645,3805,4625,5225,5825,8826,0076,2476,2926,292
Northwest88888892107123139173173173173173
Potomac4,9285,5355,6075,6545,6915,6915,6915,6915,6915,7915,7915,791
Route15North131313163446464646464646
Route15South232323232929292929292929
Route7West4337217417417427427429471,2821,3051,3051,305
Southwest128142144150159159159159159159159159
Sterling3,5174,0034,0034,0034,0034,0034,0034,0454,3754,4594,4594,459
Total17,38927,19928,75629,62630,72431,60432,43036,89142,49944,45344,49844,498
Notes:
(1)DataisupdatedinbetweenAnnualGrowthSummarypublications.PleaseseetheLoudounCountydemographicswebpageforthemostup-to-datedata.
(2)Totalsmaynotequalthesumoftheplanningsubareasduetorounding.
Single-FamilyAttachedHousingUnitTrendsbyPlanningSubarea,2000-2035
PlanningSubarea
Between2006and2007,thenumberofsingle-familyattachedunitsincreasedthemostintheDullesplanningsubarea,growingby474units.Ashburnhadthe
secondhighestamountofgrowth,with320single-familyattachedunitsadded.Givencurrentplannedlandusepolicies,growthisforecastedtosubsideby2030.
Source:LoudounCountyDepartmentofManagementandFinancialServices.
FiveYearForecasts,2015-2035Annual,2005-2010
Page10
- 11. TableA-6a
Multi-familyHousingUnitTrends,2000-2035
LoudounCounty,Virginia
ActualEstimateEstimateEstimateEstimateEstimateEstimateEstimateForecastForecastForecastForecastForecast
Year2000(a)
2001(b)
2002(b)
2003(b)
2004(b)
2005(b)
2006(b)
2007(b)
2008(b)
2009(b)
2010(b)
2011(b)
2012(b)
HousingUnits8,84210,14811,22512,53214,02615,12016,21516,57216,87717,00417,16617,64618,231
PercentChange--14.8%10.6%11.6%11.9%7.8%7.2%2.2%1.8%0.8%1.0%2.8%3.3%
ForecastForecastForecastForecastForecastForecastForecastForecastForecastForecastForecastForecastForecast
Year2013(b)
2014(b)
2015(b)
2016(b)
2017(b)
2018(b)
2019(b)
2020(b)
2021(b)
2022(b)
2023(b)
2024(b)
2025(b)
HousingUnits19,06219,95720,88722,03723,38724,72225,98127,16128,29329,31330,23130,93131,540
PercentChange4.6%4.7%4.7%5.5%6.1%5.7%5.1%4.5%4.2%3.6%3.1%2.3%2.0%
ForecastForecastForecastForecastForecastForecastForecastForecastForecastForecast
Year2026(b)
2027(b)
2028(b)
2029(b)
2030(b)
2031(b)
2032(b)
2033(b)
2034(b)
2035(b)
HousingUnits32,07032,57533,03533,49533,95534,41534,83535,25535,66536,015
PercentChange1.7%1.6%1.4%1.4%1.4%1.4%1.2%1.2%1.2%1.0%
Sources:(a)U.S.CensusBureau,DecennialCensus1930to2000;(b)LoudounCountyGovernment,2007FiscalImpactCommitteeGuidelines,Table4.
Note:DataisupdatedinbetweenAnnualGrowthSummarypublications.PleaseseetheLoudounCountydemographicswebpageforthemostup-to-datedata.
Multi-familyHousingUnitTrends--LoudounCounty
Multi-familyhousingunitsconsistofcondominiumsandapartments.Givencurrentplannedlandusepolicies,therateofgrowthinthenumberoftheseunitsis
forecastedtoslowinthenear-term,increaseannuallybyfourtosixpercentinthemid-term,andthentaperlater.
Page11
- 12. TableA-6b
Multi-FamilyHousingUnitTrendsbyPlanningSubarea,2000-2035
LoudounCounty,Virginia
Census
ActualEstimateEstimateEstimateForecastForecastForecastForecastForecastForecastForecastForecast
200020052006200720082009201020152020202520302035
Ashburn2,1266,0096,5076,7566,9486,9486,9988,52411,53913,62115,62117,441
Dulles2688919099099661,0381,1022,1834,1835,6345,9546,194
Leesburg2,9943,4763,5543,6623,6623,6623,6624,3245,0845,7135,7135,713
Northwest111213131313131313131313
Potomac1,4971,9332,0402,0402,0962,1512,1992,2312,2312,2312,3262,326
Route15North181818181818181818181818
Route15South242424242424242424242424
Route7West175337337337337337337357416416416416
Southwest120121121121121121121121121121121121
Sterling1,6092,2992,6922,6922,6922,6922,6923,0923,5323,7493,7493,749
Total8,84215,12016,21516,57216,87717,00417,16620,88727,16131,54033,95536,015
Notes:
(1)DataisupdatedinbetweenAnnualGrowthSummarypublications.PleaseseetheLoudounCountydemographicswebpageforthemostup-to-datedata.
(2)Totalsmaynotequalthesumoftheplanningsubareasduetorounding.
Multi-FamilyHousingUnitTrendsbyPlanningSubarea,2000-2035
Between2006and2007,thenumberofmulti-familyunitsincreasedonlyintheAshburnandLeesburgplanningsubareas,by249and108unitsrespectively.
Multi-familydevelopmentisexpectedtoslowinthenear-termandthenincreaseafter2010.
Source:LoudounCountyDepartmentofManagementandFinancialServices.
PlanningSubarea
Annual,2005-2010FiveYearForecasts,2015-2035
Page12
- 13. TableA-7
PopulationofIncorporatedTownsandPlanningSubareas,2000and2007
LoudounCounty,Virginia
PopulationDistributionPopulationDistributionNumberPercent
IncorporatedTowns
Hamilton*5271.5%5331.1%61.1%
Hillsboro960.3%840.2%-12-12.5%
Leesburg28,31182.1%38,03279.1%9,72134.3%
Lovettsville8532.5%1,3812.9%52861.9%
Middleburg6321.8%7081.5%7612.0%
Purcellville3,58410.4%6,74714.0%3,16388.3%
RoundHill5001.4%5791.2%7915.8%
Total34,503100.0%48,064100.0%13,56139.3%
PlanningSubareas
Ashburn33,58119.8%73,50827.1%39,927118.9%
Dulles7,7954.6%29,96011.1%22,165284.4%
Leesburg31,84018.8%49,42018.2%17,58055.2%
Northwest6,4993.8%9,3883.5%2,88944.5%
Potomac39,11523.1%43,17615.9%4,06110.4%
Route15North2,5061.5%4,0691.5%1,56362.4%
Route15South2,4031.4%3,1441.2%74130.9%
Route7West12,3547.3%20,3787.5%8,02464.9%
Southwest6,0563.6%7,2912.7%1,23520.4%
Sterling27,45016.2%30,73511.3%3,28512.0%
Total169,599100.0%271,069100.0%101,47059.8%
(1)Percentagesmaynotsumto100%duetorounding.
Sources:U.S.CensusBureau,Census2000andLoudounCountyDepartmentofManagementandFinancialServices.
Notes:
PopulationofIncorporatedTownsandPlanningSubareas--LoudounCounty
20002007Change2000-2007
AmongthesevenincorporatedtownswithinLoudounCounty,Leesburghasexperiencedthemostgrowth,whereasPurcellvillehadthehighestgrowthrate.
TheAshburnplanningsubareaexperiencedthegreatestpopulationincreasebetween2000and2007,whereastheDullessubareahadthehighestgrowth
rate.MapsdepictingthetownsandplanningsubareasareprovidedinSectionI.
(2)Towndemographicdataisrepresentativeofthetownboundaryasitwasdefinedatthattime.
*2000housingunitsforHamiltondeterminedbasedonactualtownboundaries,ratherthanU.S.CensusBureauboundaries.
Page13
- 14. TableA-8
PopulationbyZipCode,2000and2007
LoudounCounty,Virginia
ZipCityPopulationDistributionPopulationDistributionNumberPercent
20105Aldie,VA1,5050.9%8,1483.0%6,643441.5%
20107Arcola,VA230.0%230.0%00.0%
20117Middleburg,VA*2,7801.6%3,1041.1%32511.7%
20120Centreville,VA*470.0%470.0%00.0%
20129PaeonianSprings,VA3990.2%5100.2%11127.7%
20130Paris,VA270.0%300.0%311.0%
20132Purcellville,VA9,1275.4%14,5975.4%5,47159.9%
20135Bluemont,VA*8220.5%9530.4%13115.9%
20141RoundHill,VA3,1711.9%5,5452.0%2,37474.9%
20147Ashburn,VA29,33117.3%47,19017.4%17,86060.9%
20148Ashburn,VA3,7872.2%20,1167.4%16,329431.2%
20152Chantilly,VA6,4783.8%19,0667.0%12,587194.3%
20158Hamilton,VA2,9801.8%4,2051.6%1,22541.1%
20164Sterling,VA34,41020.3%35,25413.0%8442.5%
20165Sterling,VA27,11216.0%30,91711.4%3,80414.0%
20166Dulles,VA4,1672.5%7,5472.8%3,38081.1%
20170Herndon,VA*210.0%210.0%00.0%
20175Leesburg,VA16,90610.0%24,0038.9%7,09642.0%
20176Leesburg,VA19,51911.5%39,93514.7%20,416104.6%
20180Lovettsville,VA4,4102.6%6,5392.4%2,12948.3%
20184Upperville,VA*3150.2%3350.1%206.3%
20197Waterford,VA1,2130.7%1,9220.7%70958.5%
22066GreatFalls,VA*1,0480.6%1,0570.4%90.9%
Source:U.S.CensusBureau,Census2000blockdata;LoudounCountyDepartmentofManagementandFinancialServices.
*OnlyaportionofthezipcodeiswithinLoudounCounty.ZipcodepopulationtotalsareonlyrepresentativeoftheportionofthezipcodewithinLoudounCounty.
Note:ZipcodetotalsmaynotsumtoCountytotalsduetorounding.
PopulationbyZipCode--LoudounCounty
20002007Change2000-2007
Ashburn(20147)andLeesburg(20176)containthehighestpopulation.Since2000,thezipcodeswiththefastestgrowthrateshavebeenAldie(20105)
andAshburn(20148),growingby441percentand431percentrespectively.Twootherzipcodeshaveincreasedbymorethan100percent:Chantilly
(20152)andLeesburg(20176).
Page14
- 15. TableA-9
HousingUnitsbyZipCode,2000and2007
LoudounCounty,Virginia
ZipCityHousingUnitsDistributionHousingUnitsDistributionNumberPercent
20105Aldie,VA6141.0%2,9973.0%2,383388.2%
20107Arcola,VA80.0%80.0%00.0%
20117Middleburg,VA*1,3692.2%1,4811.5%1128.2%
20120Centreville,VA*170.0%170.0%00.0%
20129PaeonianSprings,VA1510.2%1880.2%3724.5%
20130Paris,VA170.0%180.0%15.9%
20132Purcellville,VA3,3345.4%5,2825.2%1,94858.4%
20135Bluemont,VA*3410.5%3850.4%4412.9%
20141RoundHill,VA1,1731.9%1,9761.9%80368.4%
20147Ashburn,VA10,33916.6%17,84917.6%7,51072.6%
20148Ashburn,VA1,2462.0%7,4707.4%6,224499.4%
20152Chantilly,VA2,4894.0%7,0356.9%4,546182.6%
20158Hamilton,VA1,1171.8%1,5271.5%41036.7%
20164Sterling,VA11,96819.3%12,37512.2%4073.4%
20165Sterling,VA9,81015.8%11,44411.3%1,63416.7%
20166Dulles,VA1,6822.7%3,2793.2%1,59795.0%
20170Herndon,VA*60.0%60.0%00.0%
20175Leesburg,VA6,55110.5%9,2079.1%2,65640.5%
20176Leesburg,VA7,36211.8%15,28915.1%7,927107.7%
20180Lovettsville,VA1,6082.6%2,3212.3%71344.3%
20184Upperville,VA*1810.3%1880.2%73.9%
20197Waterford,VA4490.7%6860.7%23752.8%
22066GreatFalls,VA*3260.5%3290.3%30.9%
Source:U.S.CensusBureau,Census2000blockdata;LoudounCountyDepartmentofManagementandFinancialServices.
*OnlyaportionofthezipcodeiswithinLoudounCounty.ZipcodepopulationtotalsareonlyrepresentativeoftheportionofthezipcodewithinLoudounCounty.
Note:ZipcodetotalsmaynotsumtoCountytotalsduetorounding.
HousingUnitsbyZipCode--LoudounCounty
20002007Change2000-2007
Ashburn(20147)andLeesburg(20176)containthehighestnumberofhousingunits.Since2000,thezipcodeswiththefastestgrowthrateshavebeen
Ashburn(20148)andAldie(20105),growingby499percentand388percentrespectively.Twootherzipcodeshaveincreasedbymorethan100percent:
Chantilly(20152)andLeesburg(20176).
Page15
- 16. TableA-10
AgeCharacteristicsofResidents,2006
LoudounCounty,Virginia
AgeCohortNumberDistribution
Lessthan5years23,2398.8%
5to9years20,9518.0%
10to14years19,7087.5%
15to19years15,6386.0%
20to24years15,2815.8%
25to34years46,60417.7%
35to44years50,28119.1%
45to54years35,85513.7%
55to64years20,3787.8%
65to74years8,9043.4%
75to84years4,2581.6%
85yearsorOver1,5110.6%
Total262,609100.0%
Notes:
AgeCharacteristicsofResidents--LoudounCounty
(2)DataisupdatedinbetweenAnnualGrowthSummarypublications.PleaseseetheLoudounCountydemographicswebpageforthemostup-to-datedata.
RelativetotheU.S,LoudounCountyhasayoungpopulation.In2006,persons19yearsandyoungercomprisedof30percentofLoudoun'spopulation,
ascomparedto27percentnationally.LoudounagecharacteristicsaresummarizedandcomparedwiththeU.S.,Virginia,andtheWashington,D.C.
metropolitanareainTableA-12.
Sources:U.S.CensusBureau,2006TimeSeriesEstimates.LoudounCountyDepartmentofManagementandFinancialServices.
(1)Percentagesmaynotsumto100%duetorounding.
Page16
- 17. TableA-11
RaceandEthnicCharacteristicsofResidents,2000and2006
LoudounCounty,Virginia
RacePopulationDistributionPopulationDistributionNumberPercent
OneRace166,90498.4%256,68997.7%89,78553.8%
White145,05485.5%202,11877.0%57,06439.3%
BlackorAfricanAmerican12,0347.1%20,3637.8%8,32969.2%
AmericanIndianorAlaskanNative3980.2%7300.3%33283.4%
Asian9,2865.5%33,29012.7%24,004258.5%
NativeHawaiianorPacificIslander1320.1%1890.1%5742.8%
Twoormoreraces2,6951.6%5,9202.3%3,225119.7%
Total169,599100.0%262,609100.0%93,01054.8%
EthnicityPopulationDistributionPopulationDistributionNumberPercent
Hispanic(anyrace)10,0895.9%25,6029.7%15,513153.8%
Non-Hispanic(anyrace)159,51094.1%237,00790.3%77,49748.6%
Total169,599100.0%262,609100.0%93,01054.8%
Notes:
(1)Percentagesmaynotsumto100%duetorounding.
(2)DataisupdatedinbetweenAnnualGrowthSummarypublications.PleaseseetheLoudounCountydemographicswebpageforthemostup-to-datedata.
20002006
Sources:U.S.CensusBureau,Census2000and2006TimeSeriesEstimates.LoudounCountyDepartmentofManagementandFinancialServices.
Change2000-2006
RaceandEthnicCharacteristics--LoudounCounty
20002006Change2000-2006
Beginningin2000,theU.S.CensusBureau'smethodologyforreportingracialprofilesallowedtheoptionofselectingmorethanonerace.From2000to2006,
thewhitepopulationhashadthehighestamountofgrowth,andtheAsianpopulationhashadthehighestrateofgrowth.Otherpopulationgroupswithover100
percentgrowthratesincludethoseoftwoormoreracesandHispanics.NotethatHispanicisanethnicity,andtherefore,canbeofanyrace.Thisraceand
ethnicityinformationisoftenusedinwritinggrants,advertising,andmarketing.
Page17
- 18. TableA-12
ComparativeDemographicOverview,2006
UnitedStates•Virginia•Washington,D.C.MetroArea•LoudounCounty
UnitedStatesVirginia
Washington,D.C.
MetroArea
LoudounCounty,
VA*
Population
Total299,398,4847,642,8845,290,400268,817
Age(Number)
Age0to19Years82,079,1062,018,4071,437,53481,416
Age20to64Years180,059,0264,736,7093,346,490172,381
Age65Yearsandolder37,260,352887,768506,37615,020
Age(Distribution)
Age0to19Years27.4%26.4%27.2%30.3%
Age20to64Years60.1%62.0%63.3%64.1%
Age65Yearsandolder12.4%11.6%9.6%5.6%
MedianAge
MedianAge(years)36.436.936.333.2
Race(Number)
OneRace294,679,8157,519,7905,189,786262,757
White239,746,2545,605,2403,300,938206,896
BlackorAfricanAmerican38,342,5491,519,8121,420,56820,844
AmericanIndianorAlaskanNative2,902,85126,02019,832747
Asian13,159,343363,094443,71334,077
NativeHawaiian/PacificIslander528,8185,6244,735193
TwoormoreRaces4,718,669123,094100,6146,060
ComparativeDemographicOverview
Withnearly5.3millionresidentsin2006,theWashington,D.C.metropolitanstatisticalarearepresentedasizableanddiversemarket.The
disproportionatelylargeworking-agepopulationandthehighincomeinthemetropolitanareasupportsadynamicandprosperouseconomy.In2006,
LoudounCountyrankedsecondintheUnitedStatesformedianhouseholdincome.Loudoun'sgrowingHispanicpopulation,nowat9.7percentofthe
population,representsalowershareofthepopulationthaninthemetropolitanareabuthigherthanintheCommonwealthofVirginia.
Page18
- 19. TableA-12,Continued
ComparativeDemographicOverview,2006
UnitedStates•Virginia•Washington,D.C.MetroArea•LoudounCounty
UnitedStatesVirginia
Washington,D.C.
MetroArea
LoudounCounty,
VA*
Race(Distribution)
OneRace98.4%98.4%98.1%97.7%
White80.1%73.3%62.4%77.0%
BlackorAfricanAmerican12.8%19.9%26.9%7.8%
AmericanIndianorAlaskanNative1.0%0.3%0.4%0.3%
Asian4.4%4.8%8.4%12.7%
NativeHawaiian/PacificIslander0.2%0.1%0.1%0.1%
TwoormoreRaces1.6%1.6%1.9%2.3%
Ethnicity(Number)
Hispanic(anyrace)44,321,038479,530609,20926,207
Non-Hispanic(anyrace)255,077,4467,163,3544,681,191242,610
Ethnicity(Distribution)
Hispanic(anyrace)14.8%6.3%11.5%9.7%
Non-Hispanic(anyrace)85.2%93.7%88.5%90.3%
Households
Number111,617,4022,905,0711,942,51683,011
AverageHouseholdSize2.612.552.673.24
Income(currentdollars)
PerCapitaIncome$25,267$29,899$38,635$40,380
MedianHouseholdIncome$48,451$56,277$78,978$99,371
Note:DataisupdatedinbetweenAnnualGrowthSummarypublications.PleaseseetheLoudounCountydemographicswebpageforthemostup-to-datedata.
Source:U.S.CensusBureau,2006AmericanCommunitySurvey(medianage,household,andincomedata)and2006TimeSeriesEstimates(allotherdata).
*U.S.CensusBureaupopulation,household,andhouseholdsizeestimatesforLoudounCountydifferfromcountyestimatesandarepresentedhereforconsistencywith
regional,state,andnationaldata.SeeTablesA-1bandA-2forLoudounCountypopulationandhouseholdestimates.ForLoudounCountyestimatesofpopulationbyage,race
andethnicityseeTablesA-10andA-11.
Page19
- 20. TableA-13
Jurisdiction2000200720002007NumberPercent
AlexandriaCity128,283140,0246.1%5.7%11,7419.2%
ArlingtonCounty189,453204,5689.0%8.3%15,1158.0%
ClarkeCounty12,65214,3610.6%0.6%1,70913.5%
FairfaxCity21,49823,3491.0%1.0%1,8518.6%
FairfaxCounty969,7491,010,24145.8%41.2%40,4924.2%
FallsChurchCity10,37710,9480.5%0.4%5715.5%
FauquierCounty55,13966,3282.6%2.7%11,18920.3%
FredericksburgCity19,27922,4100.9%0.9%3,13116.2%
LoudounCounty169,599278,797*8.0%11.4%109,19864.4%
ManassasCity35,13535,4121.7%1.4%2770.8%
ManassasParkCity10,29011,4260.5%0.5%1,13611.0%
PrinceWilliamCounty280,813360,41113.3%14.7%79,59828.3%
SpotsylvaniaCounty90,395119,1944.3%4.9%28,79931.9%
StaffordCounty92,446120,7234.4%4.9%28,27730.6%
WarrenCounty31,58436,2941.5%1.5%4,71014.9%
Total2,116,6922,454,486100.0%100.0%337,79416.0%
Note:2000populationasofApril1and2007populationasofJuly1.
NorthernVirginiaJurisdictions
NumberChange2000-2007Distribution
*U.S.CensusBureau's2007dataforLoudounCountydiffersfromCountyestimatesandispresentedhereforconsistencywithregionaldata.SeeTableA-1bforLoudoun
Countypopulationestimates.
Population--NorthernVirginia
Overthelastsevenyears,thepopulationinNorthernVirginiaincreasedby16percent.Duringthesameperiod,thepopulationofLoudounCounty
increasedby64percent,anincreaseofmorethan109,000persons,accountingfornearlyone-thirdofthepopulationgrowthinNorthernVirginia.
AccordingtoU.S.CensusBureauestimates,LoudounCountywasthesecondfastest-growingcountybetween2000and2007amongcountiesinthe
U.S.withapopulationgreaterthan100,000.
Population,2000and2007
Sources:U.S.BureauoftheCensus,Census2000and2007TimeSeriesEstimates.
Page20
- 21. TableA-14
DecennialPopulationForecasts,1990-2030
NorthernVirginiaJurisdictions*
Jurisdiction199020002010202020301990-20002000-102010-202020-3019902000201020202030
AlexandriaCity111.2128.3142.6156.2171.115.4%11.1%9.5%9.5%7.3%6.7%5.9%5.5%5.6%
ArlingtonCounty170.9190.3217.2235.8242.511.4%14.2%8.6%2.8%11.2%10.0%8.9%8.3%7.9%
FairfaxCity19.621.423.525.626.59.2%9.9%8.9%3.4%1.3%1.1%1.0%0.9%0.9%
FairfaxCounty818.6969.01,135.51,278.81,334.018.4%17.2%12.6%4.3%53.6%50.8%46.6%45.0%43.3%
FallsChurchCity9.610.412.314.715.48.3%18.3%19.5%4.8%0.6%0.5%0.5%0.5%0.5%
LoudounCounty86.1169.6301.1409.9468.597.0%77.5%36.1%14.3%5.6%8.9%12.4%14.4%15.2%
ManassasCity/
ManassasParkCity
34.745.453.657.358.730.8%18.0%7.0%2.3%2.3%2.4%2.2%2.0%1.9%
PrinceWilliamCounty215.7281.3415.8491.5555.030.4%47.8%18.2%12.9%14.1%14.7%17.1%17.3%18.0%
StaffordCounty61.292.4135.3175.0210.951.0%46.4%29.3%20.5%4.0%4.8%5.6%6.2%6.8%
NorthernVirginiaTotal1,527.61,908.12,436.92,844.83,082.624.9%27.7%16.7%8.4%100.0%100.0%100.0%100.0%100.0%
(2)DataisupdatedinbetweenAnnualGrowthSummarypublications.PleaseseetheLoudounCountydemographicswebpageforthemostup-to-datedata.
Source:MetropolitanWashingtonCouncilofGovernments(MWCOG),Round7.1CooperativeForecasts,approvedJanuary2008.
*MWCOGmemberjurisdictions.
Notes:
(1)Jurisdictiontotalsmaynotsumtoregionaltotalduetorounding.
Population(inthousands)PercentChangeRegionalDistribution
PopulationForecasts--NorthernVirginia
Accordingtotheregionalforecast,basedoncontributionsfromeachMetropolitanWashingtonCouncilofGovernments(MWCOG)memberjurisdiction,the
populationofNorthernVirginiawillgrowby27.7percentfrom2000to2010.LoudounCountyisforecastedtobethefastestgrowingjurisdictioninNorthern
Virginiabetween2000and2010aswellasbetween2010and2020,withapopulationincreaseof77.5percentand36.1percentrespectively.Between2020
and2030,LoudounCountywillbethesecondfastestgrowingjurisdictioninNorthernVirginia,afterStaffordCounty.
Page21
- 23. InthisSection:
LoudounCounty
B-124
Regional
B-2
25
B-3
26
SectionB-Income
•Adjustedgrossincome(AGI)isgatheredfromincometaxreturns.AGIisincomefrom
taxablesources(wagesandsalaries,interest,dividends,andrentsandroyalties)minus
allowableadjustments,butnotincludingstandardsanditemizeddeductions.
Incometrendsreflectthestandardoflivingthatpeoplecanaffordandtheextenttowhich
livingstandardsvaryfrompersontoperson.Incomestatisticsareusefulindetermining
thevolumeandnatureofthegoodsandservicesthatapopulationislikelytoconsume.
Thedistributionofincomewithin(andbetween)jurisdictionsprovidesawaytodescribethe
diversityofthepopulationwithintheareaandacrosstheregionasawhole.
Whilereviewingthissectionthefollowingdefinitionsmaybehelpful:
PerCapitaandHouseholdIncomeTrends..
•Percapitaincomeisderivedbydividingthetotalpersonalincomebythetotal
population,wherepersonalincomeisthesumofwagesandsalaries,otherlaborincome,
proprietors'income,rentalincomeofpersons,dividendincome,personalinterestincome,
andtransferpaymentslesspersonalcontributionsforsocialinsurance.
•Medianhouseholdincomeisamiddlefigure,itdivideshouseholdsintotwogroups,with
halfofallhouseholdsearningmorethanthemedianincomeandhalfofallhouseholds
earningless.
Becausechildrendonotearnincome,jurisdictionswithhigherconcentrationsofchildren
willhavelowerpercapitaincomes.LoudounCounty'spopulationofresidents19yearsof
ageandyoungerisover30percent,causingLoudoun'spercapitaincometobelowerthan
jurisdictionswherethepopulationofchildrenislower.
IncomeCharacteristics--NorthernVirginia
Jurisdictions.........................
IncomeReportedonFederalTaxReturns--
NorthernVirginiaJurisdictions............
Page23
- 24. TableB-1
PerCapitaandHouseholdIncome*Trends,1999and2006
LoudounCounty,Virginia
1999200619992006
LoudounCounty$33,530$40,380$80,648$99,371
Virginia$23,975$29,899$46,677$56,277
UnitedStates$21,587$25,267$41,994$48,451
Note:Themedianofagroupofnumbersisthemiddlenumberofvaluewheneachiteminthegroupisarrangedaccordingtosize.
PerCapitaandHouseholdIncomeTrends--LoudounCounty
*Incomeinnominal(current)dollars.TheCensusBureauincomefromCensus2000isfor1999,andthe2006AmericanCommunitySurveyincomeisin2006
inflationadjusteddollars.
PerCapitaMedianHousehold
Sources:U.S.CensusBureau,Census2000and2006AmericanCommunitySurvey.
BoththepercapitaincomeandthemedianhouseholdincomearehigherinLoudounCountythannationallyandintheCommonwealthofVirginia.
LoudounCounty'smedianhouseholdincomeof$99,371rankedsecondintheU.S.A.in2006.TheU.S.percapitaincomefor2006was$25,267,and
themedianhouseholdincomewas$48,451.InVirginia,the2006percapitaincomewas$29,899,andthemedianhouseholdincomewas$56,277.
WhenanalyzingandcomparingLoudoun'spercapitaincome,keepinmindthattherelativelyhighproportionofchildreninthecountylowerstheper
capitaincome.
Page24
- 25. Jurisdiction
Per
Capita
Median
Household
Lessthan
$15,000
$15,000-
$24,999
$25,000-
$49,999
$50,000-
$99,999
$100,000-
$149,999
$150,000-
$199,999$200,000+
AlexandriaCity$52,530$80,4495.2%5.9%18.0%32.1%19.0%8.4%11.2%
ArlingtonCounty$53,543$87,3506.4%4.9%13.3%33.6%19.5%9.0%13.5%
FairfaxCounty$46,499$100,3184.5%3.6%12.8%28.8%22.2%12.9%15.2%
FauquierCounty$34,315$74,7168.3%4.1%17.3%31.8%20.0%9.5%9.1%
LoudounCounty$40,380$99,3714.2%3.0%12.1%31.2%24.0%14.1%11.5%
PrinceWilliamCounty$33,319$80,7833.7%3.1%18.3%37.3%21.4%9.1%7.1%
SpotsylvaniaCounty$31,458$72,4535.3%6.6%18.5%37.4%20.6%7.9%3.6%
StaffordCounty$31,860$85,0145.2%3.4%14.9%38.9%24.2%8.3%5.1%
AllNorthernVirginia$45,508$91,6444.8%3.9%14.5%32.1%21.7%11.1%11.9%
IncomeCharacteristics,2006*
TableB-2
Thetremendouswealthoftheregionisreflectedinthefollowingincomedata.Accordingto2006estimates,Arlingtonleadstheregioninpercapitaincome,
andFairfaxCountyleadstheregioninmedianhouseholdincome.Nationally,FairfaxCountyandLoudounCountyrankfirstandsecondrespectivelyin
medianhouseholdincome.Nationally,18percentofhouseholdshaveincomesover$100,000,comparedto45percentinNorthernVirginia.Attheotherend
ofthespectrum,25percentofhouseholdsintheU.S.haveincomesunder$25,000,comparedto9percentinNorthernVirginia.
IncomeCharacteristics--NorthernVirginia
NorthernVirginiaJurisdictions**
IncomePercentofHouseholdswithIncomes
Sources:U.S.CensusBureau,2006AmericanCommunitySurvey;NorthernVirginiafiguresestimatedbyLoudounCountyDepartmentofManagementandFinancialServices.
*The2006AmericanCommunitySurveyincomeisin2006inflationadjusteddollars.
Note:Themedianofagroupofnumbersisthemiddlenumberorvaluewheneachiteminthegroupisarrangedaccordingtosize.
**U.S.CensusBureau,AmericanCommunitySurveyjurisdictions(populationsof65,000ormore).
Page25
- 26. TableB-3
NorthernVirginiaJurisdictions
Jurisdiction20042005
AlexandriaCity$84,557$92,933
ArlingtonCounty$95,515$106,585
ClarkeCounty$68,180$74,788
FairfaxCity$81,045$88,008
FairfaxCounty$96,482$105,230
FallsChurchCity$101,815$116,483
FauquierCounty$80,347$86,163
FredericksburgCity$61,377$66,181
LoudounCounty$100,449$109,120
ManassasCity$70,328$73,529
ManassasParkCity$61,084$65,725
PrinceWilliamCounty$79,850$84,970
SpotsylvaniaCounty$69,263$73,859
StaffordCounty$81,752$86,811
WarrenCounty$59,217$63,520
NorthernVirginia$88,344$95,154
Virginia$62,109$67,160
IncomeReportedonFederalTaxReturnsforMarriedCouples--NorthernVirginia
(1)Themedianofagroupofnumbersisthemiddlenumberorvaluewheneachiteminthegroupisarrangedaccordingtosize.
MarriedCoupleMedianAdjustedGrossIncome,2004-2005
Adjustedgrossincome(AGI)isgatheredfromincometaxreturns.AGIisincomefromtaxablesources(wagesandsalaries,interest,dividends,andrentsand
royalties)minusallowableadjustments,butnotincludingstandardsanditemizeddeductions.Although2007figuresarenotyetavailable,AGIdataareuseful
becausetheyrepresentactualfiguresratherthansurveyestimates.AmongcountiesinVirginia,Loudounhadthehighestmarriedcouplemedianin2005,and
rankedsecondbehindFallsChurchCityamongalljurisdictionsinVirginia.
Notes:
Sources:VirginiaDepartmentofTaxationandWeldonCooperCenterforPublicService,UniversityofVirginia.
(2)DuetochangesintheVirginiaDepartmentofTaxationandWeldonCooperCenter'scomputationmethods,prioryearsarenotcomparableto2004and2005data.
Page26
- 27. InthisSection:
LoudounCounty
C-1CivilianLaborForceTrends..............28
Regional
C-2
29
LoudounCountybenefitsfrombeingpartoftheWashington,D.C.metropolitanarea,one
ofthemoststableemploymentmarketsinthenation.Withadiverseemploymentbase
thatincludesmanyhigh-wagejobs,thecounty'sresidentsfindmanyoptionsbothwithinthe
countyandthroughouttheprosperousWashington,D.C.metropolitanarea.
SectionC-LaborForce
CivilianLaborForce--NorthernVirginia
Jurisdictions..........................
Thelaborforceisasignificantindicatoroftheeconomicandsocialconditionofa
community.Itdefinesthesupplyanddemandforemployment,andthestrengthofthe
businessesthatsupportthatdemand.Fromthisinformation,conclusionscanbedrawn
abouttheavailabilityofjobs,thesocialclimateofthearea,andthestandardsofliving.
Inanalyzingthestatusofacommunity’slaborforce,thefollowingdefinitionsmaybe
helpful:
•Civilianlaborforceincludesallcountyresidents,16andolder,whoareeitherworkingor
lookingforwork.
•Unemploymentnumberreferstopeoplewhohadnoemployment,butwereactively
seekingwork.
•Unemploymentrateisequaltounemploymentdividedbylaborforce.
Page27
- 28. TableC-1
CivilianLaborForceTrends,1997-2007
LoudounCounty,Virginia
YearNumberRate
199776,03674,6191,4171.9%
199883,09082,0741,0161.2%
199990,43989,4659741.1%
200099,47698,0721,4041.4%
2001108,511105,8172,6942.5%
2002117,359113,2694,0903.5%
2003126,460122,8983,5622.8%
2004137,913134,9362,9772.2%
2005142,021139,2482,7732.0%
2006157,670154,3323,3382.1%
2007160,188156,7433,4452.2%
Source:VirginiaEmploymentCommission:LAUSUnitandBureauofLaborStatistics.
Unemployment
CivilianLaborForceTrends--LoudounCounty
Thecivilianlaborforcerepresentsthenumberofpeople16andolderwhoresideinloudouncountyandareeligibletowork.ThelaborforceinLoudoun
Countyincreasedadramatic104percentduringthelasttenyears.Evenduringtheaftermathofthe2001recession,thecounty'sunemploymentratedidnot
riseabove3.5percent.
Civilian
LaborForce
Employed
Persons
Page28
- 29. TableC-2
CivilianLaborForce,2007
NorthernVirginiaJurisdictions
JurisdictionNumberDistributionNumberRate
AlexandriaCity89,1106.2%87,1541,9562.2%
ArlingtonCounty129,6419.1%127,1832,4581.9%
ClarkeCounty8,1740.6%7,9592152.6%
FairfaxCity13,4750.9%13,1293462.6%
FairfaxCounty597,22441.9%584,50812,7162.1%
FallsChurchCity6,7620.5%6,5572053.0%
FauquierCounty37,3332.6%36,3929412.5%
FredericksburgCity11,8760.8%11,3225544.7%
LoudounCounty155,09110.9%151,7173,3742.2%
ManassasCity21,6471.5%21,0446032.8%
ManassasParkCity6,8820.5%6,7101722.5%
PrinceWilliamCounty199,72814.0%194,7674,9612.5%
SpotsylvaniaCounty65,2294.6%63,5561,6732.6%
StaffordCounty64,9224.6%63,2201,7022.6%
WarrenCounty19,6461.4%19,0436033.1%
NorthernVirginia1,426,740100.0%1,394,26132,4792.3%
Virginia4,060,0933,936,604123,4893.0%
U.S.153,124,167146,046,6677,077,5004.6%
Source:VirginiaEmploymentCommission:LAUSUnitandBureauofLaborStatistics.
CivilianLaborForce
CivilianLaborForce--NorthernVirginia
Unemployment
Employment
Loudouncontributesalmost11percenttothelaborforceintheNorthernVirginiaregionandisthethird-largestlabormarket.Loudoun'sunemployment
ratetiedforthethirdlowestintheregionin2007.AllofNorthenVirginiarepresentsapproximately35percentofthetotalcivilianlaborforceinVirginia.
Loudouncontributes4percenttothestatewidecivlianlaborforce.
Page29
- 30. InthisSection:
LoudounCounty
D-131
D-233
D-3EmploymentbyZipCode................34
D-435
D-5EstablishmentsbyZipCode..............36
D-6MajorEmployers.......................37
D-7
40
Regional
D-8
41
D-9
42
•Anestablishmentisaneconomicunitsuchasafarm,factory,store,orminethat
producesgoodsorprovidesservices.Itisusuallyatasinglephysicallocationandengaged
inonepredominanttypeofeconomicactivity.Abusinessmayhavemorethanone
establishment.
InNorthernVirginia,LoudounCountyranksthirdinemployment,andisforecastedtoaddthe
second-highestnumberofjobsofallNorthernVirginiacountiesforeachofthedecades
between2000and2030.
EmploymentForecasts--
NorthernVirginia.....................
TrendsinAverageWeeklyWagesby
NAICS..............................
TrendsinEstablishmentsbyNAICS.......
At-PlaceEmploymentby
NAICS--NorthernVirginia..............
•Wagesconsistofearningsbeforepayrolldeductions,includingproductionbonuses,
incentiveearnings,commissionsandcost-of-livingadjustment.
LoudounCountyhasadiverseemploymentbase.Threeindustrysectorshavea10
percentorgreatershareofemployment:Construction,RetailTrade,andServices.This
diversityhasallowedthecountytomaintainstabilitywhencertainindustriesexperiencea
slowdown,orwhentheoveralleconomydips.Transportationandtechnology-related
businesses,includingAOL,UnitedAirlines,andOrbitalSciencesCorporationcomprisea
significantshareofLoudoun'semployment.
SectionD-Employment
EmploymentTrendsandForecasts........
Theemployment,establishment,andwageinformationprovidedhereiscompiledfromthe
QuarterlyCensusofEmploymentandWages(QCEW),formallyknownasES202.QCEW
isaFederal/Statecooperativeprogramthatcollectsandcompilesemploymentandwage
dataforworkerscoveredbyStateunemploymentinsurance(UI)laws,andFederalcivilian
workerscoveredbyUnemploymentCompensationforFederalEmployees.Thisdata
excludesproprietors,theself-employed,unpaidfamilymembers,andcertainfarmand
domesticworkers.Thefollowingareadditionaldefinitionsthatmaybehelpfulwhen
analyzingthisdata:TrendsinEmploymentbyNAICS..........
•At-placeemploymentisthenumberofworkerscoveredbystateunemployment
insuranceatthecitedestablishmentinLoudounCounty.
Page30
- 31. TableD-1a
DecennialEmployment*TrendsandForecasts,2000-2030
LoudounCounty,Virginia
Year2000201020202030
Employment95,412164,611236,472285,065
PercentChange--72.5%43.7%20.5%
TableD-1b
LoudounCounty,Virginia
ActualEstimateEstimateEstimateEstimateEstimateEstimateForecastForecastForecastForecastForecastForecast
Year2000200120022003200420052006200720082009201020112012
Employment95,412106,183107,330117,570123,383130,308137,709145,468151,592158,070164,611171,140177,433
PercentChange--11.3%1.1%9.5%4.9%5.6%5.7%5.6%4.2%4.3%4.1%4.0%3.7%
ForecastForecastForecastForecastForecastForecastForecastForecastForecastForecastForecastForecastForecast
Year2013201420152016201720182019202020212022202320242025
Employment184,297191,132198,049205,667213,243220,818228,639236,472243,829250,611256,075261,489265,645
PercentChange3.9%3.7%3.6%3.8%3.7%3.6%3.5%3.4%3.1%2.8%2.2%2.1%1.6%
ForecastForecastForecastForecastForecastForecastForecastForecastForecastForecast
Year2026202720282029203020312032203320342035
Employment269,713273,807277,928281,694285,065288,408291,694294,922297,985300,937
PercentChange1.5%1.5%1.5%1.4%1.2%1.2%1.1%1.1%1.0%1.0%
EmploymentTrendsandForecasts--LoudounCounty
TheemploymentdatadescribedinthesetwotablesrepresentsthenumberofpeopleworkinginLoudounCounty.Thegrowthoftechnologyclusters,the
expansionactivityatWashingtonDullesInternationalAirport,andincreasesinfederalgovernmentcontractshavecontributedtothecounty'shighrateof
employmentgrowth.Between2007and2017,employmentisprojectedtoincreaseby47percent.
AnnualEmployment*TrendsandForecasts,2000-2035
*Employmentincludesworkerscoveredbystateunemploymentinsurancelaws,federalcivilianworkers,self-employed,andmilitary.
Source:LoudounCountyGovernment,2007FiscalImpactCommitteeGuidelines,Table4.
Page31
- 32. TableD-1c
Employment*TrendsbyPlanningSubarea,2000-2035
LoudounCounty,Virginia
Census
ActualEstimateEstimateEstimateForecastForecastForecastForecastForecastForecastForecastForecast
200020052006200720082009201020152020202520302035
Ashburn34,10850,82154,63959,06262,23365,17768,02781,11596,141108,238117,379125,285
Dulles16,34822,07023,86125,03826,01627,43128,94337,50946,67054,03257,36359,714
Leesburg11,85017,02817,59917,97718,79419,62520,53226,36532,75237,51041,08743,949
Northwest5406306476636777538269061,1401,2351,3051,430
Potomac5,1456,7186,8096,9546,9637,1727,3397,6037,6967,8737,9947,960
Route15North208223240263272286299361448528581595
Route15South169187196233255266277333393440474482
Route7West2,4223,8734,0074,2654,3434,6895,0336,8218,62110,15111,11711,887
Southwest1,0471,0121,0181,0261,4021,4581,4871,5241,5691,6051,6391,700
Sterling23,56827,74228,69329,98730,63731,21431,84735,51141,04244,03246,12747,935
Total95,412130,308137,709145,468151,592158,070164,611198,049236,472265,645285,065300,937
Notes:
(1)DataisupdatedinbetweenAnnualGrowthSummarypublications.PleaseseetheLoudounCountydemographicswebpageforthemostup-to-datedata.
(2)Totalsmaynotequalthesumoftheplanningsubareasduetorounding.
*Employmentincludesworkerscoveredbystateunemploymentinsurancelaws,federalcivilianworkers,self-employed,andmilitary.
EmploymentTrendsbyPlanningSubarea,2000-2035
Between2006and2007thegreatestamountofgrowthoccurredintheAshburnplanningsubarea,growingby4,423,andthesecondgreatestamountof
growthwasintheSterlingplanningsubarea,with1,294moreemployees.Between2007and2025thegreatestamountofgrowthisexpectedtobeinthe
AshburnandDullesplanningsubareas.After2025,theAshburnandLeesburgplanningsubareasareforecastedtohavethemostgrowth.
Source:LoudounCountyGovernment,2007FiscalImpactCommitteeGuidelines,Table5.
Planning
Subarea
Annual,2005-2010FiveYearForecasts,2015-2035
Page32
- 33. TrendsinAt-PlaceEmployment--LoudounCounty
TableD-2
TrendsinAt-PlaceEmploymentbyNAICSIndustry,1997-2007
LoudounCounty,Virginia
NorthAmericanIndustry
ClassificationSystem(NAICS)19971998199920002001200220032004200520062007
Agricultural,Forestry,Fishing274260271332354418388431393411404
Mining186232179180192185175184194222234
Utilities85928891(D)10595949189(D)
Construction5,8456,6977,0348,24310,07210,43911,04812,88613,74416,11916,157
Manufacturing3,5683,8183,7184,3703,8194,0984,2154,5204,8705,1444,811
WholesaleTrade2,2102,2912,2852,5002,6372,8122,9033,0983,1313,2153,292
RetailTrade6,7506,8518,3739,13310,30810,95711,68313,03313,92315,25515,890
Transportation&Warehousing8,1349,24210,80811,85012,29711,45011,33210,28112,1319,1849,241
Information1,2411,4864,7566,48810,59610,56410,28710,6619,9409,2178,194
Finance,Insurance,RealEstate2,4762,6452,6552,8832,8852,9903,4363,4943,9273,9564,060
Services19,57621,29924,28428,05130,19230,19532,61836,71640,54344,15047,666
Government:State630602662709802800813817876916913
Government:Local5,8566,4037,1337,9478,7669,90110,70911,37912,43913,77514,552
Government:Federal3,8813,8734,1604,2684,1884,0984,8124,5943,7304,2204,243
TotalAllIndustries60,74565,95176,41687,04697,20099,013104,514112,189119,933125,874129,745
NewJobs5,5695,20610,46510,63010,1541,8135,5017,6757,7445,9413,871
PercentChange10.1%8.6%15.9%13.9%11.7%1.9%5.6%7.3%6.9%5.0%3.1%
(D)-Non-disclosabledata.
Note:Coveredemployment;dataexcludeself-employed.
Source:VirginiaEmploymentCommission:LaborMarketStatistics,CoveredEmploymentandWages.Secondquarterdata.
Duringthedownturninthenationaleconomyfrom2000through2002,thecounty'sjobgrowthslowed;however,thecountyneverhadanoverallnetlossofjobs.
ThediversityofemploymentinLoudounhasallowedthecountytomaintainstabilitywhencertainindustries,ortheeconomyingeneral,haveexperienceda
slowdown.Themixofemploymenthasremainedrelativelyconstantoverthepast10years;however,theInformationsectorgrewsignificantlyinitsshare,from
2percenttoover6percent.Also,whiletheTransportation&Warehousingsectorlostsomeofitsshare,decreasingfromover13percentin1997to7percent
in2007,itincreasedinabsolutenumberduringthesametimeperiod.
Page33
- 34. TableD-3
At-PlaceEmploymentbyZipCode,2007
LoudounCounty,Virginia
ZipCity
Ag,
Forestry,
FishingMiningUtilities
Construc-
tion
Manufac-
turing
Wholesale
Trade
Retail
TradeT&W1
Informa-
tionFIRE2
Services
Public
Admini-
stration
All
Industries
20105Aldie5.4%0.0%0.0%1.4%0.0%0.0%1.3%0.1%0.0%0.3%1.6%0.0%1.1%
20107Arcola0.0%0.0%0.0%0.2%0.0%0.0%0.0%0.0%0.0%0.0%0.1%0.0%0.1%
20117Middleburg*24.5%0.0%0.0%0.9%1.4%0.5%1.6%0.1%0.5%2.7%1.7%0.2%1.3%
20129PaeonianSprings0.0%0.0%0.0%0.1%0.0%0.1%0.1%0.0%0.0%0.0%0.0%0.0%0.0%
20132Purcellville13.7%0.0%1.0%4.5%5.1%2.6%4.0%1.5%0.4%2.7%3.8%1.7%3.4%
20135Bluemont*1.3%0.0%0.0%0.2%0.0%0.0%0.0%0.0%0.0%0.0%0.3%0.0%0.2%
20141RoundHill4.3%0.0%0.0%0.6%0.1%0.4%0.1%0.1%0.0%0.1%0.5%1.0%0.4%
20147Ashburn0.0%0.0%9.2%3.6%9.7%12.2%9.0%1.6%30.3%16.5%12.3%0.2%10.4%
20148Ashburn0.0%0.0%0.0%0.5%0.3%0.5%2.1%0.0%0.2%1.9%6.4%0.0%3.3%
20152Chantilly4.5%44.7%0.0%6.8%2.2%1.6%2.6%1.2%0.1%2.2%4.4%0.0%3.6%
20158Hamilton3.1%0.0%0.0%0.5%0.3%0.0%0.1%0.1%0.0%0.4%0.5%0.2%0.3%
20164Sterling0.0%0.0%0.0%7.1%9.9%8.8%14.1%3.4%0.7%7.4%9.9%3.7%8.4%
20165Sterling0.0%0.0%0.0%1.6%0.4%1.7%8.3%0.9%1.8%5.8%7.3%0.0%4.9%
20166Dulles7.0%15.2%0.0%57.4%65.8%55.9%29.9%65.9%59.2%34.3%23.1%13.2%36.8%
20175Leesburg2.0%40.1%89.8%6.7%2.7%6.2%8.6%10.1%4.8%13.9%11.2%31.3%10.5%
20176Leesburg11.7%0.0%0.0%2.5%0.6%5.2%17.5%0.6%0.9%8.8%14.0%10.3%9.8%
20180Lovettsville1.1%0.0%0.0%1.2%0.0%0.4%0.2%0.1%0.1%0.4%0.5%0.0%0.5%
20184Upperville*18.0%0.0%0.0%0.0%0.0%0.2%0.0%0.0%0.0%0.2%0.0%0.0%0.1%
20197Waterford2.5%0.0%0.0%0.1%0.0%0.2%0.0%0.0%0.1%0.9%0.2%0.6%0.2%
22066GreatFalls*0.0%0.0%0.0%0.0%0.0%0.0%0.0%0.0%0.0%0.0%0.0%0.0%0.0%
0.9%0.0%0.0%3.9%1.6%3.6%0.7%14.3%0.8%1.2%2.1%37.7%4.8%
100%100%100%100%100%100%100%100%100%100%100%100%100%
2
Financial,Insurance,RealEstate.
*OnlyaportionofthezipcodeiswithinLoudounCounty.ZipcodeemploymenttotalsareonlyrepresentativeoftheportionofthezipcodewithinLoudounCounty.
NotAvailable
At-PlaceEmploymentbyZipCode--LoudounCounty
Dulles(20166)isthelargestemploymentcenter,followedbyLeesburg(20175)andAshburn(20147).ThisisnotsurprisingasmanyofLoudoun'slargest
employers,AOL,INOVALoudounHospital,andVerizonBusiness,arelocatedinthesezipcodes.AzipcodemapisprovidedinSectionI.
Source:VirginiaEmploymentCommission:LaborMarketStatistics,2ndQuarter2007.Compiledby:LoudounCountyDepartmentofEconomicDevelopment.
1
Transportation&Warehousing
Page34
- 35. TableD-4
TrendsinEstablishmentsbyNAICSIndustry,1997-2007
LoudounCounty,Virginia
NorthAmericanIndustry
ClassificationSystem
(NAICS)19971998199920002001200220032004200520062007
Agricultural,Forestry,Fishing6065626467686867737273
Mining77767876555
Utilities4554(D)56544(D)
Construction510552557591670709749807838870888
Manufacturing137139133135134130142145157158167
WholesaleTrade197215244266315338336352365385394
RetailTrade453464516566615634663712741819828
Transportation&Warehousing134148162184191198206219236253264
Information84102108126146134134153158183188
Finance,Insurance,RealEstate288295316361383404416476531593607
Services1,7051,8641,9992,1882,4652,6262,8293,1193,4423,8364,215
Government:State1919191920191919202123
Government:Local2726313131313131106190186
Government:Federal2924232427263133313044
TotalAllIndustries3,6613,9434,1864,5655,0755,3305,6376,1446,7077,4197,885
NewEstablishments238282243379510255307507563712466
PercentChange6.9%7.7%6.2%9.1%11.2%5.0%5.8%9.0%9.2%10.6%6.3%
(D)-Non-disclosabledata.
Source:VirginiaEmploymentCommission:LaborMarketStatistics,CoveredEmploymentandWages;Secondquarterdata.
Note:Coveredemployment;dataexcludeself-employed.
TrendsinEstablishments--LoudounCounty
Anestablishmentisusuallyatasinglelocationandengagedinonepredominantactivity.Whilethenumberofestablishmentsisusedasanapproximation
ofthenumberofbusinessesinthecounty,acompanymaybecomprisedofmorethanoneestablishmentiftheyareinmorethanonelocation,orare
engagedinmultipleservicesorproductsthatfallunderdifferentindustryclassifications.Approximately84percentofthebusinessesinLoudounhave20or
feweremployees.ManyofthesesmallbusinessareconcentratedinthosesectorswithahighnumberofestablishmentssuchasServices,Construction,
andRetail.
Page35
- 37. TableD-6
MajorEmployers,SecondQuarter2007
LoudounCounty,Virginia
CompanyNameIndustryDescription*
Employment
Range
LoudounCountyPublicSchoolsEducationalServices5,000+
AOL,LLCInternetServiceProviders,WebSearchPortals,andDataProcessingServices1,000-5,000
CountyofLoudounExecutive,Legislative,andOtherGeneralGovernmentSupport1,000-5,000
HomelandSecurityJustice,PublicOrder,andSafetyActivities1,000-5,000
LoudounHospitalCenterHospitals1,000-5,000
MC.Dean,Inc.SpecialtyTradeContractors1,000-5,000
OrbitalSciencesCorporationComputerandElectronicProductManufacturing1,000-5,000
TollBrothers,Inc.ConstructionofBuildings1,000-5,000
U.S.PostalServicePostalService1,000-5,000
UnitedAirLines,Inc.AirTransportation1,000-5,000
VerizonBusinessTelecommunications1,000-5,000
WalMartAssociates,Inc.GeneralMerchandiseStores1,000-5,000
AirServCorporationSupportActivitiesforTransportation500-999
AirWisconsinAirlinesCorp.AirTransportation500-999
BenchmarkConferenceResorts(LansdowneResort)Accommodation500-999
CostcoWholesaleGeneralMerchandiseStores500-999
DepartmentofTransportationAdministrationofTransportationPrograms500-999
DobbsInternationalServiceFoodServicesandDrinkingPlaces500-999
DynalectricCompany,Inc.SpecialtyTradeContractors500-999
GiantFoodStoresFoodandBeverageStores500-999
HarrisTeeter,Inc.FoodandBeverageStores500-999
McDonaldsRestaurantofVirginiaFoodServicesandDrinkingPlaces500-999
MajorEmployers--LoudounCounty
Loudoun’smajoremployersaredefinedasthosewith250ormoreemployees.Transportationandtechnology-relatedbusinessesconstituteasignificantshare
ofLoudoun’smajoremployers.Sinceapproximately97percentofLoudoun'sbusinesseshavefewerthan100employees,thislistrepresentsonlyasmall
portionofthebusinessenvironment.AlistofLoudounemployerswith100ormoreemployeesisavailableontheDepartmentofEconomicDevelopment's
websiteathttp://biz.loudoun.gov.
Page37
- 38. TableD-6,Continued
MajorEmployers,SecondQuarter2007
LoudounCounty,Virginia
CompanyNameIndustryDescription*
Employment
Range
MetropolitanWashingtonAirportsAuthorityAdministrationofEconomicPrograms500-999
SouthlandConcreteCorporationConstructionofBuildings500-999
TargetCorporationGeneralMerchandiseStores500-999
TownofLeesburgExecutive,Legislative,andOtherGeneralGovernmentSupport500-999
U.S.DepartmentofTransportationAirTrafficControlServices500-999
Verisign,Inc.Professional,Scientific,andTechnicalServices500-999
WegmansFoodMarkets,Inc.FoodandBeverageStores500-999
AirlineTariffPublishers,Inc.InternetPublishingandBroadcasting250-499
BestBuyStores,LPElectronicsandApplianceStores250-499
CarmaxAutoSuperstores,Inc.MotorVehicleandPartsDealers250-499
ClubDemonstrationServices,Inc.Professional,Scientific,andTechnicalServices250-499
ClydeBroadland,Inc.FullServiceRestaurants250-499
ComputerSciencesCorporationProfessional,Scientific,andTechnicalServices250-499
DynamicDetails,Inc.ComputerandElectronicProductManufacturing250-499
FalconsLandingNursingandResidentialCareFacilities250-499
FederalExpressCorporationCouriersandMessengers250-499
FoodLion,LLCFoodandBeverageStores250-499
GeminiAirCargo,Inc.DIPAirTransportation250-499
GeorgeWashingtonUniversityEducationalServices250-499
HomeDepotUSA,Inc.BuildingMaterialandGardenEquipmentandSuppliesDealers250-499
JKMoving&Storage,Inc.TruckTransportation250-499
LaneConstructionCorporationHighway,StreetandBridgeConstruction250-499
LoudounMedicalGroup,PCAmbulatoryHealthCareServices250-499
MastecServicesCompany,Inc.Professional,Scientific,andTechnicalServices250-499
MeadowsFarms,Inc.AdministrativeandSupportServices250-499
NALCHealthBenefitPlanInsuranceCarriersandRelatedActivities250-499
NationalElectronicsWarrantyCorporationInsuranceCarriersandRelatedActivities250-499
Neustar,Inc.Professional,Scientific,andTechnicalServices250-499
Page38
- 39. TableD-6,Continued
MajorEmployers,SecondQuarter2007
LoudounCounty,Virginia
CompanyNameIndustryDescription*
Employment
Range
Nordstrom,Inc.GeneralMerchandiseStores250-499
NorthernVirginiaCommunityCollegeEducationalServices250-499
ProspectWaterproofing,Co.SpecialtyTradeContractors250-499
RockwellCollinsSimulationProfessional,Scientific,andTechnicalServices250-499
SafewayStores,Inc.FoodandBeverageStores250-499
ShoppersFoodWarehouseCorporationGeneralMerchandiseStores250-499
SwissportUSA,Inc.SupportActivitiesforTransportation250-499
TelosCorporationProfessional,Scientific,andTechnicalServices250-499
Source:VirginiaEmploymentCommission.CompiledbyLoudounCountyDepartmentofEconomicDevelopment
*Industriesareselfreported.
Page39
- 40. TableD-7
NorthAmericanIndustry
ClassificationSystem(NAICS)19971998199920002001200220032004200520062007
Agricultural,Forestry,Fishing$378$384$439$475$498$550$524$491$553$529$571
Mining$743$698$845$906$898$1,026$947$1,006$1,050$1,090$1,098
Utilities$856$992$941$921(D)$1,037$1,099$1,045$1,103$1,070(D)
Construction$589$627$662$710$756$784$771$820$866$906$948
Manufacturing$796$785$735$785$798$910$961$1,107$1,070$1,214$1,309
WholesaleTrade$961$1,019$965$1,029$1,159$1,052$1,126$1,135$1,158$1,257$1,317
RetailTrade$428$406$407$448$452$472$489$483$515$520$527
Transportation&Warehousing$506$599$590$618$702$715$688$772$716$771$772
Information$688$853$2,620$3,974$7,614$2,117$2,102$2,048$2,034$2,138$2,104
Finance,Insurance,RealEstate$598$655$673$797$830$935$986$995$1,031$1,123$1,180
Services$518$595$642$673$738$766$831$805$910$982$1,031
Government:State$505$540$550$573$536$556$568$557$588$652$684
Government:Local$548$572$591$633$689$736$753$769$792$792$829
Government:Federal$941$1,075$1,096$1,207$1,270$1,348$1,268$1,294$1,424$1,358$1,383
AverageAllIndustries$583$639$768$933$1,488$912$924$926$950$995$1,016
PercentChange4.1%9.6%20.2%21.5%59.5%-38.7%1.3%0.2%2.6%4.7%2.1%
Source:VirginiaEmploymentCommission:LaborMarketStatistics,CoveredEmploymentandWages;Secondquarterdata.
Note:Coveredemployment;dataexcludeself-employed.
TrendsinAverageWeeklyWages--LoudounCounty
TheaverageweeklywageinLoudounCountyhasincreasedover74percentinthepast10years.Regionally,theaverageweeklywagehasincreasedonly65
percentduringthesameperiod,from$674in1997to$1,115in2007.Duringthe"techboom"somecompaniesofferedlarge,monetarycompensation
packages,reflectedinthehighwagesfrom1999through2001intheInformationSector.
TrendsinAverageWeeklyWagesbyNAICSIndustry,1997-2007
LoudounCounty,Virginia
Page40
- 41. Jurisdiction
Ag,Forestry,
FishingMiningUtilitiesConstructionManufacturing
Wholesale
Trade
Retail
TradeT&W*InformationFIRE**ServicesGovernmentAllIndustries
AlexandriaCity(D)03453,5271,4602,0508,4391,7142,2526,42851,08322,41499,712
ArlingtonCounty(D)05602,5286981,2759,1758,0324,6547,36179,67139,221153,181
ClarkeCounty154(D)04621,08113629224201649587544,413
FairfaxCity00(D)1,1282023283,8391009681,29211,8931,57221,595
FairfaxCounty113(D)(D)31,73210,87815,92254,0776,93928,23635,171325,15077,606586,961
FallsChurchCity000660941671,314973403855,9183,62512,600
FauquierCounty53467(D)3,4948357922,8043222176878,3203,94122,055
FredericksburgCity(D)0(D)8614897194,1001577431,20114,7903,80626,912
LoudounCounty404234(D)16,1574,8113,29215,8909,2418,1944,06047,66619,708129,745
ManassasCity0(D)(D)2,7772,4263883,3085721861,02211,3382,99525,042
ManassasParkCity0001,451213253244(D)(D)327426463,736
PrinceWilliamCounty10611738213,3002,1682,39019,0811,8991,5003,27237,73222,773104,719
SpotsylvaniaCounty43(D)03,4191,4818336,6901,6282811,1519,3285,39930,302
StaffordCounty11(D)(D)3,4547942,4033,906550276(D)10,4328,01034,832
WarrenCounty(D)008901,1291231,3631,277693534,6191,77711,611
NorthernVirginiaTotal1,4006272,89685,84028,75731,068134,52232,68847,94767,436619,985214,2471,267,416
Distribution0.1%0.0%0.2%6.8%2.3%2.5%10.6%2.6%3.8%5.3%48.9%16.9%100.0%
Source:VirginiaEmploymentCommission:LaborMarketStatistics,CoveredEmploymentandWages.Secondquarterdata.
Note:IndividualcountyAllIndustriesTotalmaynotsumexactlytoNorthernVirginiatotal-seeVECdata.
*TransportationandWarehousing.**Finance,Insurance,andRealEstate.
(D)-Dataaresuppressed.Valuesmaynotsumtototalduetosuppressionandroundingerror.SuppresseddataareincludedinAllIndustriestotals.
NorthernVirginiaJurisdictions
At-PlaceEmploymentbyNAICSIndustryClassification,2ndQuarter2007
At-PlaceEmployment--NorthernVirginia
Loudounranksthirdintheregion'semployment,accountingforover10percentoftheemploymentinNorthernVirginia;however,Loudounhaslargershares
ofemploymentinparticularsectors.Loudoun'sTransportationandWarehousingshareis28percent,theManufacturingshareis17percent,and
Constructionis19percent.ItisalsoworthnotingthatLoudoun'sshareoftheInformationsectoris17percent,secondintheregion.
TableD-8
Page41
- 42. TableD-9
Employment*Forecasts,2000-2030
NorthernVirginiaJurisdictions**
Jurisdiction20002010202020302000-102010-202020-302000201020202030
AlexandriaCity89.3107.8124.5141.520.7%15.5%13.6%7.9%7.6%7.4%7.5%
ArlingtonCounty182.6215.4241.9258.418.0%12.3%6.9%16.1%15.2%14.3%13.7%
FairfaxCity28.831.335.339.38.7%12.8%11.3%2.5%2.2%2.1%2.1%
FairfaxCounty577.0683.6782.2847.618.5%14.4%8.4%50.9%48.2%46.3%45.0%
FallsChurchCity9.511.817.820.324.2%50.8%14.0%0.8%0.8%1.1%1.1%
LoudounCounty95.4166.9241.3290.774.9%44.6%20.5%8.4%11.8%14.3%15.4%
Manassas/ManassasParkCities25.229.131.031.715.6%6.5%2.3%2.2%2.1%1.8%1.7%
PrinceWilliamCounty94.6128.6159.1186.035.9%23.8%16.9%8.4%9.1%9.4%9.9%
StaffordCounty30.244.157.167.946.1%29.5%18.9%2.7%3.1%3.4%3.6%
Total1,132.61,418.61,690.21,883.525.3%19.1%11.4%100.0%100.0%100.0%100.0%
up-to-datedata.
*Employmentincludesworkerscoveredbystateunemploymentinsurancelaws,federalcivilianworkers,self-employed,andmilitary.
(2)DataisupdatedinbetweenAnnualGrowthSummarypublications.PleaseseetheLoudounCountydemographicswebpageforthemost
**MWCOGmemberjurisdictions.
Notes:
(1)Jurisdictiontotalsmaynotsumtoregionaltotalduetorounding.
Source:MetropolitanWashingtonCouncilofGovernments(MWCOG),Round7.1CooperativeForecasts,approvedJanuary2008.
EmploymentForecasts--NorthernVirginia
Employment(inthousands)PercentChangeRegionalDistribution
Accordingtotheregionalforecast,basedoncontributionsfromeachMetropolitanWashingtonCouncilofGovernments(MWCOG)memberjurisdiction,
LoudounCountywasthethird-largestemploymentcenterintheregionin2000andwillcontinuetobeuntil2030whenitisforecastedtobecomesecond.
LoudounCountyisalsoforecastedtohavethesecondhighestabsoluteemploymentgrowthforeachofthedecadesbetween2000and2030ofallNorthern
Virginiajurisdictions.
Page42
- 44. 200020012002200320042005*
Apparel$167.87$196.21$226.91$246.98$265.70$128.89
Automotive$89.61$113.20$228.02$259.17$293.82$154.68
Food$606.88$664.78$697.91$748.34$881.15$437.60
Equipment$255.06$256.76$256.72$366.13$315.17$186.74
GeneralMerchandise$433.26$423.94$359.96$387.02$424.54$203.75
Lumber,BuildingMaterial,andSupply$232.22$273.95$290.64$316.44$383.75$184.40
Fuel$9.76$8.25$5.10$13.06$14.32$7.92
Machinery,Equipment,andSupplies$163.22$142.44$115.22$120.41$171.88$81.64
Miscellaneous$424.43$484.55$525.44$601.42$701.48$379.51
Hotels,Motels,TouristCamps,Etc.$99.26$75.12$79.26$89.15$88.87$51.24
AlcoholicBeverage$3.85$5.43$3.62$9.69$10.75$3.28
OtherMiscellaneousandUnidentifiable$4.19$3.56$6.63$11.23$28.58$14.55
Total$2,489.61$2,648.17$2,795.44$3,169.05$3,580.00$1,834.21
Source:VirginiaDepartmentofTaxation.
TrendsinTaxableSales--LoudounCounty
*DuetotheimplementationofanewaccountingsystemattheVirginiaDepartmentofTaxation,retailsalesfor2005wereunderreported.Onlyfirstandsecondquarter
of2005arerepresented.Duringthesecondhalfof2005theVirginiaDepartmentofTaxationchangedcategorizationtoalignwithNAICSindustrycodes.
TaxableSales($M)
Taxablesalesincludealltransactionssubjecttotax.Totaltaxablesalesdonotnecessarilyindicatethegrosssalesofbusinessesbecauseonlytransactions
subjecttosalesandusetaxareincluded.Taxablesalesactasagaugeforconsumerspendingandlocaleconomicperformance.Duetotheimplementationof
anewaccountingandcategorizationsystem,onlythefirstandsecondquartersof2005arereported.
TableE-1a
TrendsinTaxableSales,2000-2005*
LoudounCounty,Virginia
Category
Page44
- 45. TableE-1b
2005*20062007
Agricultural,Forestry,Fishing$1.14$3.49$6.88
Construction$17.74$50.27$78.70
Manufacturing$50.65$153.46$150.74
WholesaleTrade$83.32$198.33$199.88
RetailTrade$973.83$2,368.03$2,562.32
Transportation&Warehousing$1.06$3.02$5.08
Information$0.46$24.39$13.47
Finance,Insurance,RealEstate$29.84$85.92$87.61
Services$253.69$621.26$774.11
Unclassified$114.82$335.70$179.89
MiscellaneousandUnidentifiable$76.71$113.09$126.62
Total$1,603.26$3,956.96$4,185.30
Source:VirginiaDepartmentofTaxation.
*DuetotheimplementationofanewaccountingsystemattheVirginiaDepartmentofTaxation,retailsalesfor2005were
underreported.Onlythirdandfourthquartersof2005arerepresented.Duringthesecondhalfof2005theVirginiaDepartmentof
TaxationchangedcategorizationtoalignwithNAICSindustrycodes.
WhiletheoveralltaxablesalesinLoudounCountyincreased6percentfrom2006to2007,certainindustriesincreasedbylargerpercentagesthanothers.
Forexample,increasingbyover97percent,Agricultural,Forestry,Fishingexperiencedthelargestpercentageincrease.ConstructionandTransportationand
Warehousinghadthesecondandthirdlargestpercentageincreases,bothgrowingbymorethan50percent.Duetotheimplemenationofanewaccounting
andcategorizationsystem,onlythethirdandfourthquartersof2005arereported.
TrendsinTaxableSales--LoudounCounty
TrendsinTaxableSalesbyNAICSIndustry,2005*-2007
LoudounCounty,Virginia
NorthAmericanIndustry
ClassificationSystem
(NAICS)
TaxableSales($M)
Page45
- 47. TableE-3a
Year1962*1970198019902000
DomesticPassengers52,8461,869,1942,086,2149,042,82915,872,660
InternationalPassengers0288,269538,1841,395,2604,232,033
TotalPassengers52,8462,157,4632,624,39810,438,08920,104,693
FreightTotal(000lbs)96138,93154,738295,892709,319
TableE-3b
Year199619971998199920002001
DomesticPassengers10,095,34010,697,38912,444,66216,054,95815,872,66014,020,710
InternationalPassengers2,798,6883,060,4723,301,6803,742,3714,232,0333,981,609
TotalPassengers12,894,02813,757,86115,746,34219,797,32920,104,69318,002,319
FreightTotal(000lbs)559,546644,937651,821647,404709,319635,469
Year200220032004200520062007
DomesticPassengers13,145,60712,928,04718,213,88622,128,74717,787,48818,792,173
InternationalPassengers4,089,5564,022,3344,654,9964,923,3715,233,2965,945,355
TotalPassengers17,235,16316,950,38122,868,88227,052,11823,020,78424,737,528
FreightTotal(000lbs)670,327589,876653,338636,979746,152767,434
TrendsinAirportPassengersandFreight--LoudounCounty
WashingtonDullesInternationalAirportcontinuestobeadrivingforceintheregionaleconomy.Astheregion'seconomicengine,theairportemploysmorethan
18,800peopleandgenerates$6.2billioninbusinessrevenue.In2007,severalinternationalairlinesintroducednewservicestomeetpassengerdemandat
Dulles,contributingtoaninternationalpassengerrecordthere.Theairportservednearly6millioninternationalpassengersin2007,a13.7percentincreasefrom
the5.2millioninternationalpassengersservedin2006.
Source:MetropolitanWashingtonAirportsAuthority.
*WashingtonDullesInternationalAirportopenedin1962.
AnnualTrendsinAirportPassengersandFreight,1996-2007
DecennialTrendsinAirportPassengersandFreight,1962-2000
WashingtonDullesInternationalAirport
WashingtonDullesInternationalAirport
Page47
- 49. TableF-1
HousingUnitsbyType,2000and2007
LoudounCounty,Virginia
TypeofUnitNumberDistributionNumberDistributionNumberPercent
Single-FamilyDetached35,92957.8%55,16154.4%19,23253.5%
Single-FamilyAttached17,38928.0%29,62629.2%12,23770.4%
Multi-family8,84214.2%16,57216.3%7,73087.4%
Total62,160100.0%101,359100.0%39,19963.1%
Compiledby:LoudounCountyDepartmentofManagementandFinancialServices.
Sources:U.S.CensusBureau,Census2000;LoudounCountyDepartmentofBuilding&Development.
2000
TrendsinHousingUnitsbyType--LoudounCounty
In2007,LoudounCounty'sresidentialinventorywas101,359unitsandsingle-familydetachedunitswereestimatedtoaccountfor54percentofallunits.Single-
familyattachedandmulti-familyunitsarebecomingagreatershareoftheresidentialinventoryintheCounty.Multi-familyunitsincreasedby87percentfrom
2000to2007,thefastestrateamongallunittypes.
2007Change2000-2007
Page49
- 50. TableF-2
HousingUnitsbyTypeinIncorporatedTownsandPlanningSubareas,2000and2007
LoudounCounty,Virginia
SFDSFAMFTotalSFDSFAMFTotal
IncorporatedTowns
Hamilton*14843202111504320213
Hillsboro380038340034
Leesburg4,8552,8302,98710,6726,6344,0963,65514,385
Lovettsville26067113384346911514
Middleburg24575523722549552401
Purcellville8882681321,2881,6575052912,453
RoundHill159016175189016205
Total6,5933,2833,21813,0949,3524,8084,04518,205
PlanningSubareas
Ashburn5,5404,3412,12612,00712,2479,1746,75628,177
Dulles1,8009382683,0065,8764,39390911,178
Leesburg5,9662,9802,99411,9409,3865,3803,66218,428
Northwest2,33388112,4323,29192133,396
Potomac7,2994,9281,49713,7247,7425,6542,04015,436
Route15North93313189641,45316181,487
Route15South89123249381,13623241,183
Route7West3,8604331754,4686,1847413377,262
Southwest2,4501281202,6982,8381501213,109
Sterling4,8573,5171,6099,9835,0084,0032,69211,703
Total35,92917,3898,84262,16055,16129,62616,572101,359
(2)Towndemographicdataisrepresentativeofthetownboundaryasitwasdefinedatthattime.
HousingUnitsbyTypeinIncorporatedTownsandPlanningSubareas--LoudounCounty
20002007
(1)SFD(Single-FamilyDetached),SFA(Single-FamilyAttached),MF(Multi-family)
*2000housingunitsforHamiltondeterminedbasedonactualtownboundaries,ratherthanU.S.CensusBureauboundaries.
AmongthesevenincorporatedtownswithinLoudounCounty,Purcellvilleexperiencedthehighestgrowthrate,90percent,between2000and2007.Since2000,
theAshburnplanningsubareahasmorethandoubleditsnumberofhousingunitsandtheDullessubareahasalmostquadrupled.
Sources:U.S.CensusBureau,Census2000andLoudounCountyDepartmentofManagementandFinancialServices.
Notes:
Page50
- 51. TableF-3
TrendsinResidentialBuildingPermitsIssuedforNewUnitsbyType,1997-2007
LoudounCounty,Virginia
AllUnits
NumberPercentNumberPercentNumberPercentNumber
YearIssuedofTotalIssuedofTotalIssuedofTotalIssued
19971,90454.3%1,27836.5%3239.2%3,505
19982,38445.2%1,52729.0%1,36325.8%5,274
19992,74646.8%1,81731.0%1,30622.3%5,869
20002,68043.7%2,37738.8%1,07717.6%6,134
20011,82738.8%1,57833.5%1,30727.7%4,712
20022,87448.1%1,60826.9%1,49425.0%5,976
20033,31649.8%2,24733.8%1,09416.4%6,657
20043,49853.1%2,00030.3%1,09516.6%6,593
20053,15162.2%1,55730.7%3577.0%5,065
20061,88661.6%87028.4%30510.0%3,061
20071,44152.6%99736.4%30111.0%2,739
1997-200727,70749.8%17,85632.1%10,02218.0%55,585
Source:LoudounCountyDepartmentofBuilding&Development.Compiledby:LoudounCountyDepartmentofManagementandFinancialServices.
TrendsinResidentialBuildingPermitsbyType--LoudounCounty
Single-FamilyDetachedSingle-FamilyAttachedMulti-family
In2007,2,739buildingpermitsfornewresidentialunitswereissued,adeclinefromrecentyears.TheWashington,D.C.region,andthenationasa
whole,alsoexperienceddeclinesinbuildingpermitsin2007.About53percentofLoudoun'spermitswereforsingle-familydetachedunits,36percent
wereforsingle-familyattachedunits,and11percentwereformulti-familyorcondominiums.
Page51
- 53. ResidentialBuildingPermitsbyPlanningSubarea--LoudounCounty
TableF-5
ResidentialBuildingPermitsIssuedbyPlanningSubarea,1997-2007
LoudounCounty,Virginia
TotalDistribution
199719981999200020012002200320042005200620071997-20071997-2007
Ashburn1,2621,9462,2452,3951,8173,2752,4442,8541,8251,17199622,23040.0%
Dulles5046847486795046512,1481,5071,5561,03196810,98019.8%
Leesburg6197659111,4351,3301,1041,0377626311612128,96716.1%
Northwest467310112077118108185205146921,2712.3%
Potomac49999081758047717611615975106884,0837.3%
Route15North515831313157579315297997571.4%
Route15South24272936142024315466824070.7%
Route7West2712672973813263644805624642331463,7916.8%
Southwest49507175265572447335485981.1%
Sterling180414619402110156171396301582,5014.5%
Total3,5055,2745,8696,1344,7125,9766,6576,5935,0653,0612,73955,585100.0%
TheAshburn,Dulles,andLeesburgplanningsubareashavethree-fourthsofalltheresidentialbuildingpermitsissuedsince1997.Amapshowingthe
locationoftheplanningsubareasisprovidedinSectionI.
Source:LoudounCountyDepartmentofBuilding&Development.Compiledby:LoudounCountyDepartmentofManagementandFinancialServices.
NumberofPermitsforNewUnitsPlanning
Subarea
Page53
- 55. TableF-6,continued
LoudounCounty,Virginia
FrontierSpringDulles1310023
GooseCreekBendLeesburg1001
GooseCreekVillageSouthAshburn015015
GreeneMillReserve(WoodlandVillage)Dulles2311034
GrenataLeesburg1001
HamiltonRidge(FawnMeadow,SaddleRidge)Route7West1001
HamletsofBlueRidge,TheRoute7West7007
HeatherKnollsRoute7West3003
Highlands,TheRoute7West160016
HirstFarmRoute7West370037
HistoricSelmaEstatesRoute15North180018
KelleySouthwest1001
KingsridgeEstatesNorthwest170017
KirkpatrickFarmsDulles115960211
Lansdowne(LansdowneVillageGreens,LeisureWorld,LindenRow)(3)
Ashburn191690188
Lee'sCrossingRoute15North1001
LittleRiverFarms(Masira)Route15South4004
LongmoorFarmEstatesRoute7West2002
LoudounValleyEstates(BroadRunMeadows,LoudounValleyPreserve,
ChurchillMeadows)
Ashburn210021
LoudounValleyEstatesIIAshburn689077
LovettsvilleRetirementVillageNorthwest012012
LovettsvilleTownCenterNorthwest3003
MorelandEstates(CorroProperty)Ashburn150015
NewTownMeadowsNorthwest230023
OaklawnLeesburg063063
Project/Subdivision(1)
Planning
Subarea
ResidentialBuildingPermitsIssuedbyProject/Subdivision,2007
Single-Family
Detached
Single-Family
AttachedMulti-familyTotal
Page55
- 57. TableF-6,continued
LoudounCounty,Virginia
WoodmarFarmRoute7West6006
WrightFarmRoute7West210021
Other128130141
Total1,4429963012,739
(4)IncludesRoundHillRuralEstates,MountainValley,LakePoint,andTheVillagesatRoundHill.
ResidentialBuildingPermitsIssuedbyProject/Subdivision,2007
Project/Subdivision
(1)
Planning
Subarea
Single-Family
Detached
Single-Family
AttachedMulti-familyTotal
(1)Includesrezoningsandby-rightprojects.
Note:Projectsapprovedforatleast20unitsarelisted.Otherresidentialbuildingpermitsareincludedinthe"Other"row.
Source:LoudounCountyDepartmentofBuilding&Development.CompiledbyLoudounCountyDepartmentofManagementandFinancialServices.
(2)IncludesFalcon'sLanding,PotomacLakes,PotomacSquare,PotomacTerrace,TownCenteratWestlakes,andPotomacLakesTownCenter.Single-familydetachedarecompleteandwerebuilt
atfewerunitsthanapproved.
(3)TheportionofLansdowneintheLeesburgplanningsubareaiscompleted.SeethecompletedprojectssupplementalinformationontheLoudounCountyGovernment2007AnnualGrowthSummary
websiteforinformationontheLeesburgplanningsubareaportionofLansdowne.
Page57
- 58. SFDSFAMFTotalSFDSFAMFTotalSFDSFAMFTotal
6,8257,67416,32130,8204,4932,9403,29610,7292,4054,73412,95220,09135%
Alexander'sChase65142020700006514202070%
Amberleigh806401446962013111201391%
AshbyPonds(Erickson
Retirement)(2)002,1082,10800154154001,9541,9547%
AshburnPlace27002700002700270%
BelmontGlenVillage(BelmontGlen
RouseProperty)
196001960000196001960%
BelmontRidge02902900000290290%
Broadlands1,9461,2258464,0171,7751,0165323,32317120931469483%
DullesParkwayCenter006246240000006246240%
EvergreenHamlets(3)
70007020002050005029%
Flynn'sCrossing
(RyanParkCenter)
025022847801332283610117011776%
GooseCreekChase240024230023100196%
GooseCreekPreserve20212817050000002021281705000%
GooseCreekVillageNorth0300264564000003002645640%
GooseCreekVillageSouth09209201501507707716%
HuntmooreatWaxpool03703700000370370%
Lansdowne(LansdowneVillage
Greens,LeisureWorld,Linden
Row)(4)
1,2221,0493,3275,5981,2959271,8434,06501221,4111,53373%
LoudounParkwayCenter1413305391,0105033053991991009191%
UnitsBuiltorPermitted
asof1/1/08
Ashburn
UnitsRemainingtobePermitted
asof1/1/08
Percent
Complete
ApprovedResidentialProjects--LoudounCounty
TableF-7
MajorApprovedResidentialProjects(20+Units),2007
LoudounCounty,Virginia
Morethanonehundredmajorprojectswithgreaterthan20units,totalingover74,000units,havebeenapprovedinLoudounCounty.AsofJanuary1,2008,
buildingpermitshavebeenissuedforover32,000unitsoutofthemorethan74,000unitsapproved,leavingover41,000tobepermitted.Completedprojects
arenotshownonthistable.Alistofhousingunitsforcompletedprojectsisavailableinthe2007GrowthSummarysectionoftheDepartmentofEconomic
Developmentwebsite,biz.loudoun.gov.
PlanningSubarea/
ProjectName(1)
TotalApprovedUnits
Page58
- 59. SFDSFAMFTotalSFDSFAMFTotalSFDSFAMFTotal
Ashburn,continued
LoudounStation(5)
001,5141,5140000001,5141,5140%
LoudounValleyEstates(BroadRun
Meadows,LoudounValleyPreserve,
ChurchillMeadows)
7422350977706235094136003696%
LoudounValleyEstatesII7451,0719452,7616890776771,0629452,6843%
MoorefieldStation(5)
501,3004,6506,0000000501,3004,6506,0000%
MorelandEstates
(CorroProperty)
80008023002357005729%
MorleyCorner001281280000001281280%
OneLoudoun2653294461,04000002653294461,0400%
PotomacGreen5115723901,473278209048723336339098633%
RegencyatAshburn151111422680000151111422680%
ReserveatBellaTerra,The43004331003112001272%
ReserveatWaxpool2524049000025240490%
RyansCorner014301430000014301430%
StationView04704700000470470%
Stonegate10093019300001009301930%
VillagesofWaxpool(Overlookat
BeaverdamCreek)
192001921510015141004179%
Windermere8410301874408809901794%
Dulles10,29110,5765,59526,4624,7204,5971,30110,6185,6116,4303,80315,84440%
ArcolaCenter05506191,169000005506191,1690%
Avonlea(PinebrookeVillage,
PinebrookeEstates)
6534304082087010745256030126%
BlueSpringFarm670067640064300396%
BraddockCorner699001594246088274407155%
BraddockCrossing58134019200005813401920%
Brambleton(3)
3,0502,9504336,4331,0297904332,2522,0212,16004,18135%
BrambletonActiveAdult03151,1871,502000003151,1871,5020%
BrambletonBrandt1091270236000010912702360%
UnitsBuiltorPermitted
asof1/1/08
LoudounCounty,Virginia
MajorApprovedResidentialProjects(20+Units),2007
UnitsRemainingtobePermitted
asof1/1/08
Percent
Complete
PlanningSubarea/
ProjectName(1)
TotalApprovedUnits
TableF-7,continued
Page59
- 60. MajorApprovedResidentialProjects(20+Units),2007
LoudounCounty,Virginia
SFDSFAMFTotalSFDSFAMFTotalSFDSFAMFTotal
Dulles,continued
CDSmith153214884550000153214884550%
Dawson'sCorner224002240000224002240%
EastGateOne0193206399000001932063990%
EastGateThree002222220000002222220%
EstatesatElkRun13571020600001357102060%
FrontierSpring36430791310023233305629%
GlascockFieldatStoneRidge0138138276000001381382760%
GrahamFlynn014901490000014901490%
GreeneMillReserve(Woodland
Village)
20221022341140551617016825%
GreenfieldCrossing169101070000169101070%
KimmittProperty5148099000051480990%
KirkpatrickFarms9532482161,417420396081653306860158%
KirkpatrickWest173661343730000173661343730%
LittleRiverCommons(Masira)10360016300001036001630%
Marbury227802350000227802350%
PolandRoadProperty195001951650016530003085%
ProvidenceGlen2059079000020590790%
ReserveatSouthRiding97808700009780870%
RossprioryEstates21002100002100210%
SevenHills6242762121,11200006242762121,1120%
SouthRiding(KatamaWoods)2,4152,3209805,7152,4552,5006375,5920123012398%
SouthRidingStation274346062031003124334605895%
StoneRidge(AmberSpring,Mercer
Park)
8531,2521,1603,2654137542311,3984404989291,86743%
TownesatEastGate57267032400005726703240%
Treburg41004100004100410%
ValleyRunEstates36003600003600360%
Westbrook290029270027200293%
WhiteOakCrest26002600002600260%
Woodburn011901190000011901190%
PlanningSubarea/
ProjectName(1)
TotalApprovedUnits
UnitsBuiltorPermitted
asof1/1/08
UnitsRemainingtobePermitted
asof1/1/08
Percent
Complete
TableF-7,continued
Page60
- 61. SFDSFAMFTotalSFDSFAMFTotalSFDSFAMFTotal
Leesburg1,8741,3615933,8281,12971001,8397034805931,77654%
BeaconHill(remainderinRoute15
North)
215002152050020510001095%
ColtsRun49004910014800482%
EmeraldParksEstates310031290029200294%
EvergreenRuralVillage(3)
28124030558240822230022327%
PMWFarms(FestivalLakes)1401350275000014013502750%
GooseCreekBend360036900927002725%
Grenata58005828002830003048%
KincaidForest,Townsat03803800000380380%
KingdomFarm59005900005900590%
LakeHill48004800004800480%
Oaklawn032603260630630263026319%
RedCedar28136031719634023085208773%
RiverCreek(6)
59076001,35052758901,11621002198%
RokebyHamlet(3)
86008676007610001088%
VillageatLeesburg04259363500000425936350%
84776092336614038047862054041%
DaleProperty22002200002200220%
Dutchman'sCreekHamlet73007325002548004834%
Ecovillage56005613001343004323%
KeenaProperty19802700001980270%
KingsridgeEstates80008054005426002668%
LovesttsvilleRetirementVillage1268080014014125406618%
LovettsvilleTownCenter20300203160016187001878%
NewTownMeadows153001531350013518001888%
PotomacPoint(6)
32003214001415001553%
Saratoga56005611001145004520%
SchoeneProperty29002900002900290%
StonebrookFarmsHamlet280028260026200293%
WaterfieldHamlet200020180018200290%
MajorApprovedResidentialProjects(20+Units),2007
Percent
Complete
PlanningSubarea/
ProjectName(1)
TotalApprovedUnits
UnitsBuiltorPermitted
asof1/1/08
UnitsRemainingtobePermitted
asof1/1/08
Northwest
TableF-7,continued
LoudounCounty,Virginia
Page61
- 62. SFDSFAMFTotalSFDSFAMFTotalSFDSFAMFTotal
WaterfordViewEstates64006454005410001084%
3,0762,2301,5106,8162,6422,2991,4856,42687254099%
Cascades(7)
3,0242,0401,5106,5742,5982,1161,4856,199002525100%
Westerley(Route7Partners)5219002424418302278701594%
Rt.15North9313309644362404604959050448%
BeaconHill
(remainderinLeesburg)
380038290029900976%
ChurchillDowns330033290029400488%
ElysianHeights301330334822401062199022832%
HistoricSelmaEstates176001761900191570015711%
Lee'sCrossing63006325002538003840%
RaspberryFalls(Moorlands,Plains
ofRaspberry)
205002051550015550005076%
WaterfordRidge1150011597009718001884%
Rt.15South5152605411245012938921041024%
ChudleighFarm320032500527002716%
CourtlandFarm(CourtlandRural
Village)
26326028989509417421019533%
EstatesatCreightonFarms(Barclay
Ridge)
197001972600261710017113%
LittleRiverFarms(6)
230023400417001726%
Rt.7West2,40960703,0161,43511501,55096749201,45952%
AutumnHill049204920000049204920%
CreeksideatRoundHill95009500009500950%
FarmingtonontheGreen70007012001258005817%
HamiltonRidge(FawnMeadow,
SaddleRidge)
63006336003627002757%
Northwest,continued
Potomac
TotalApprovedUnits
UnitsBuiltorPermitted
asof1/1/08
UnitsRemainingtobePermitted
asof1/1/08
Percent
Complete
PlanningSubarea/
ProjectName(1)
MajorApprovedResidentialProjects(20+Units),2007
LoudounCounty,Virginia
TableF-7,continued
Page62