Downloaded 186 times
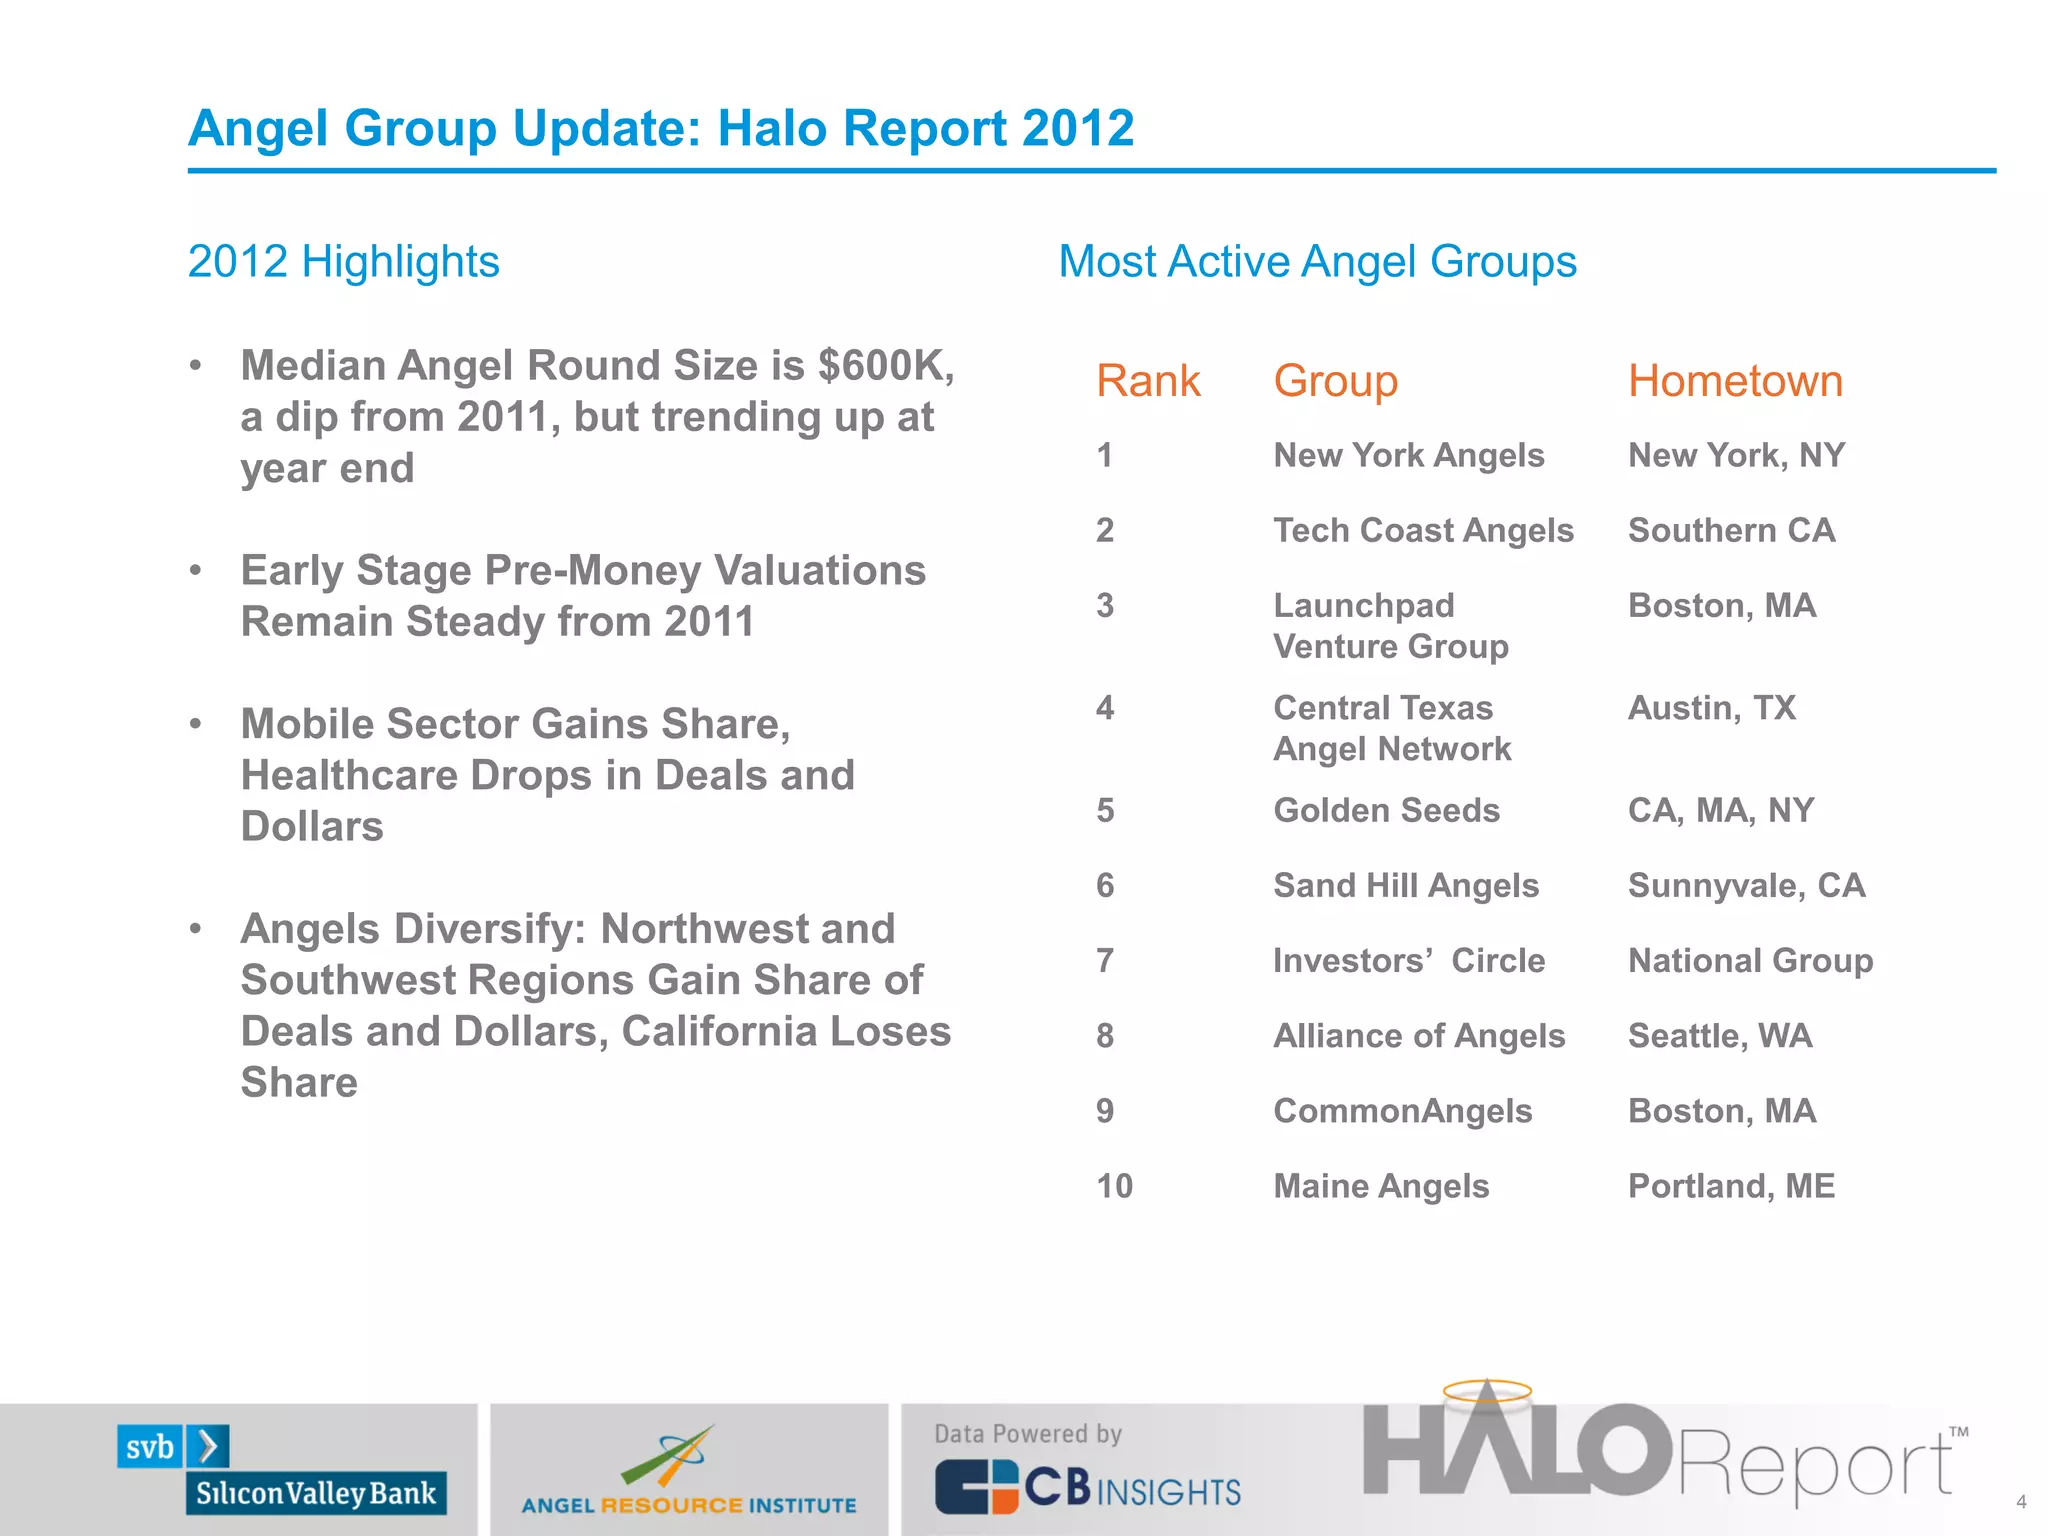

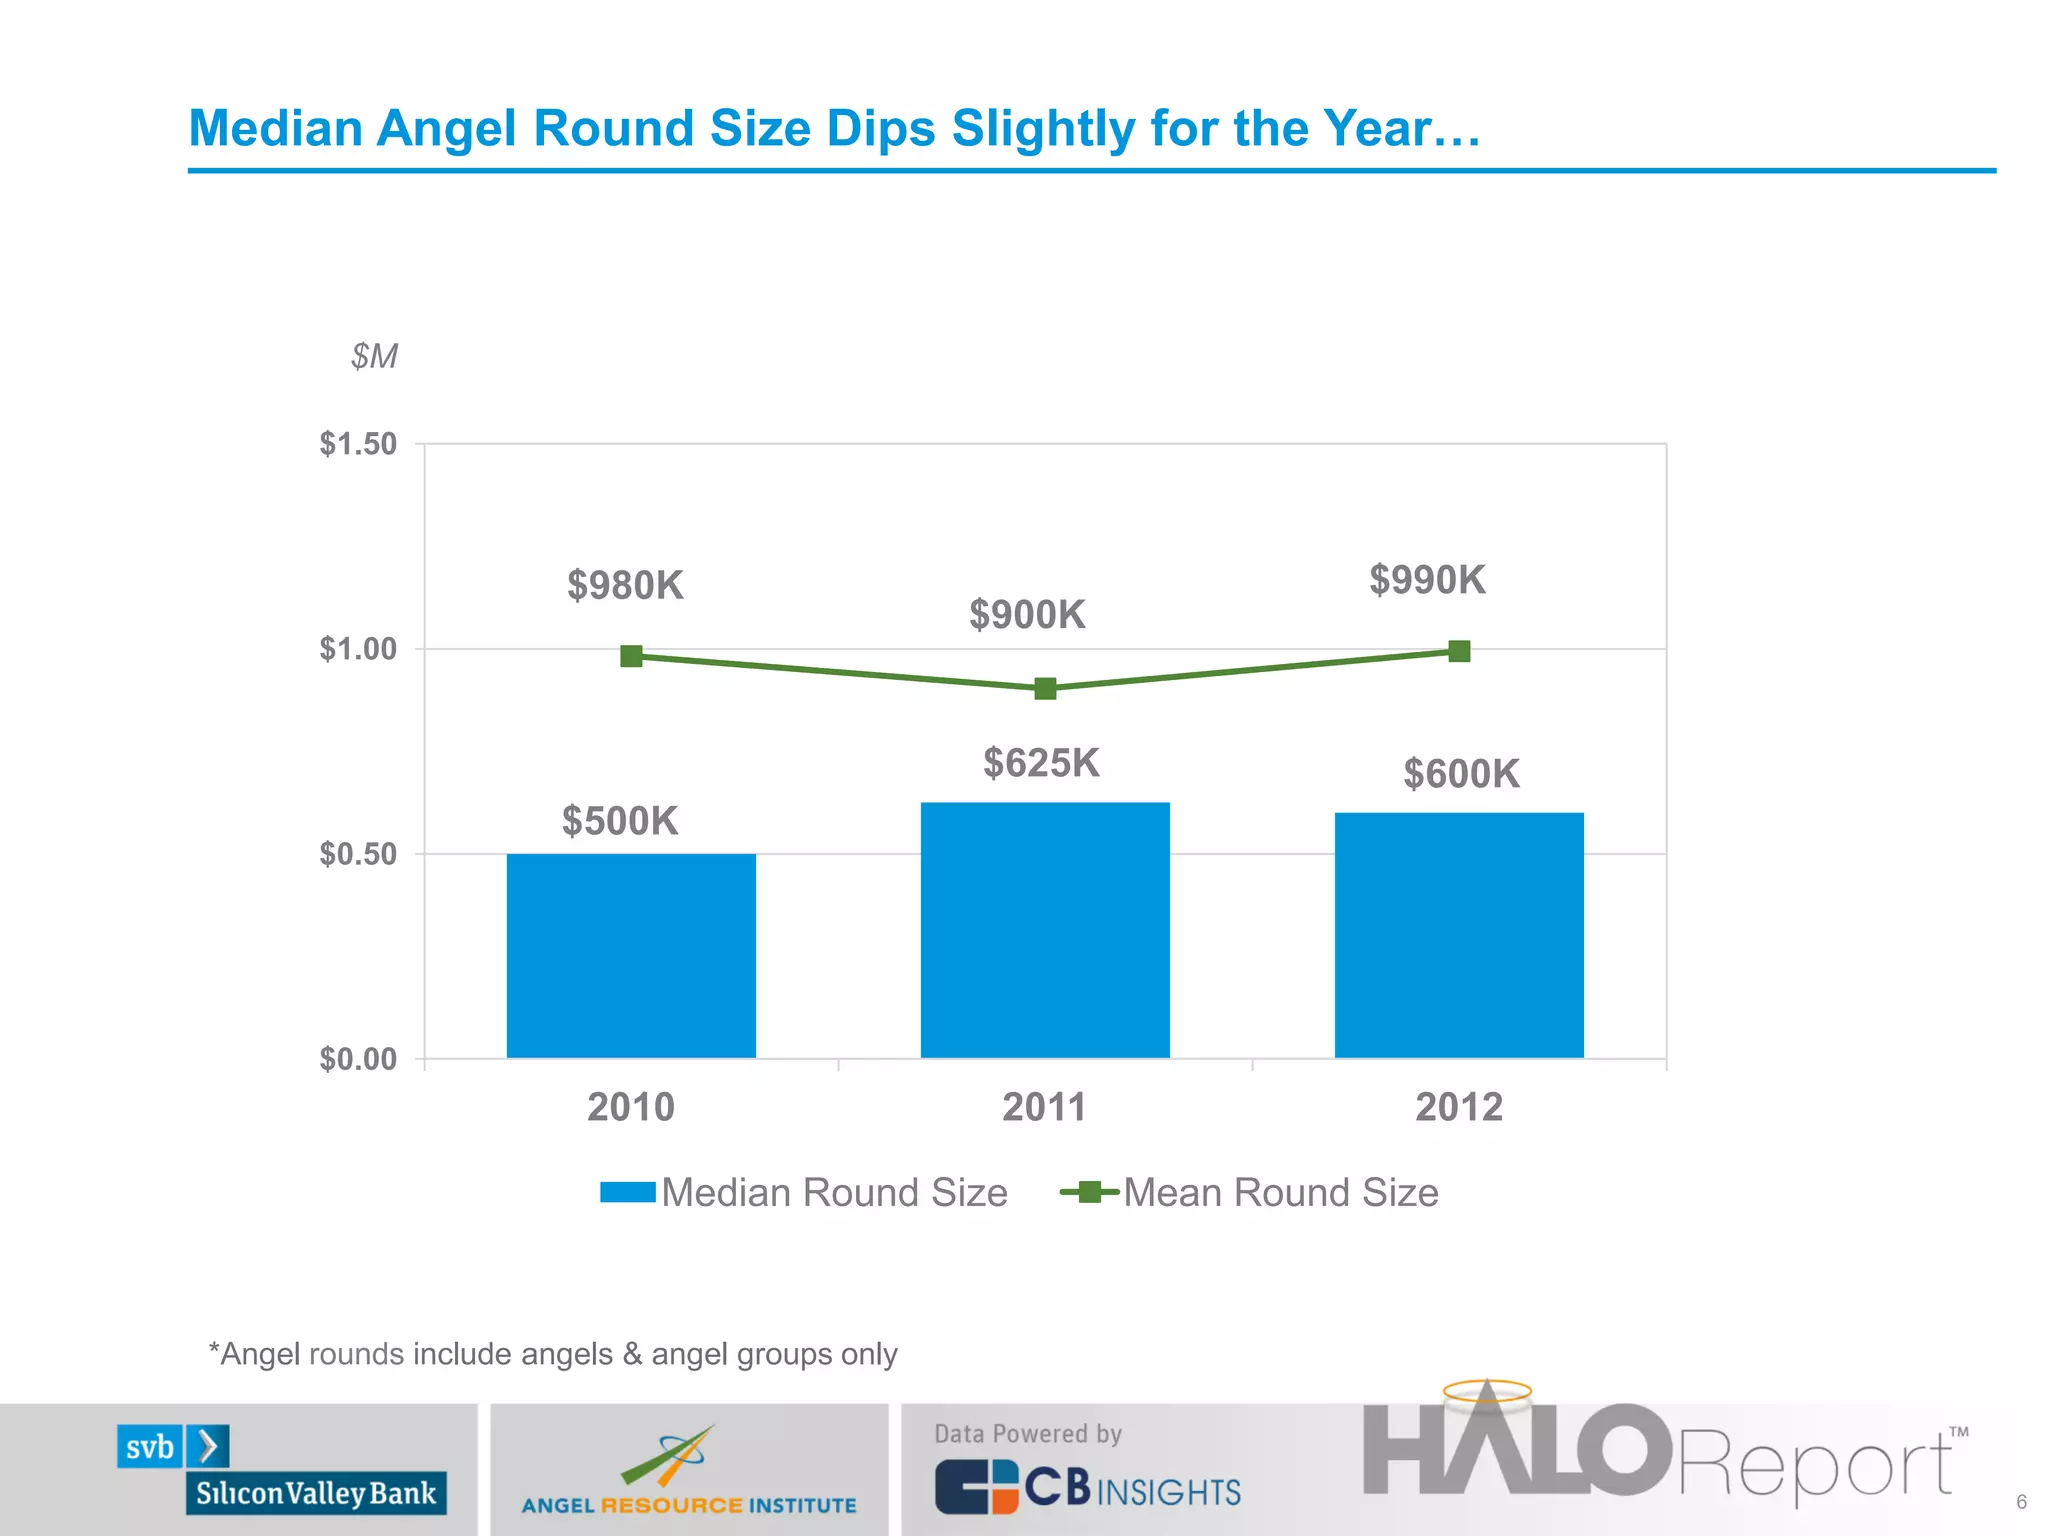
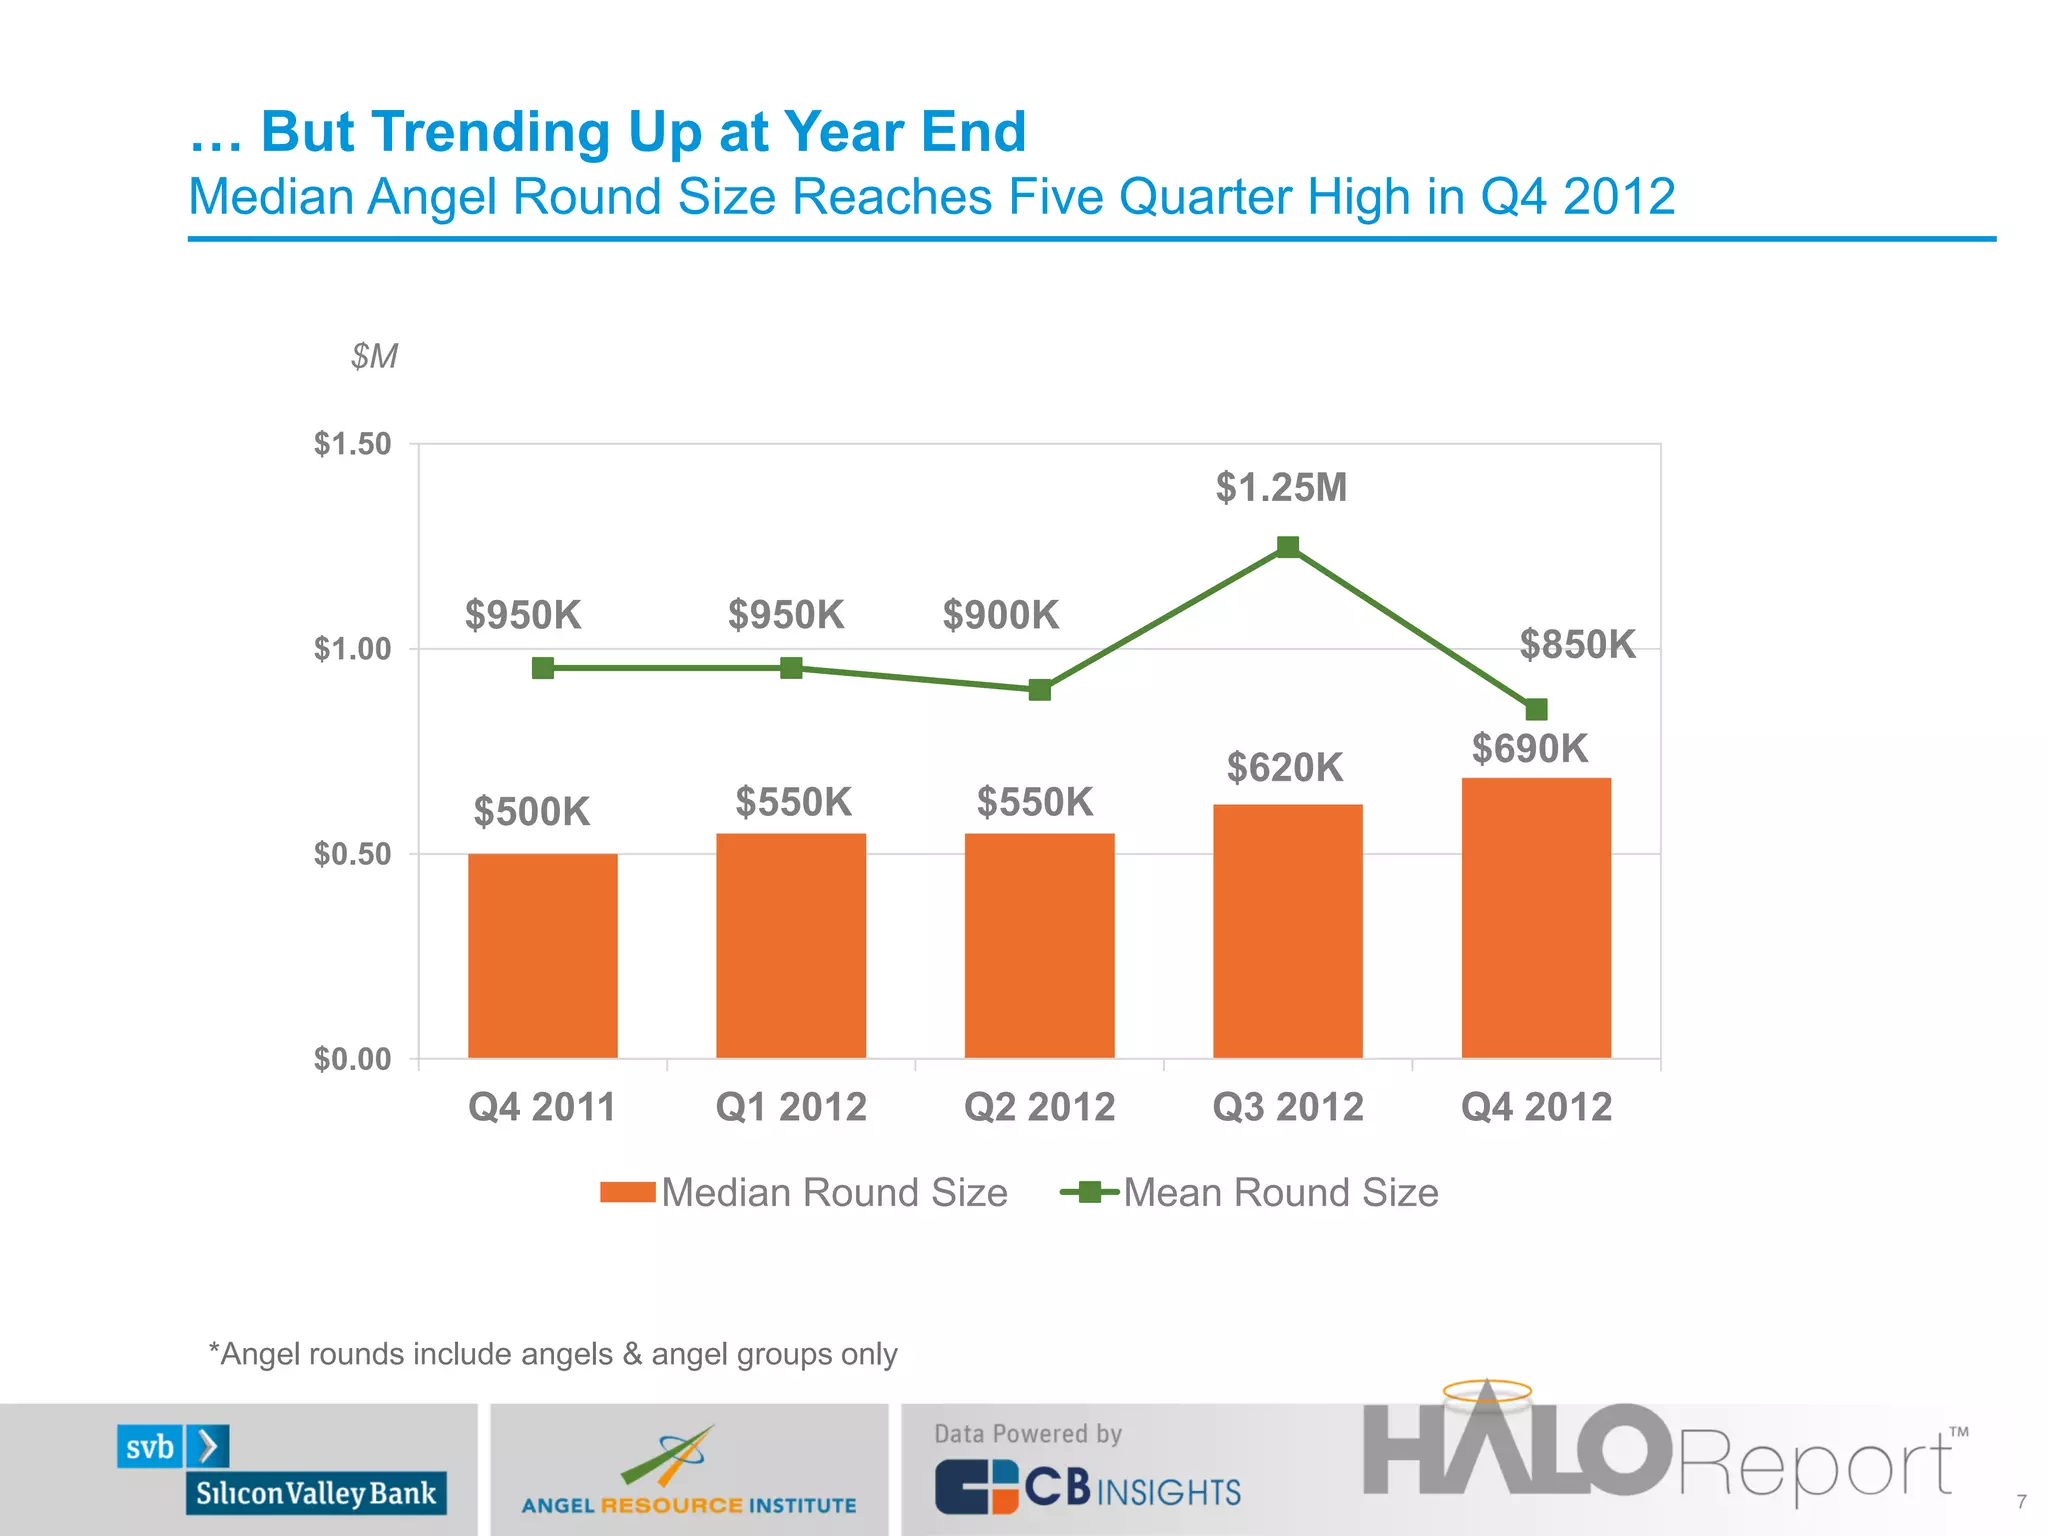
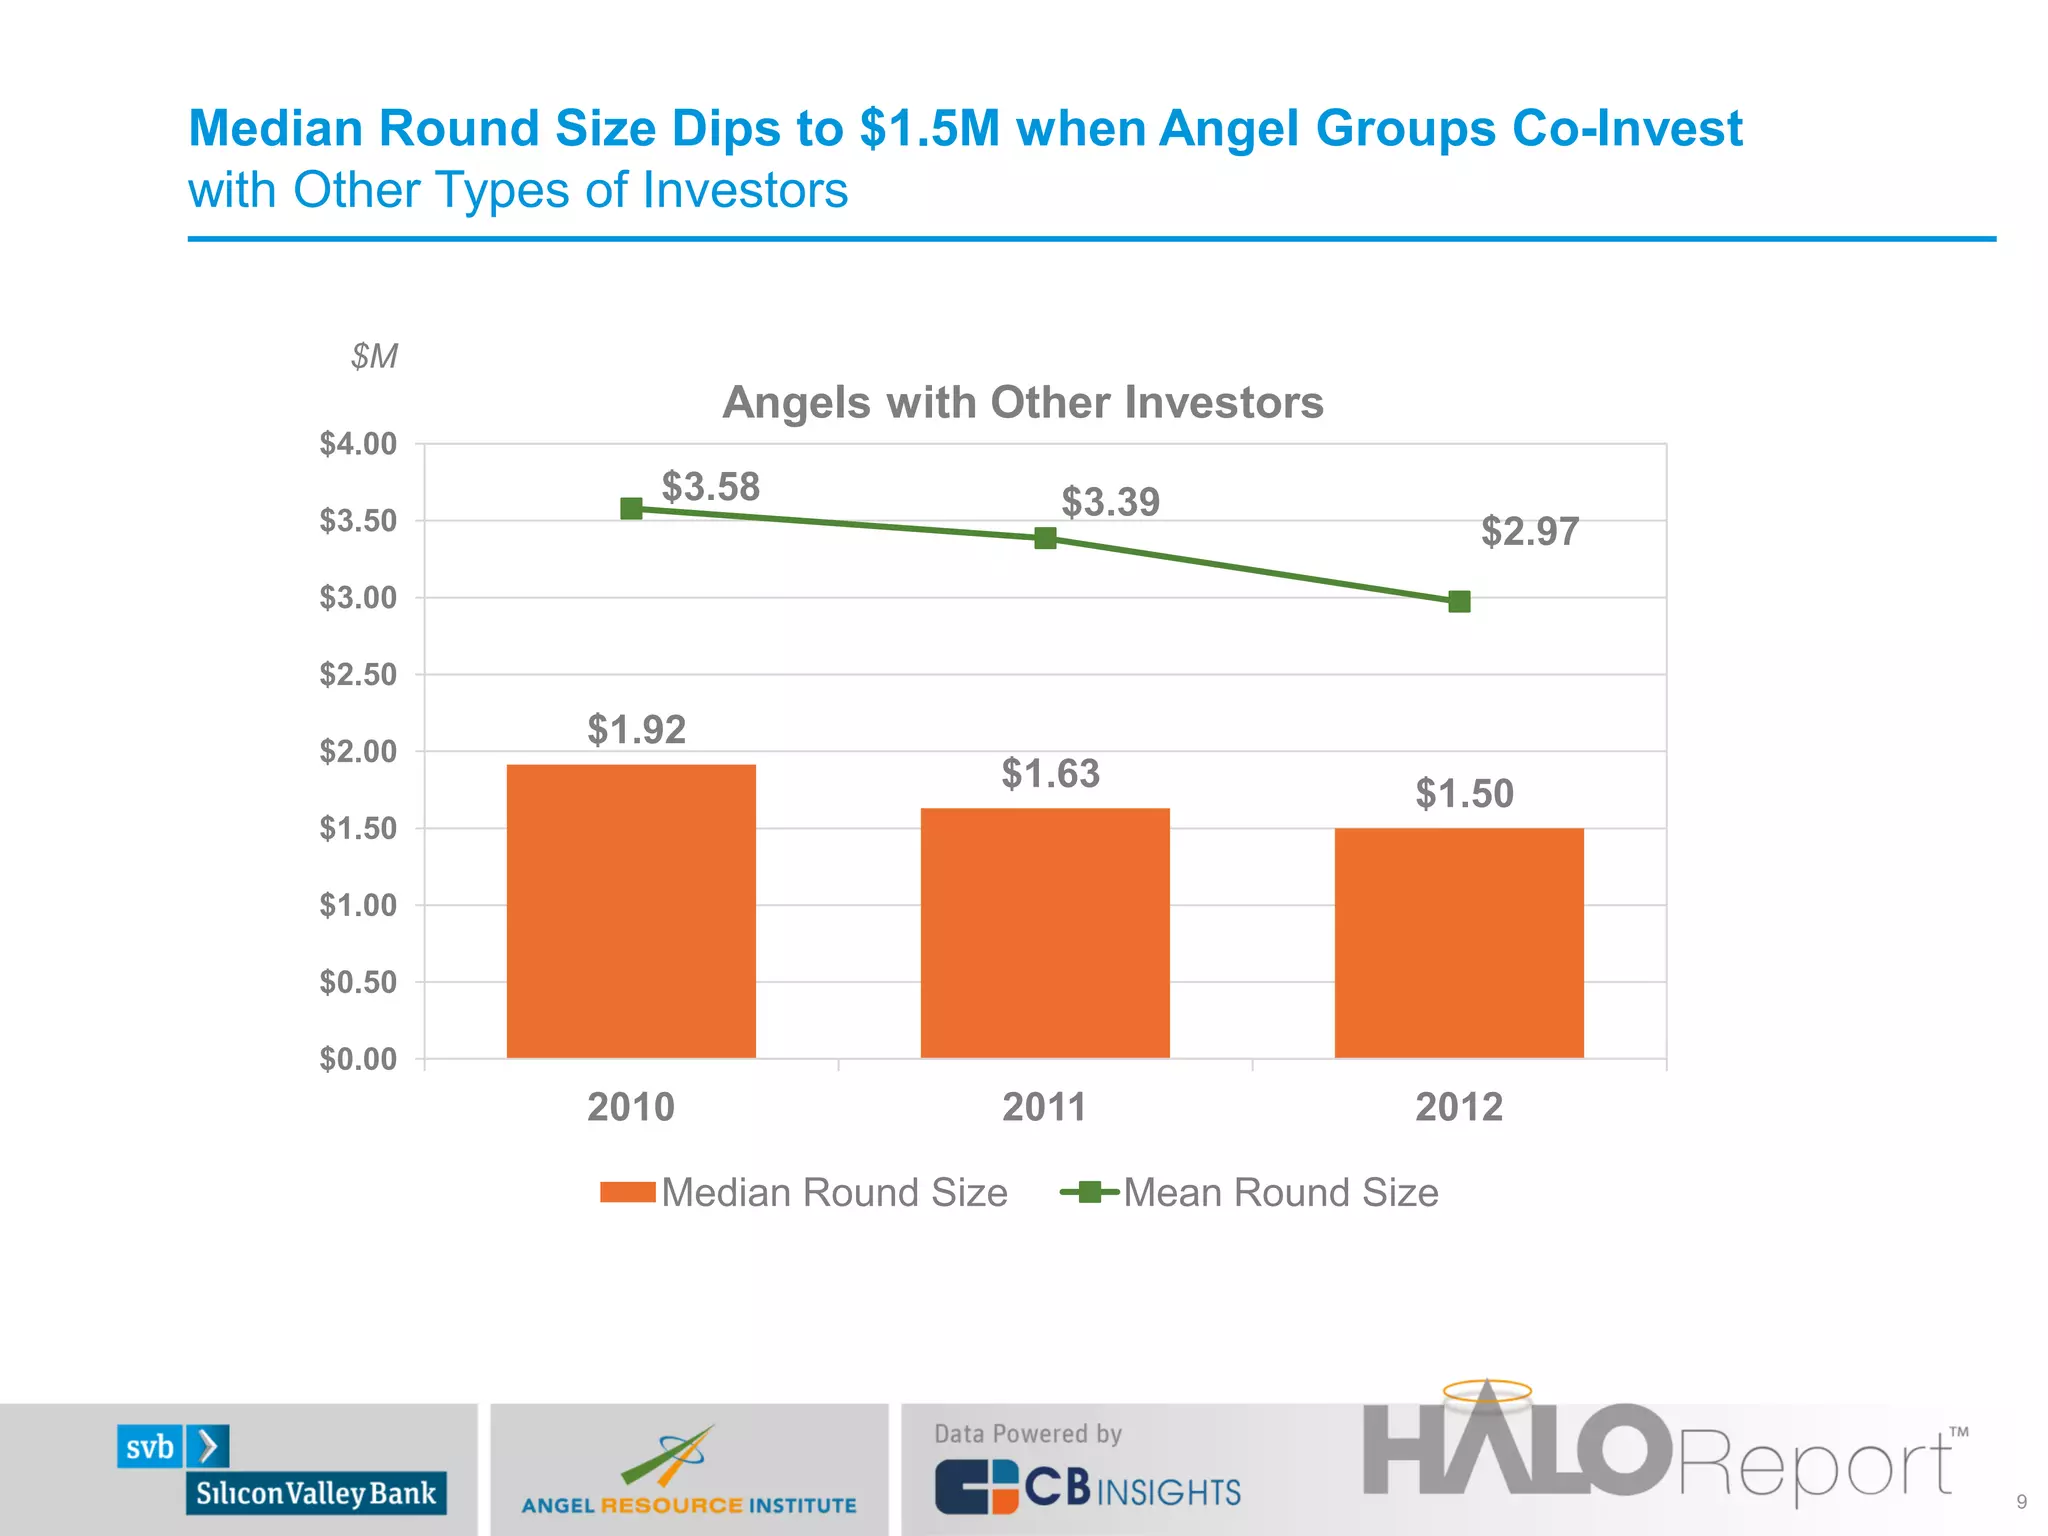
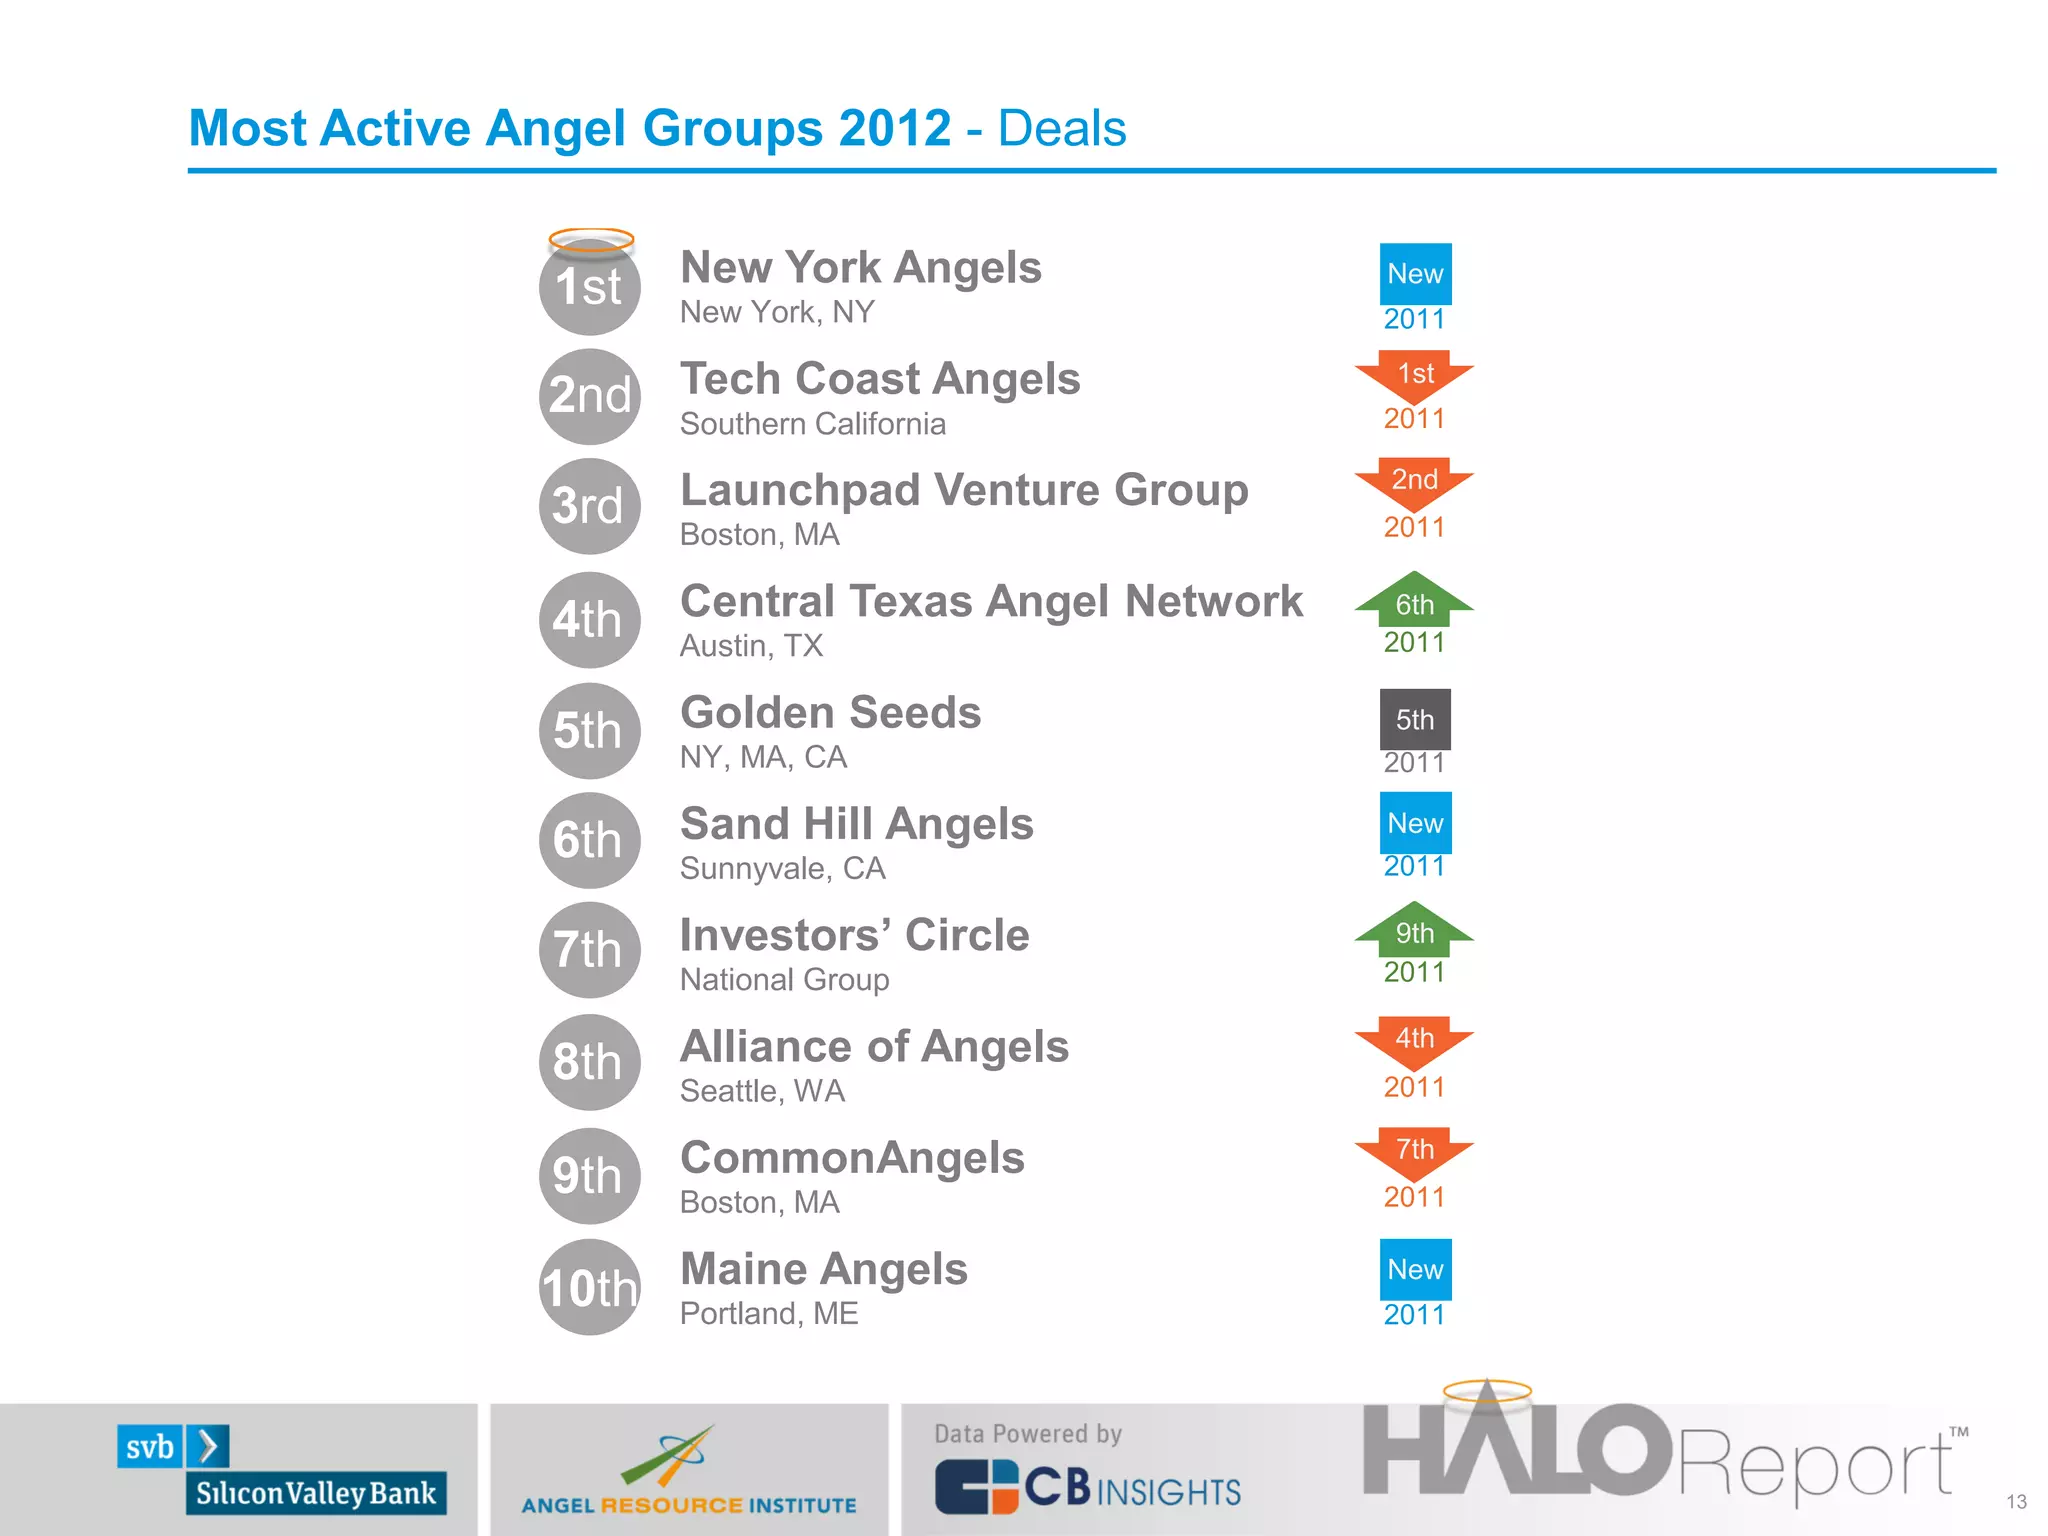
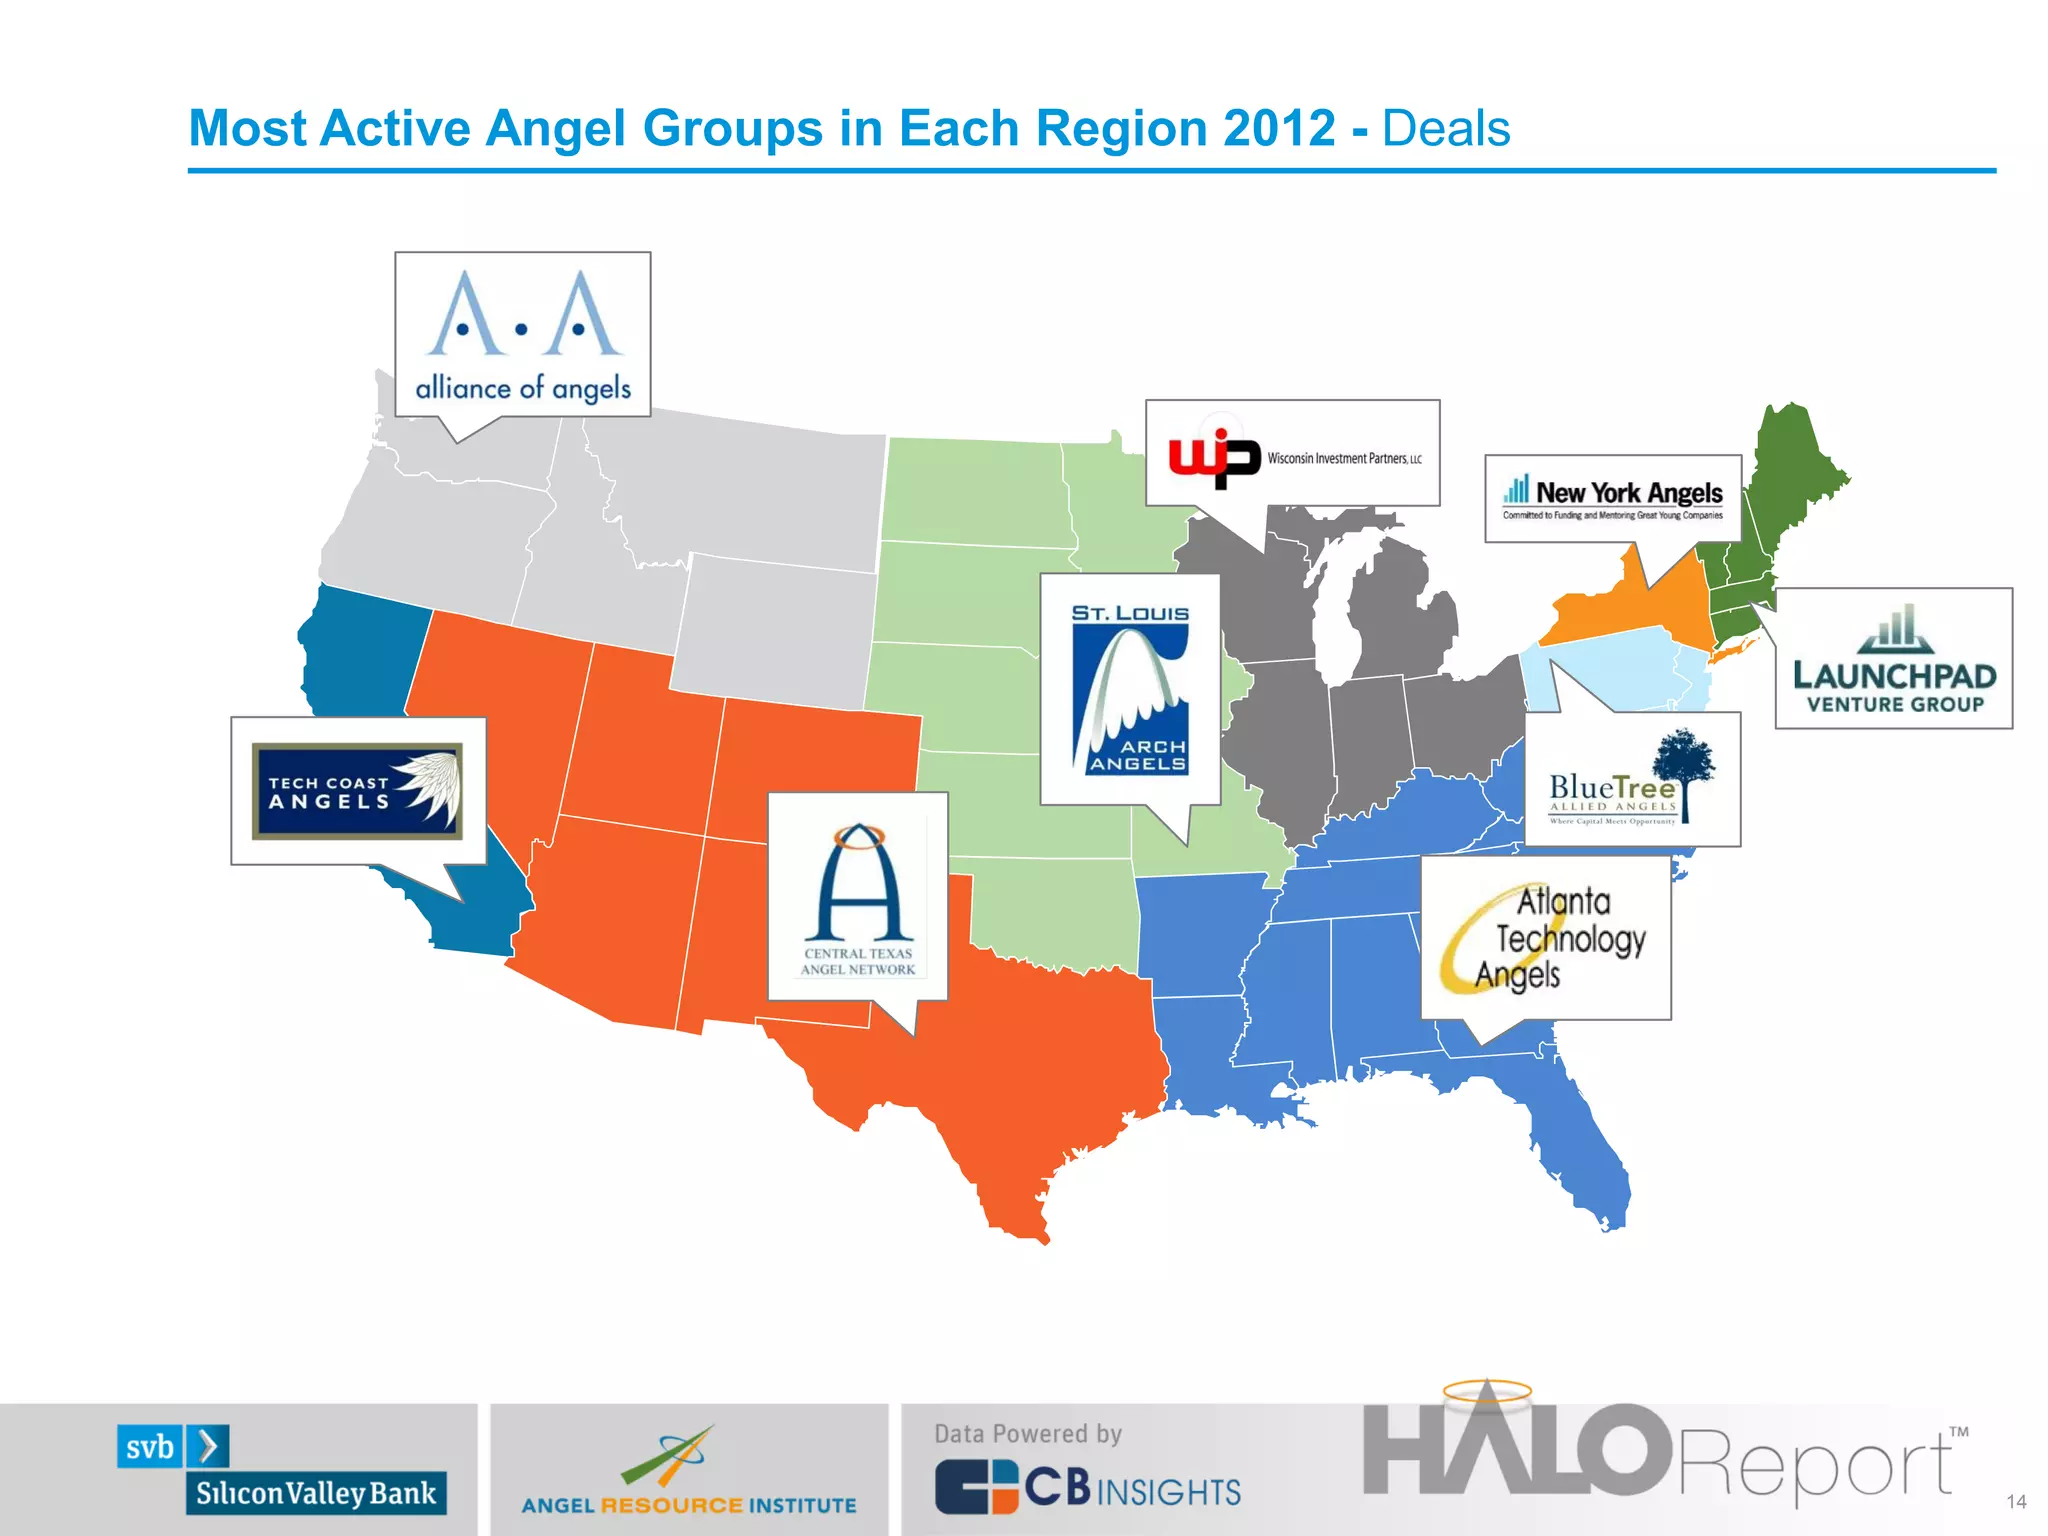

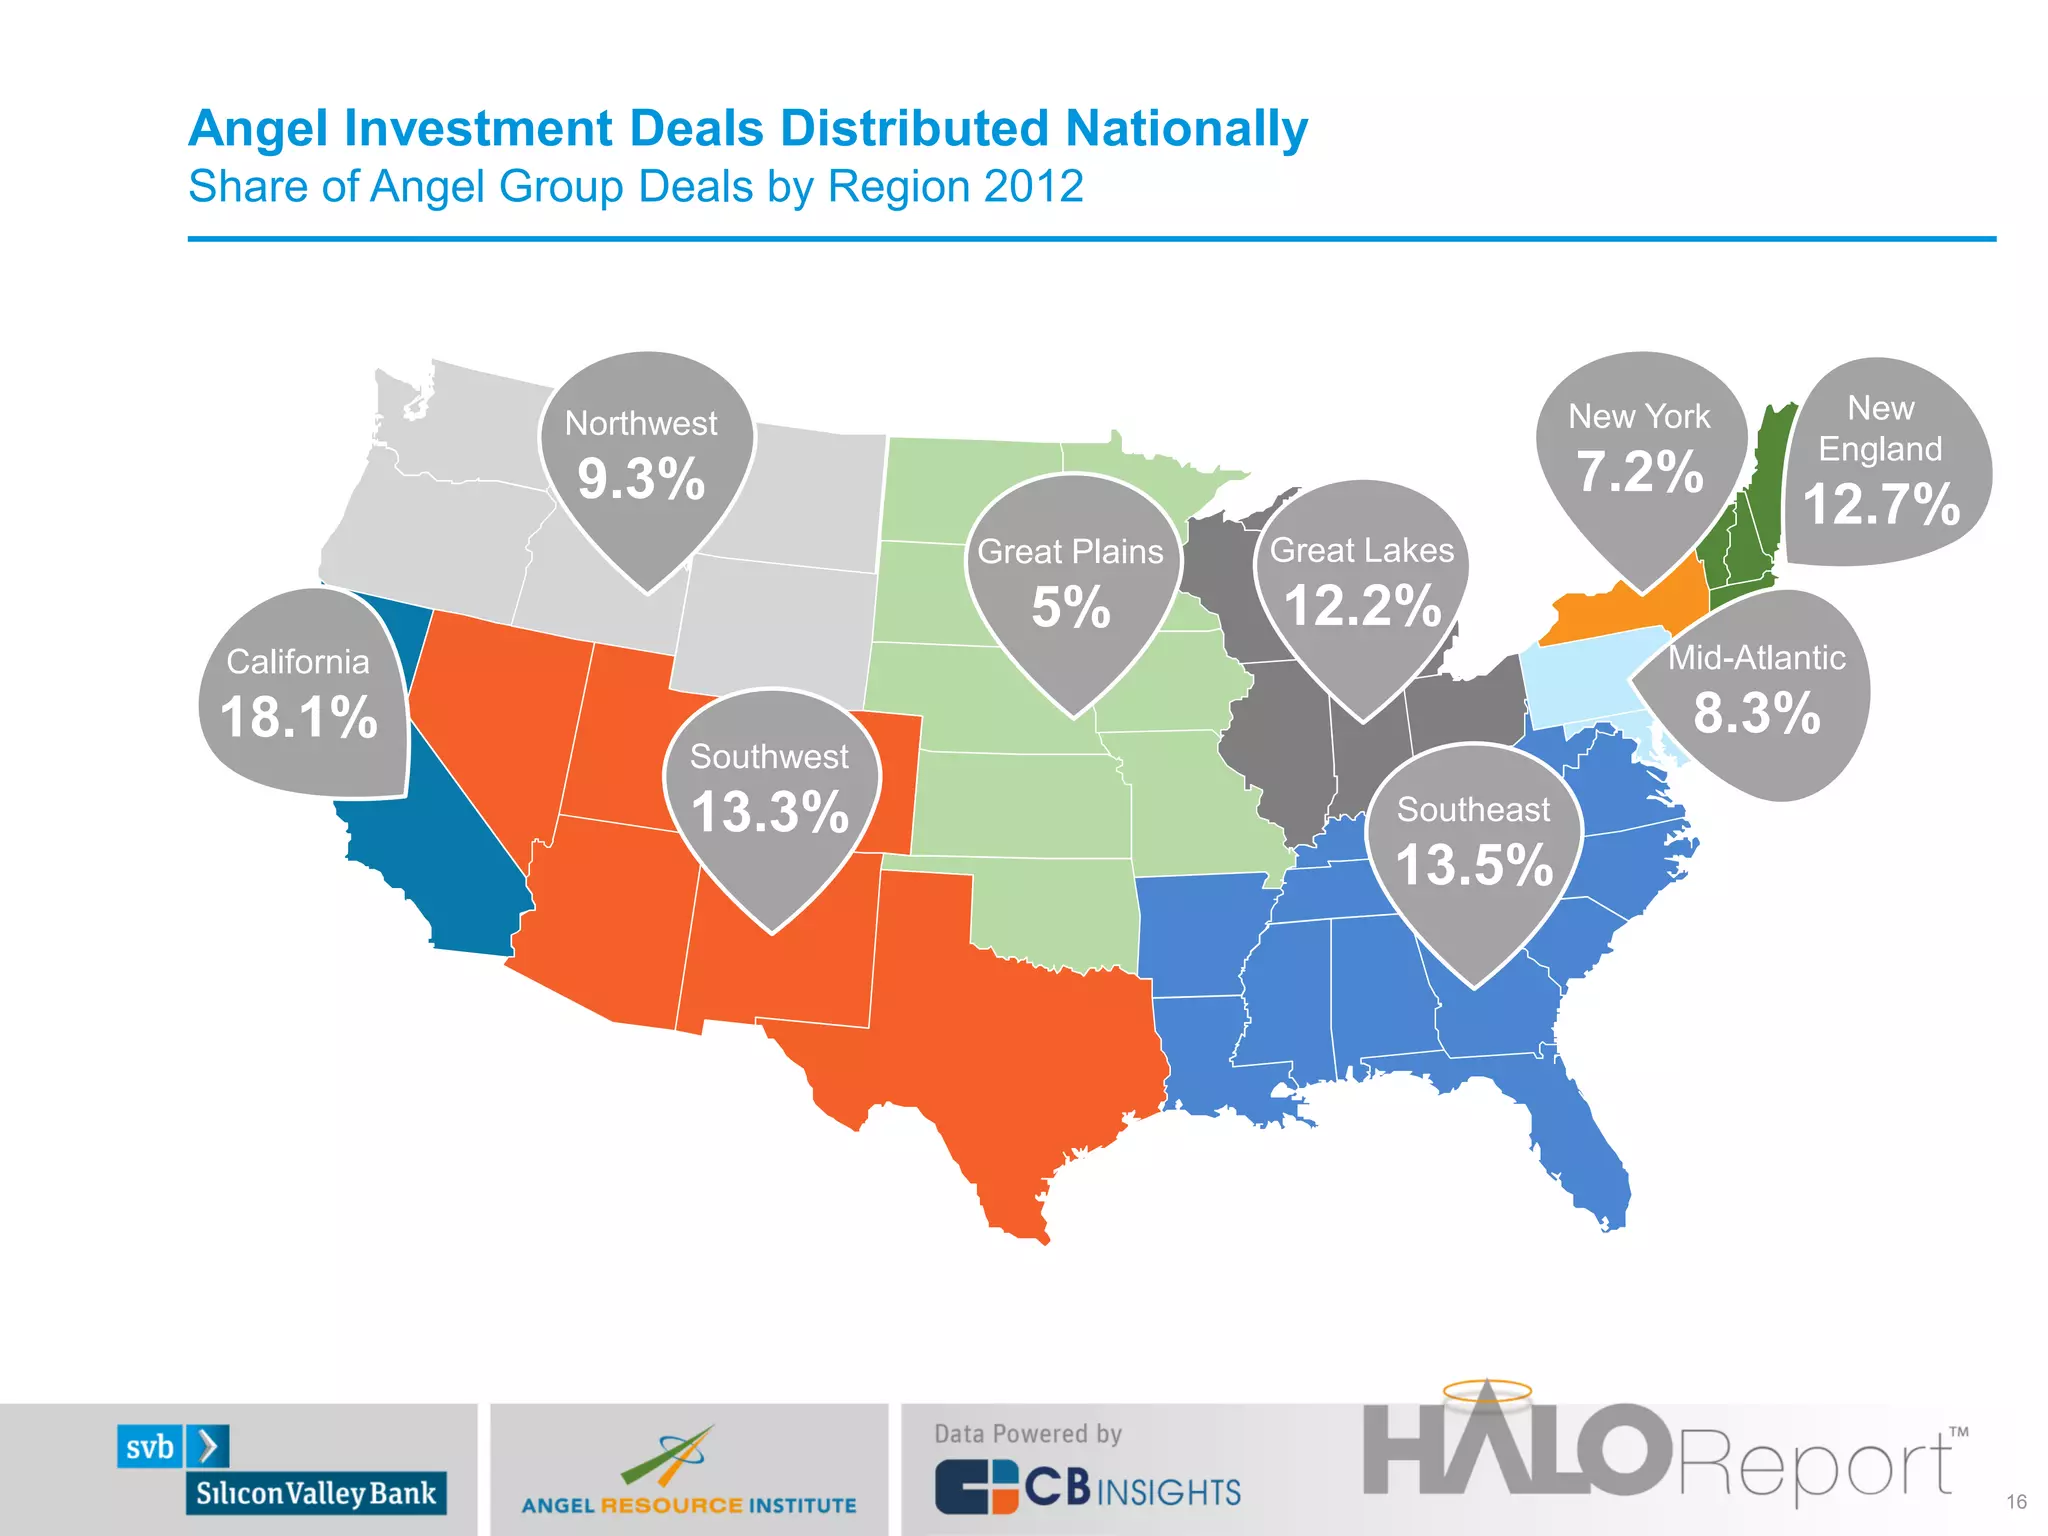
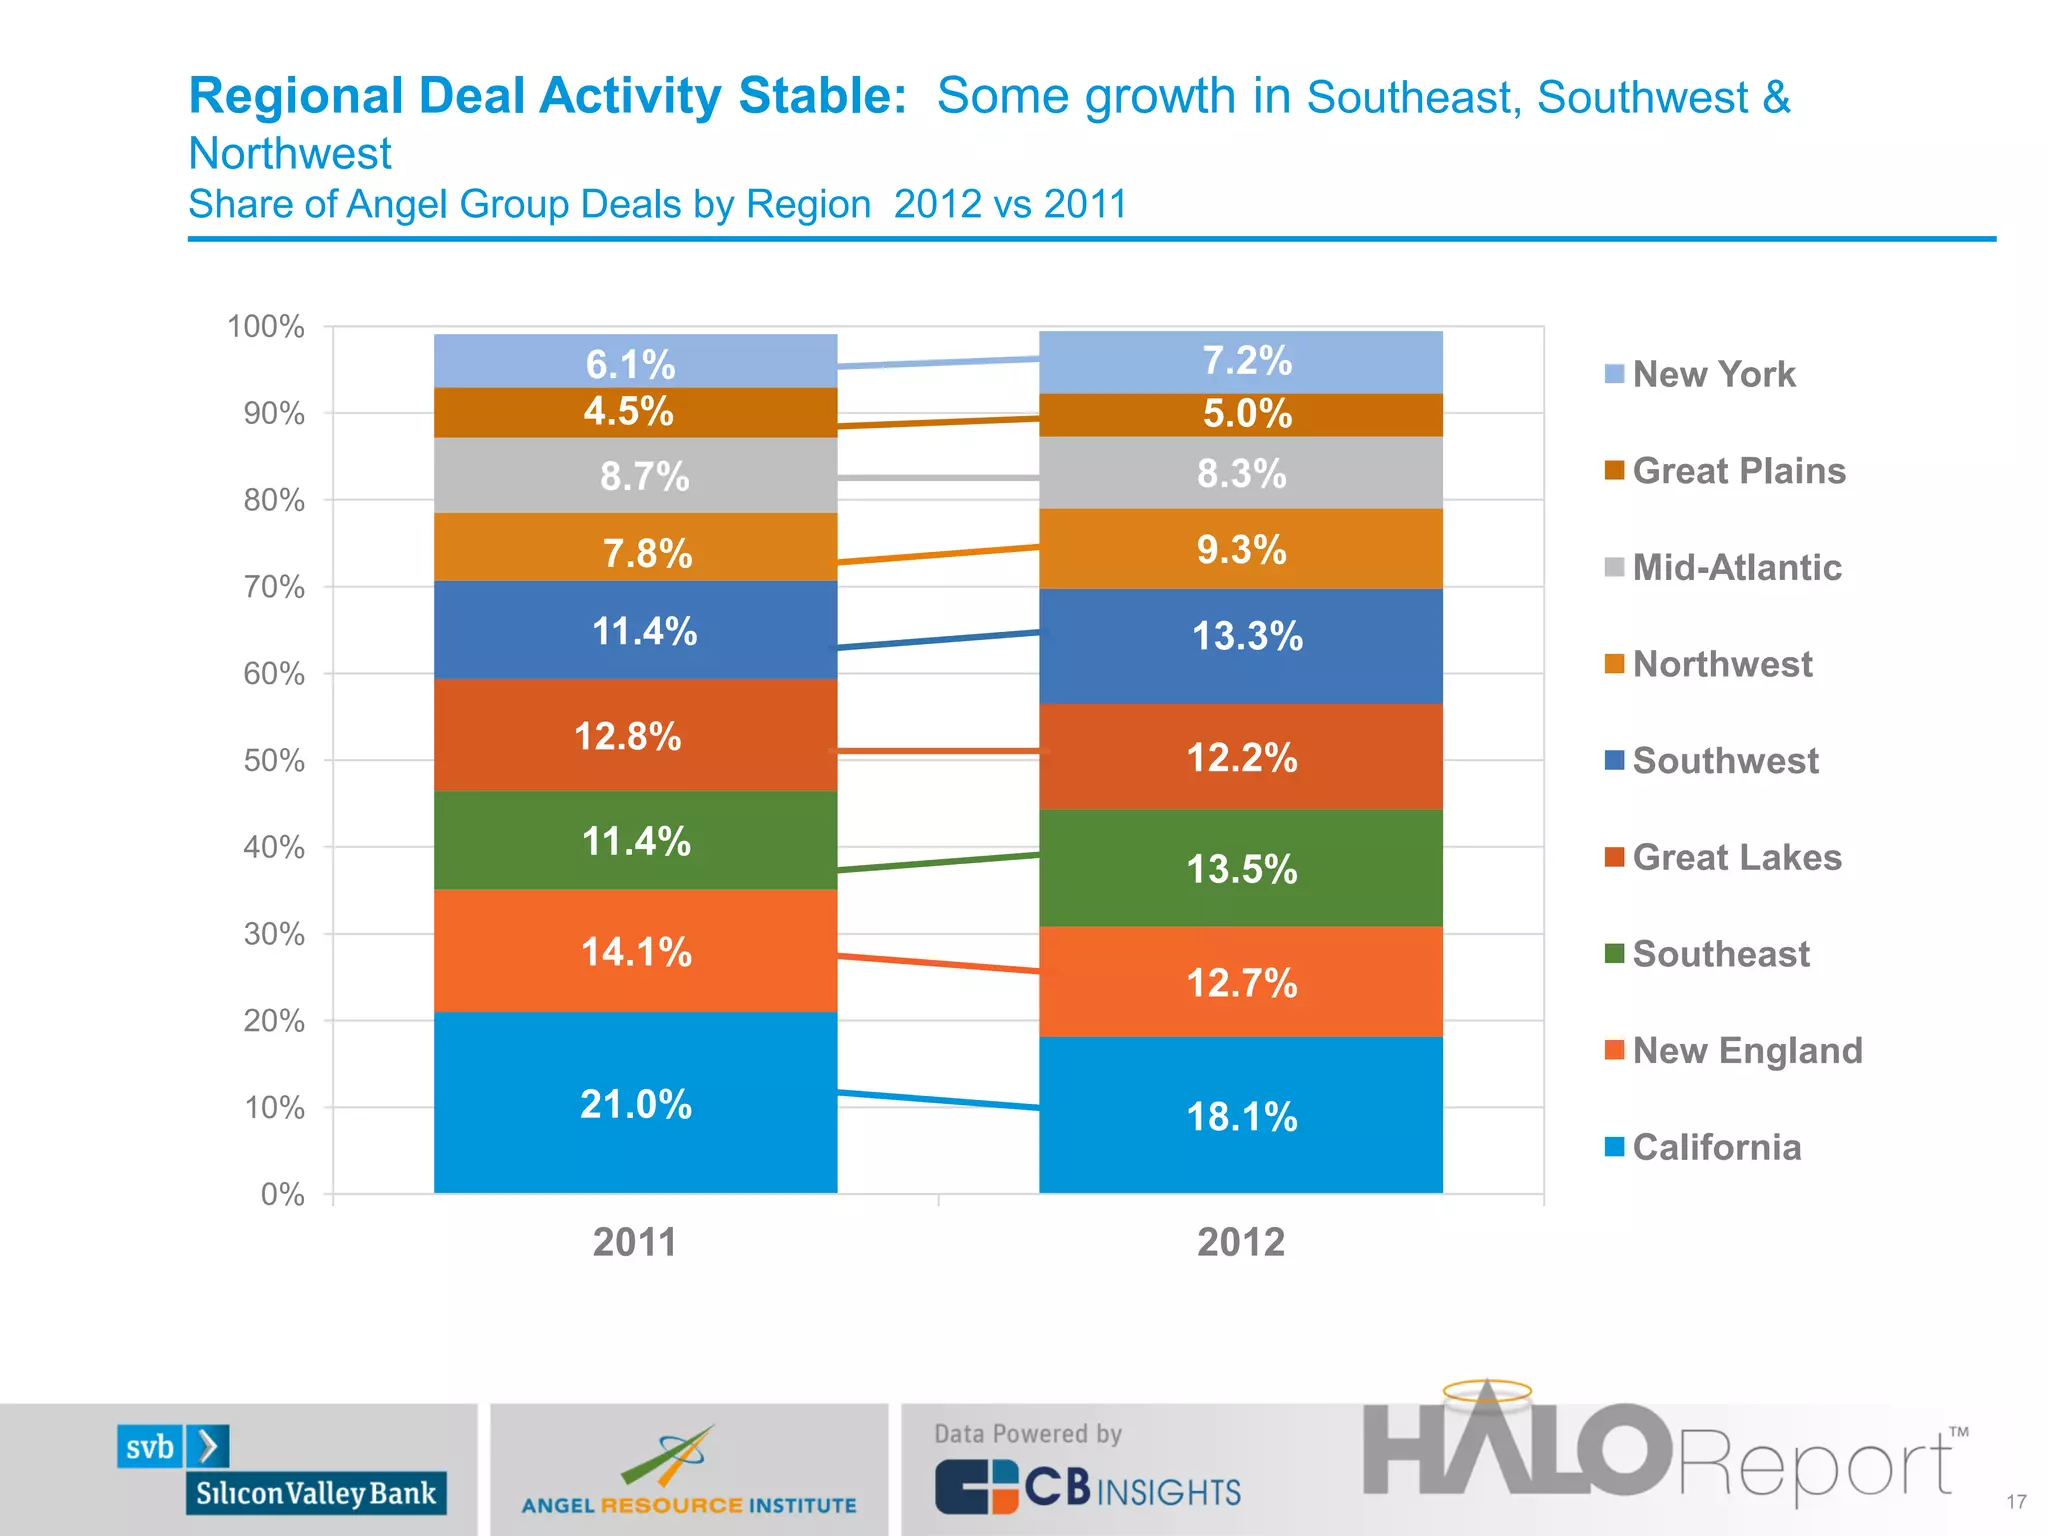
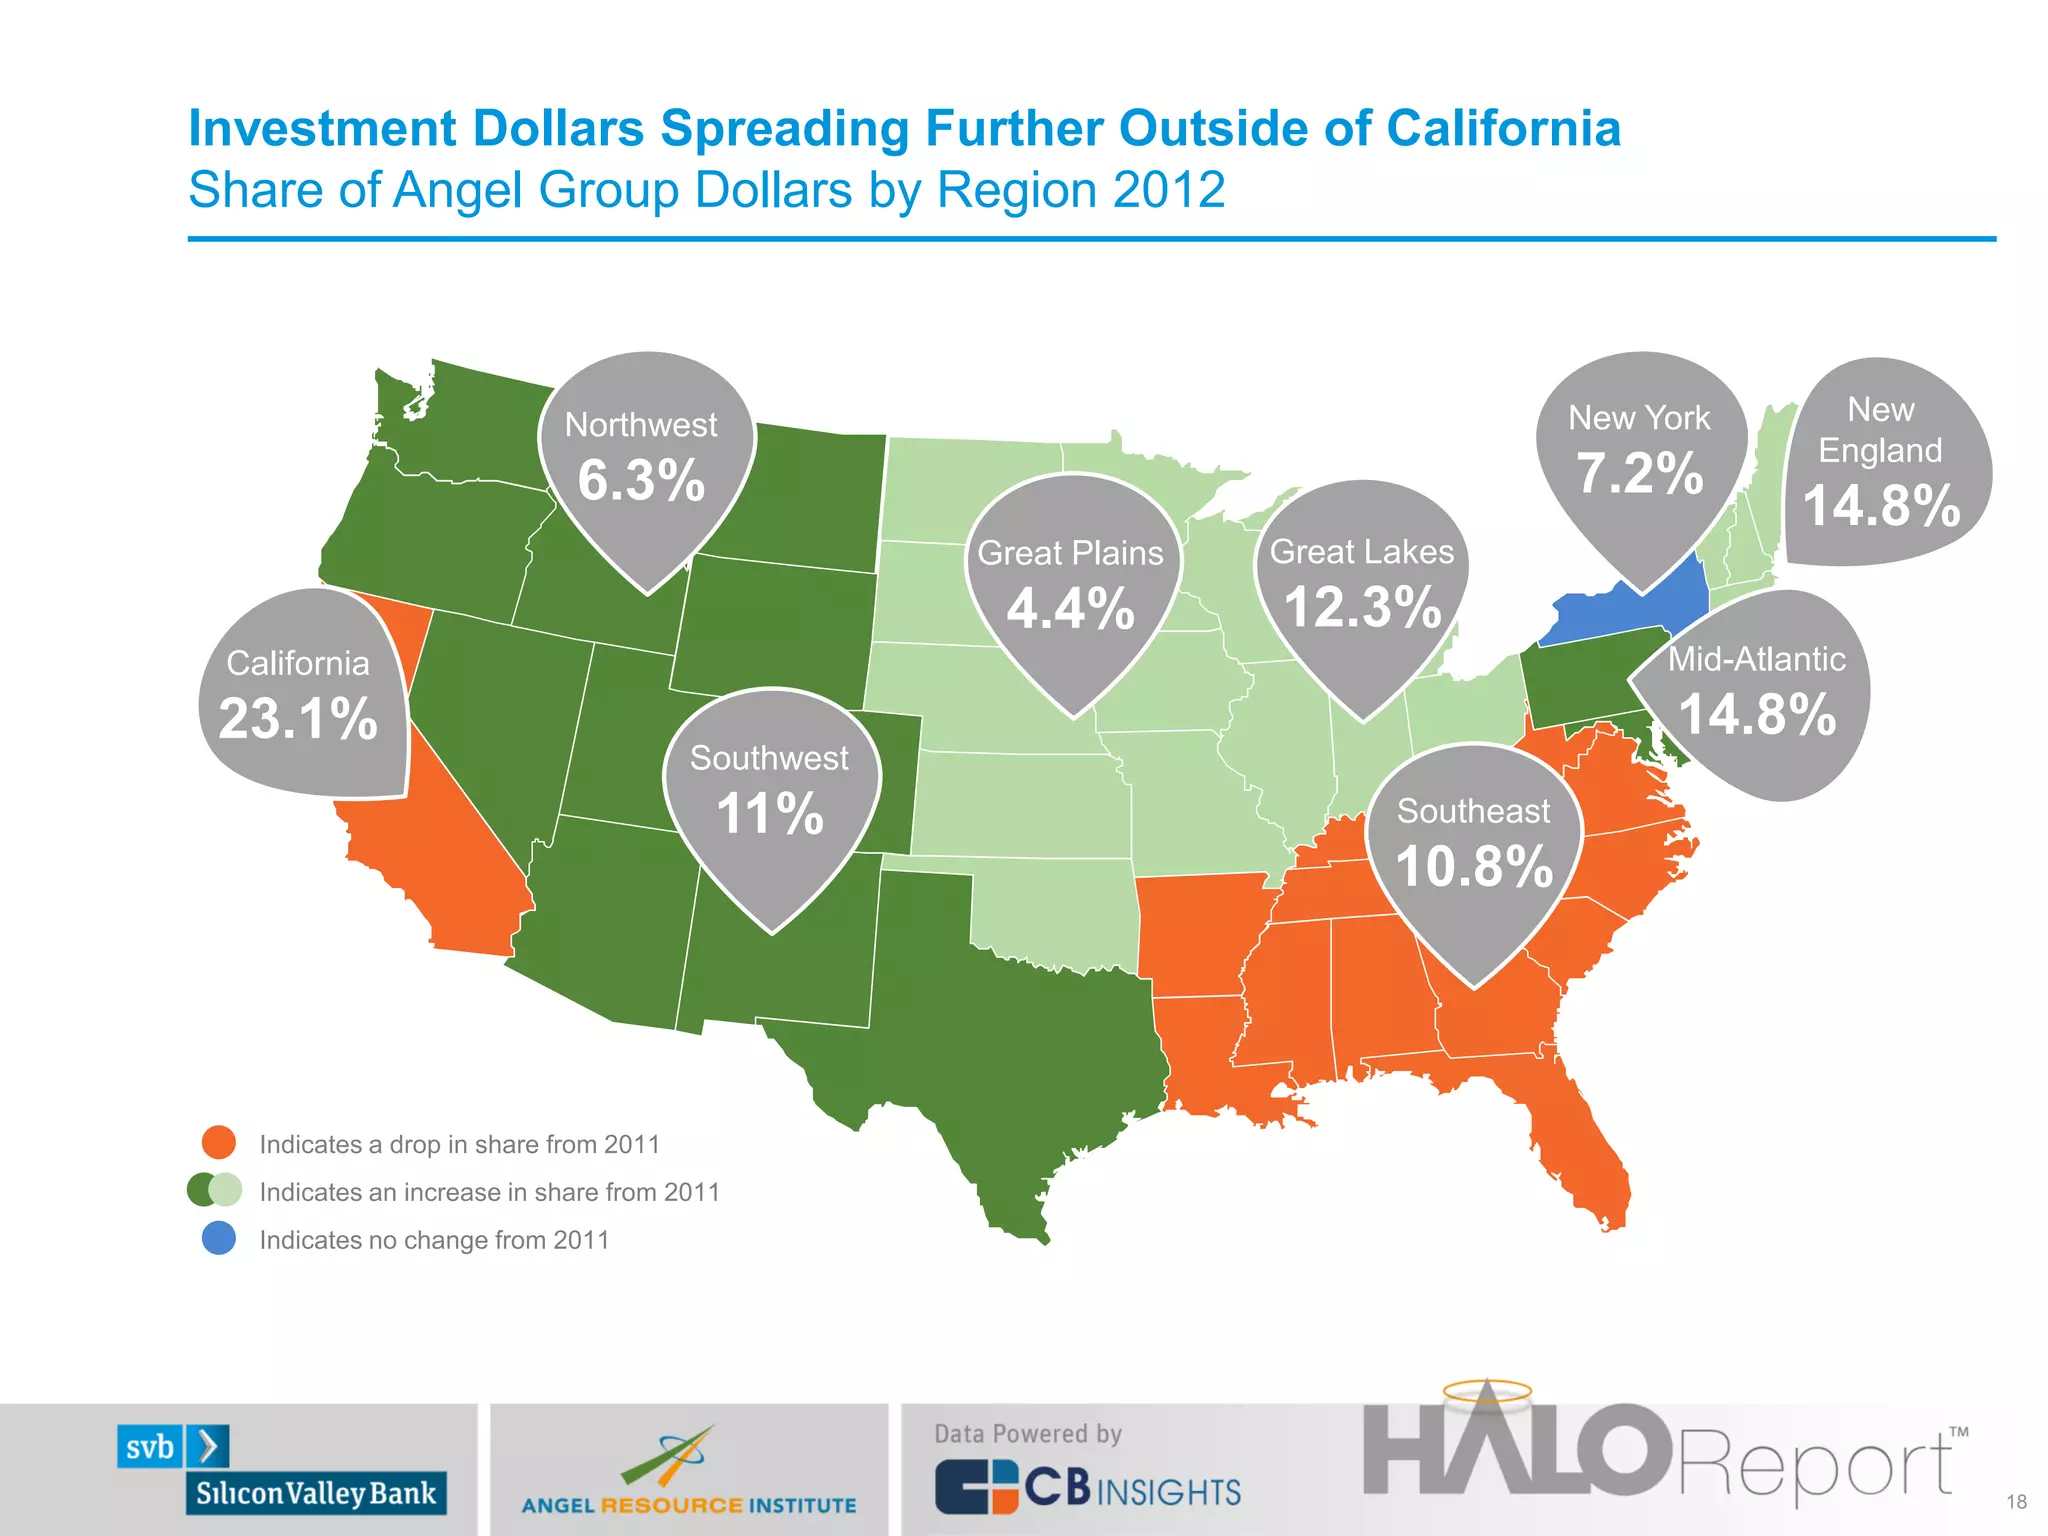
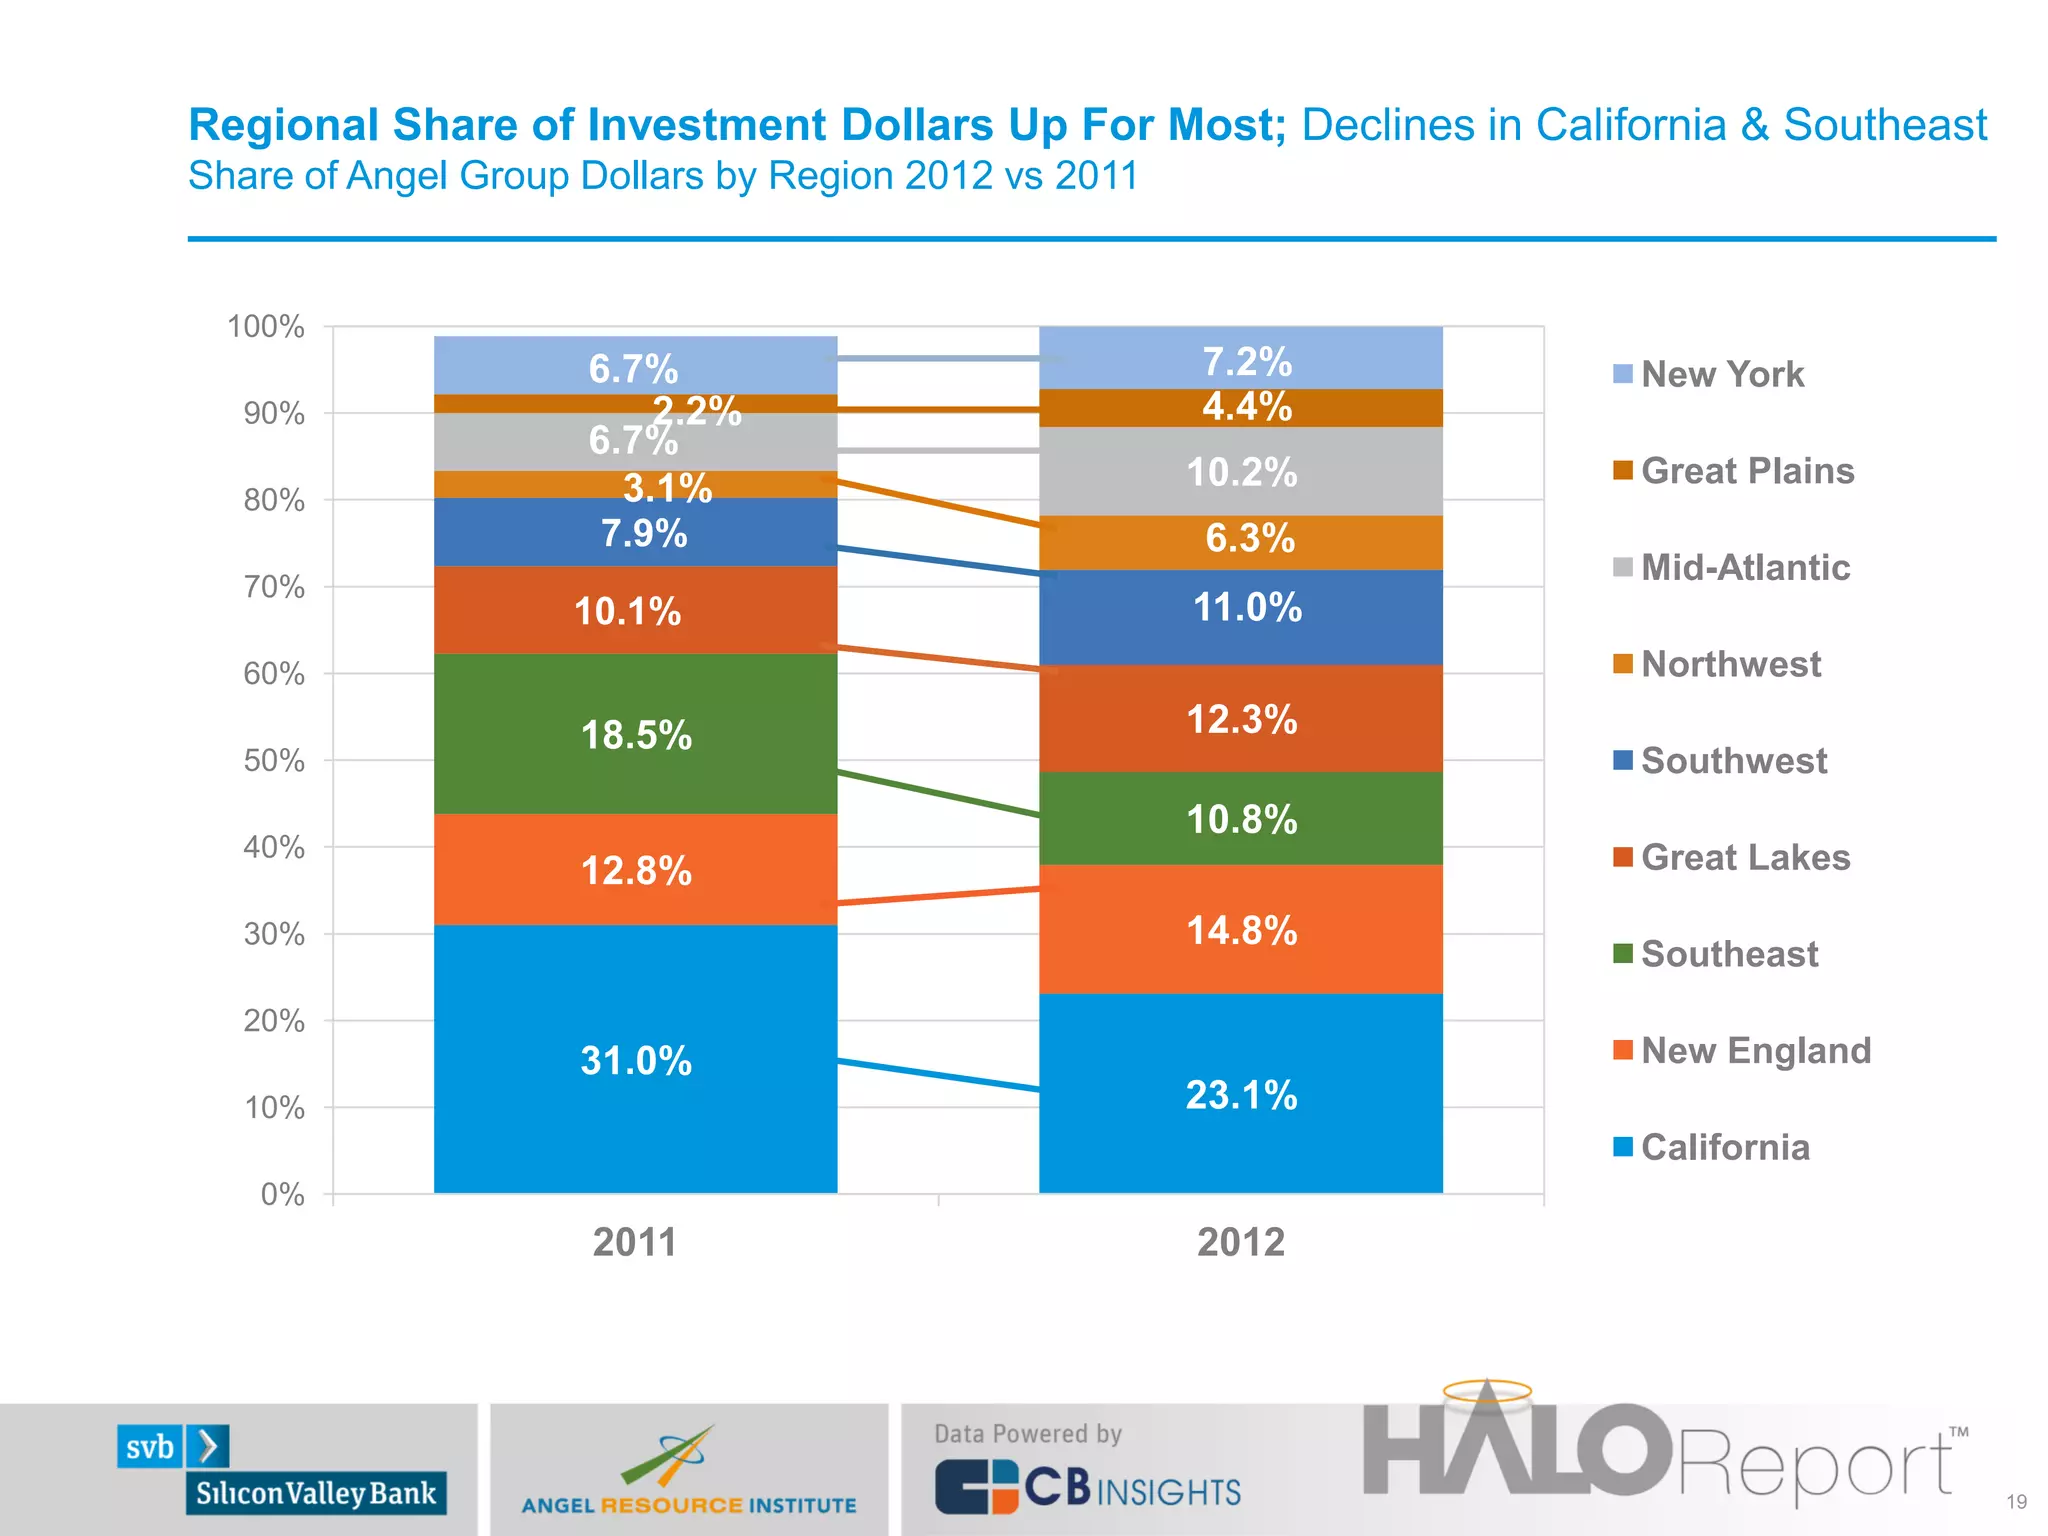

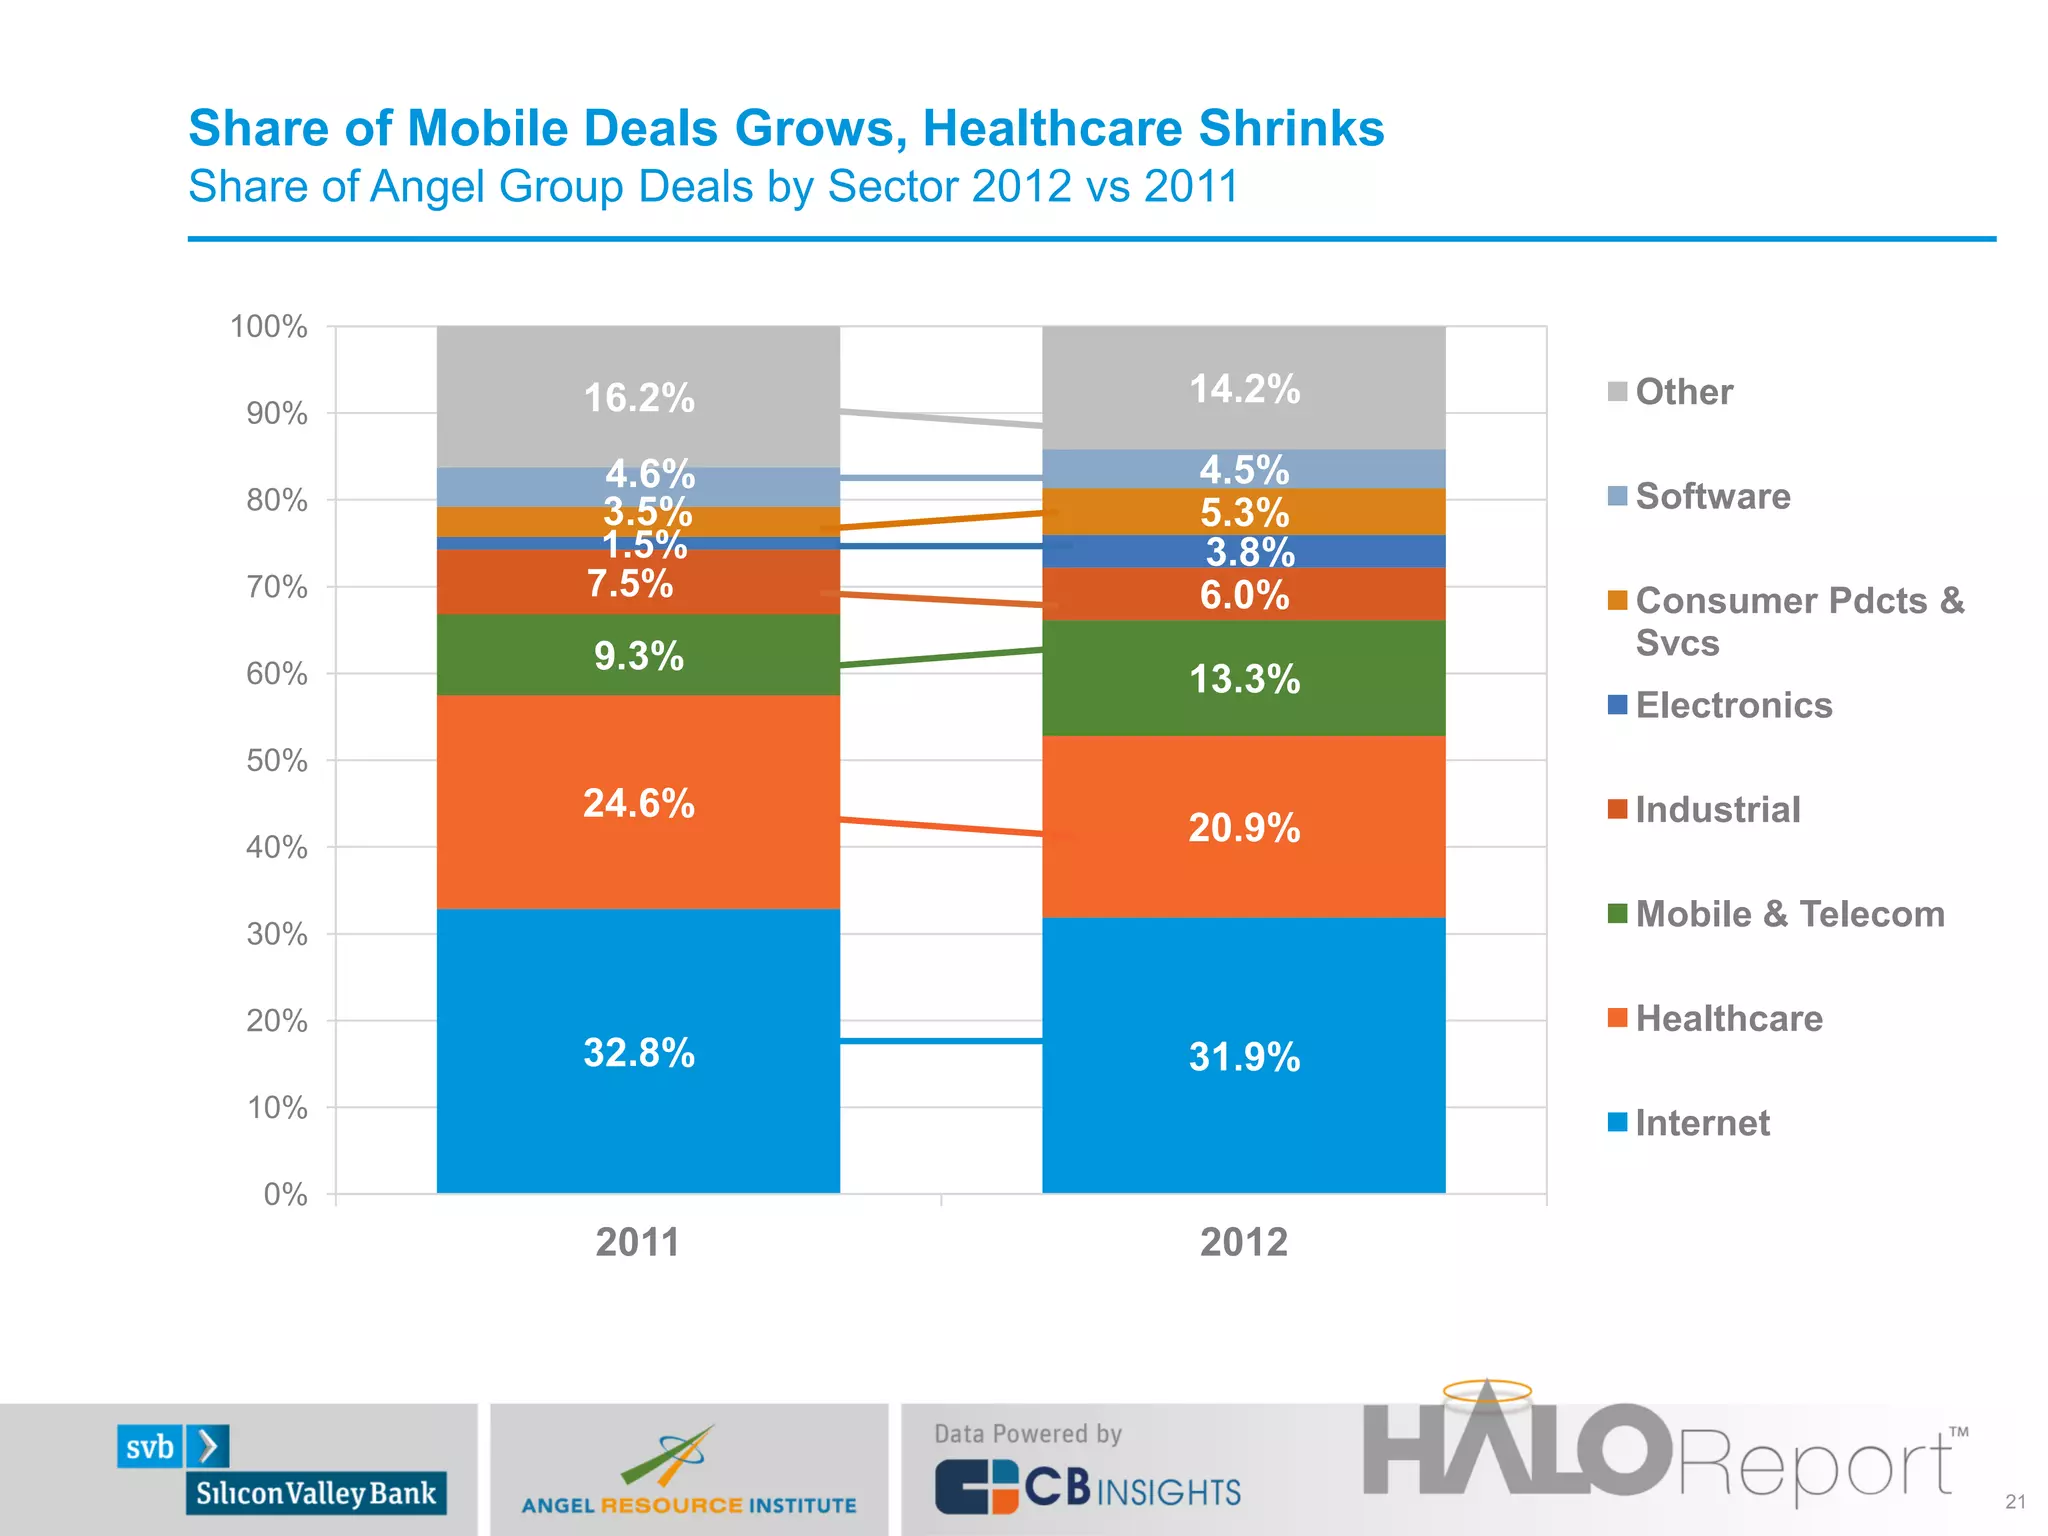
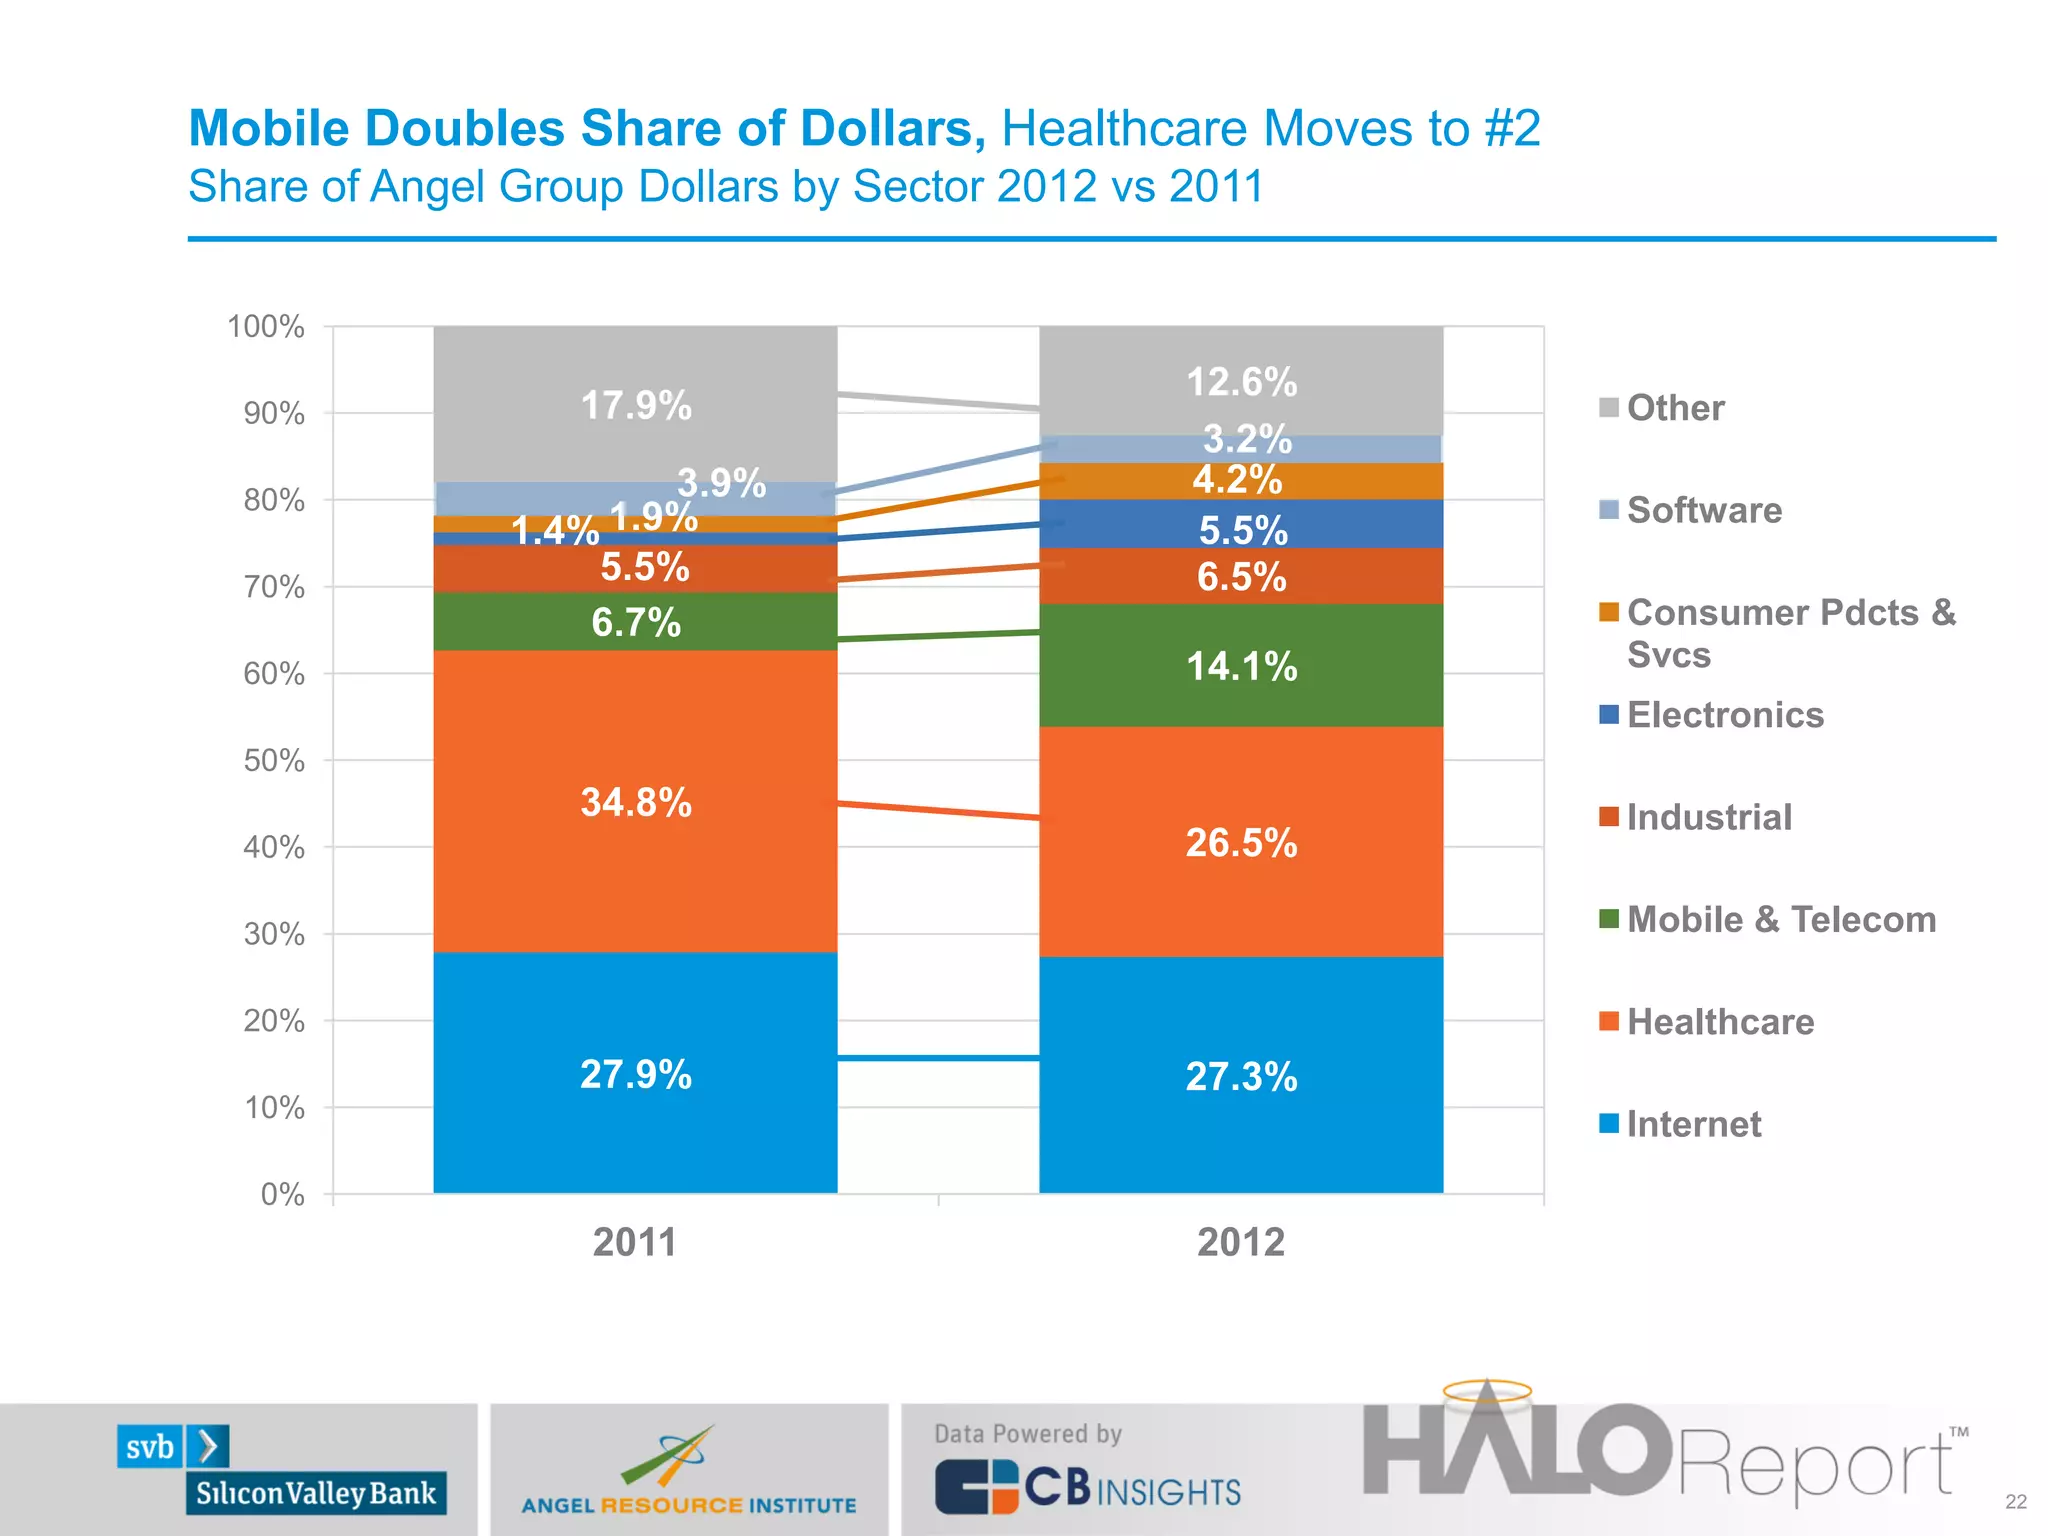
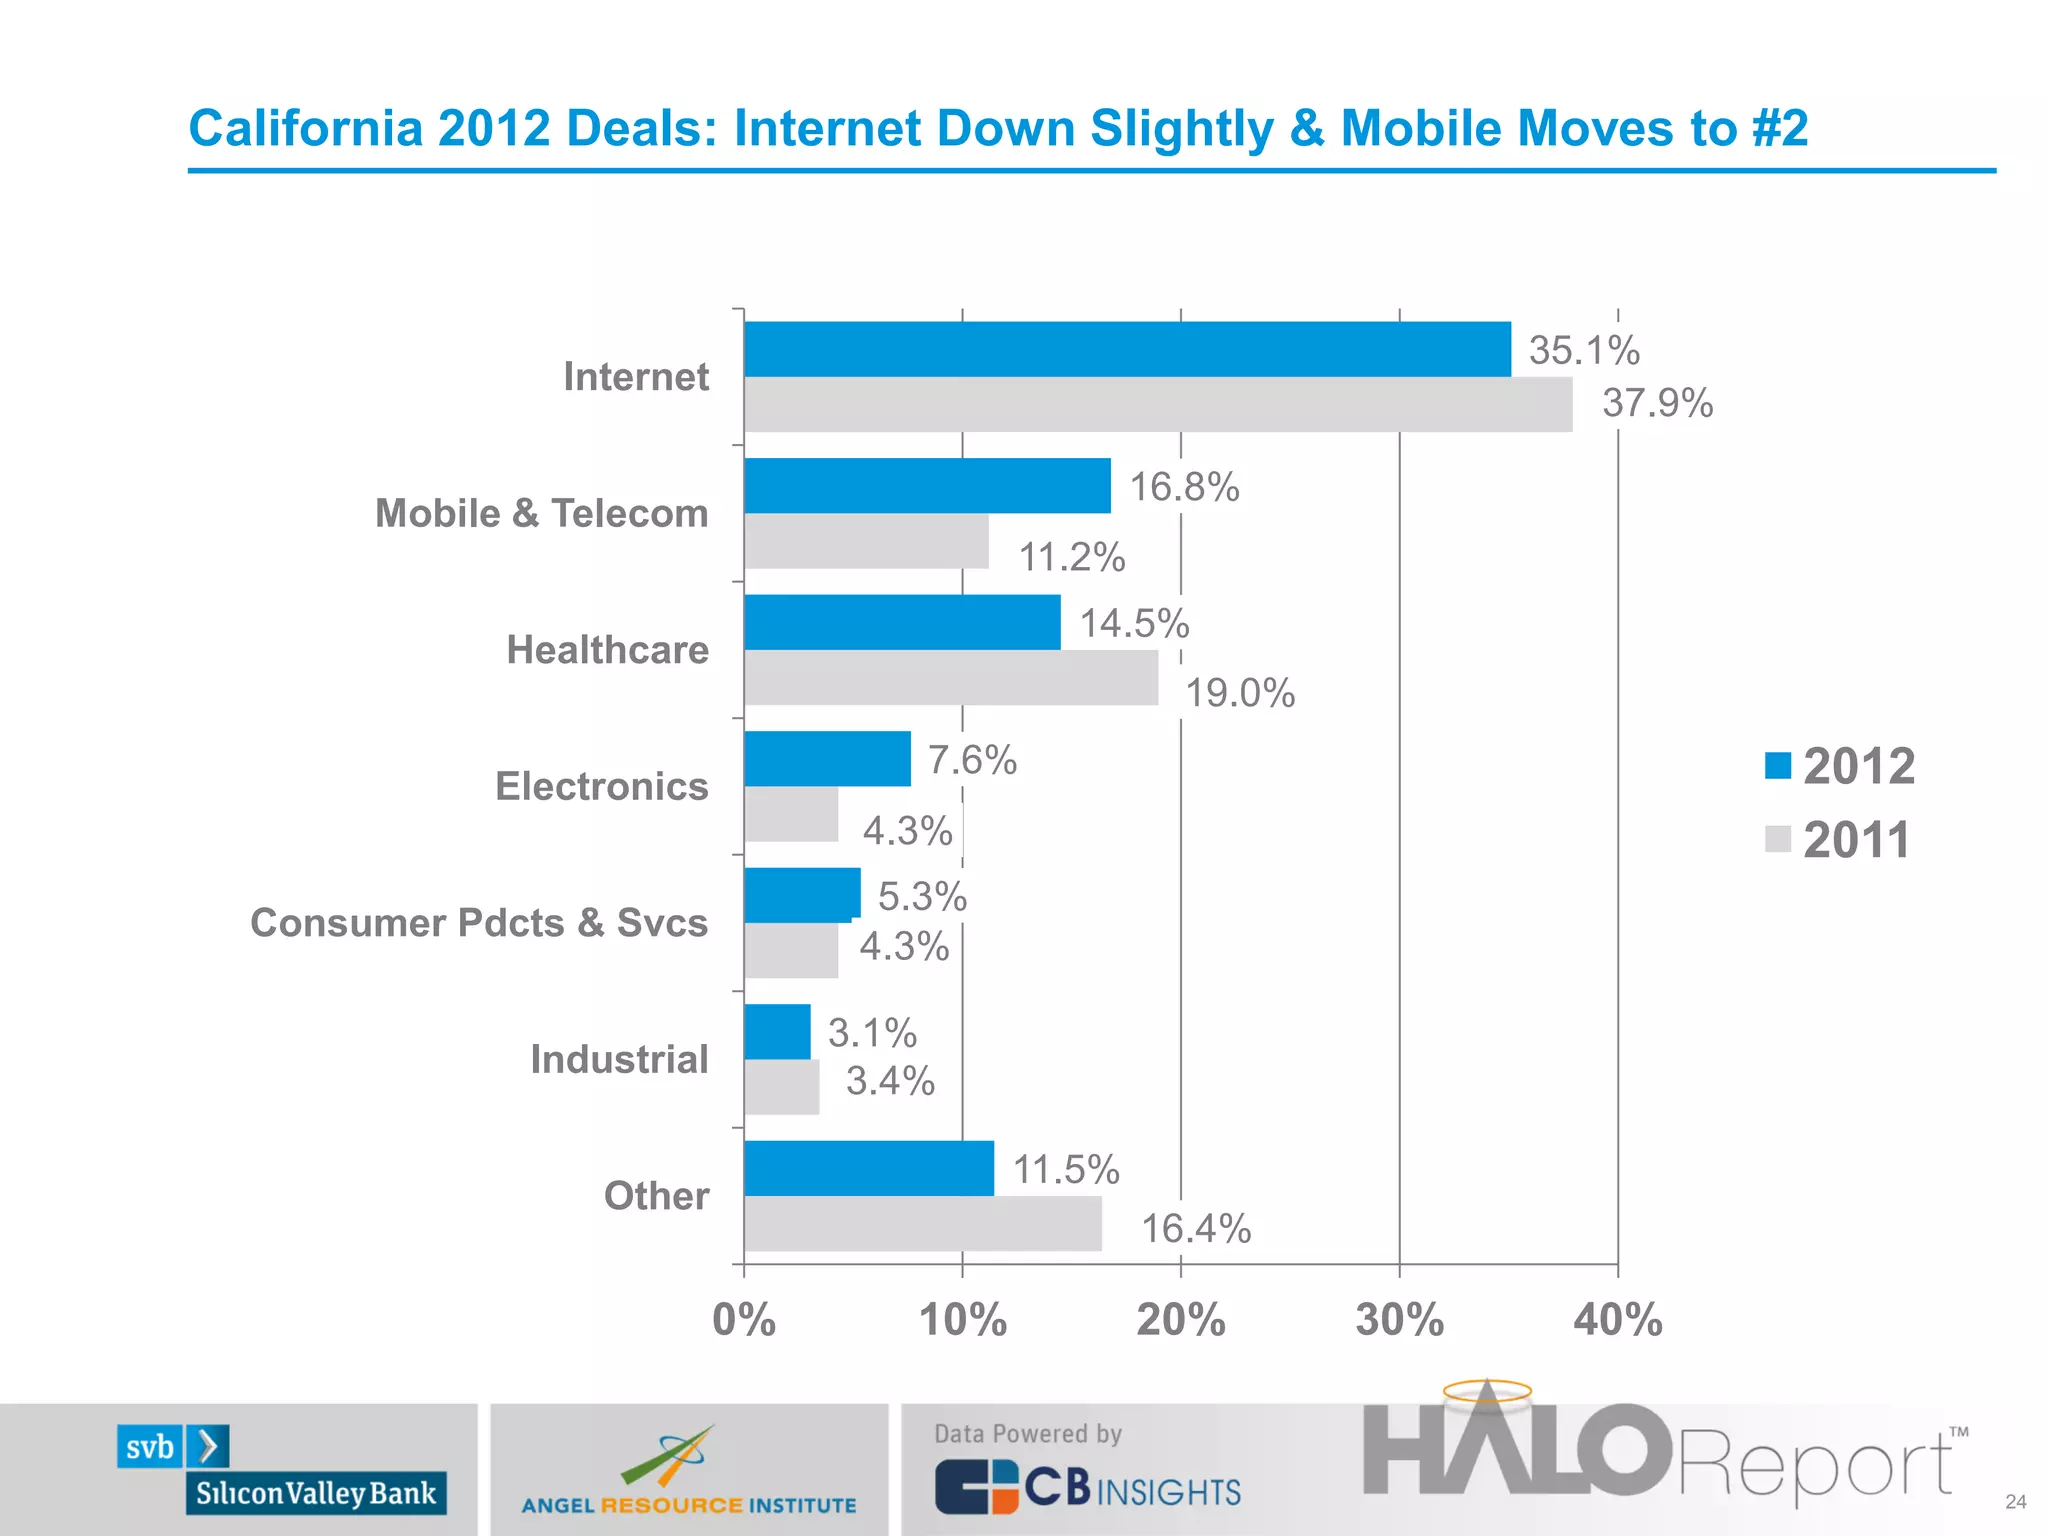
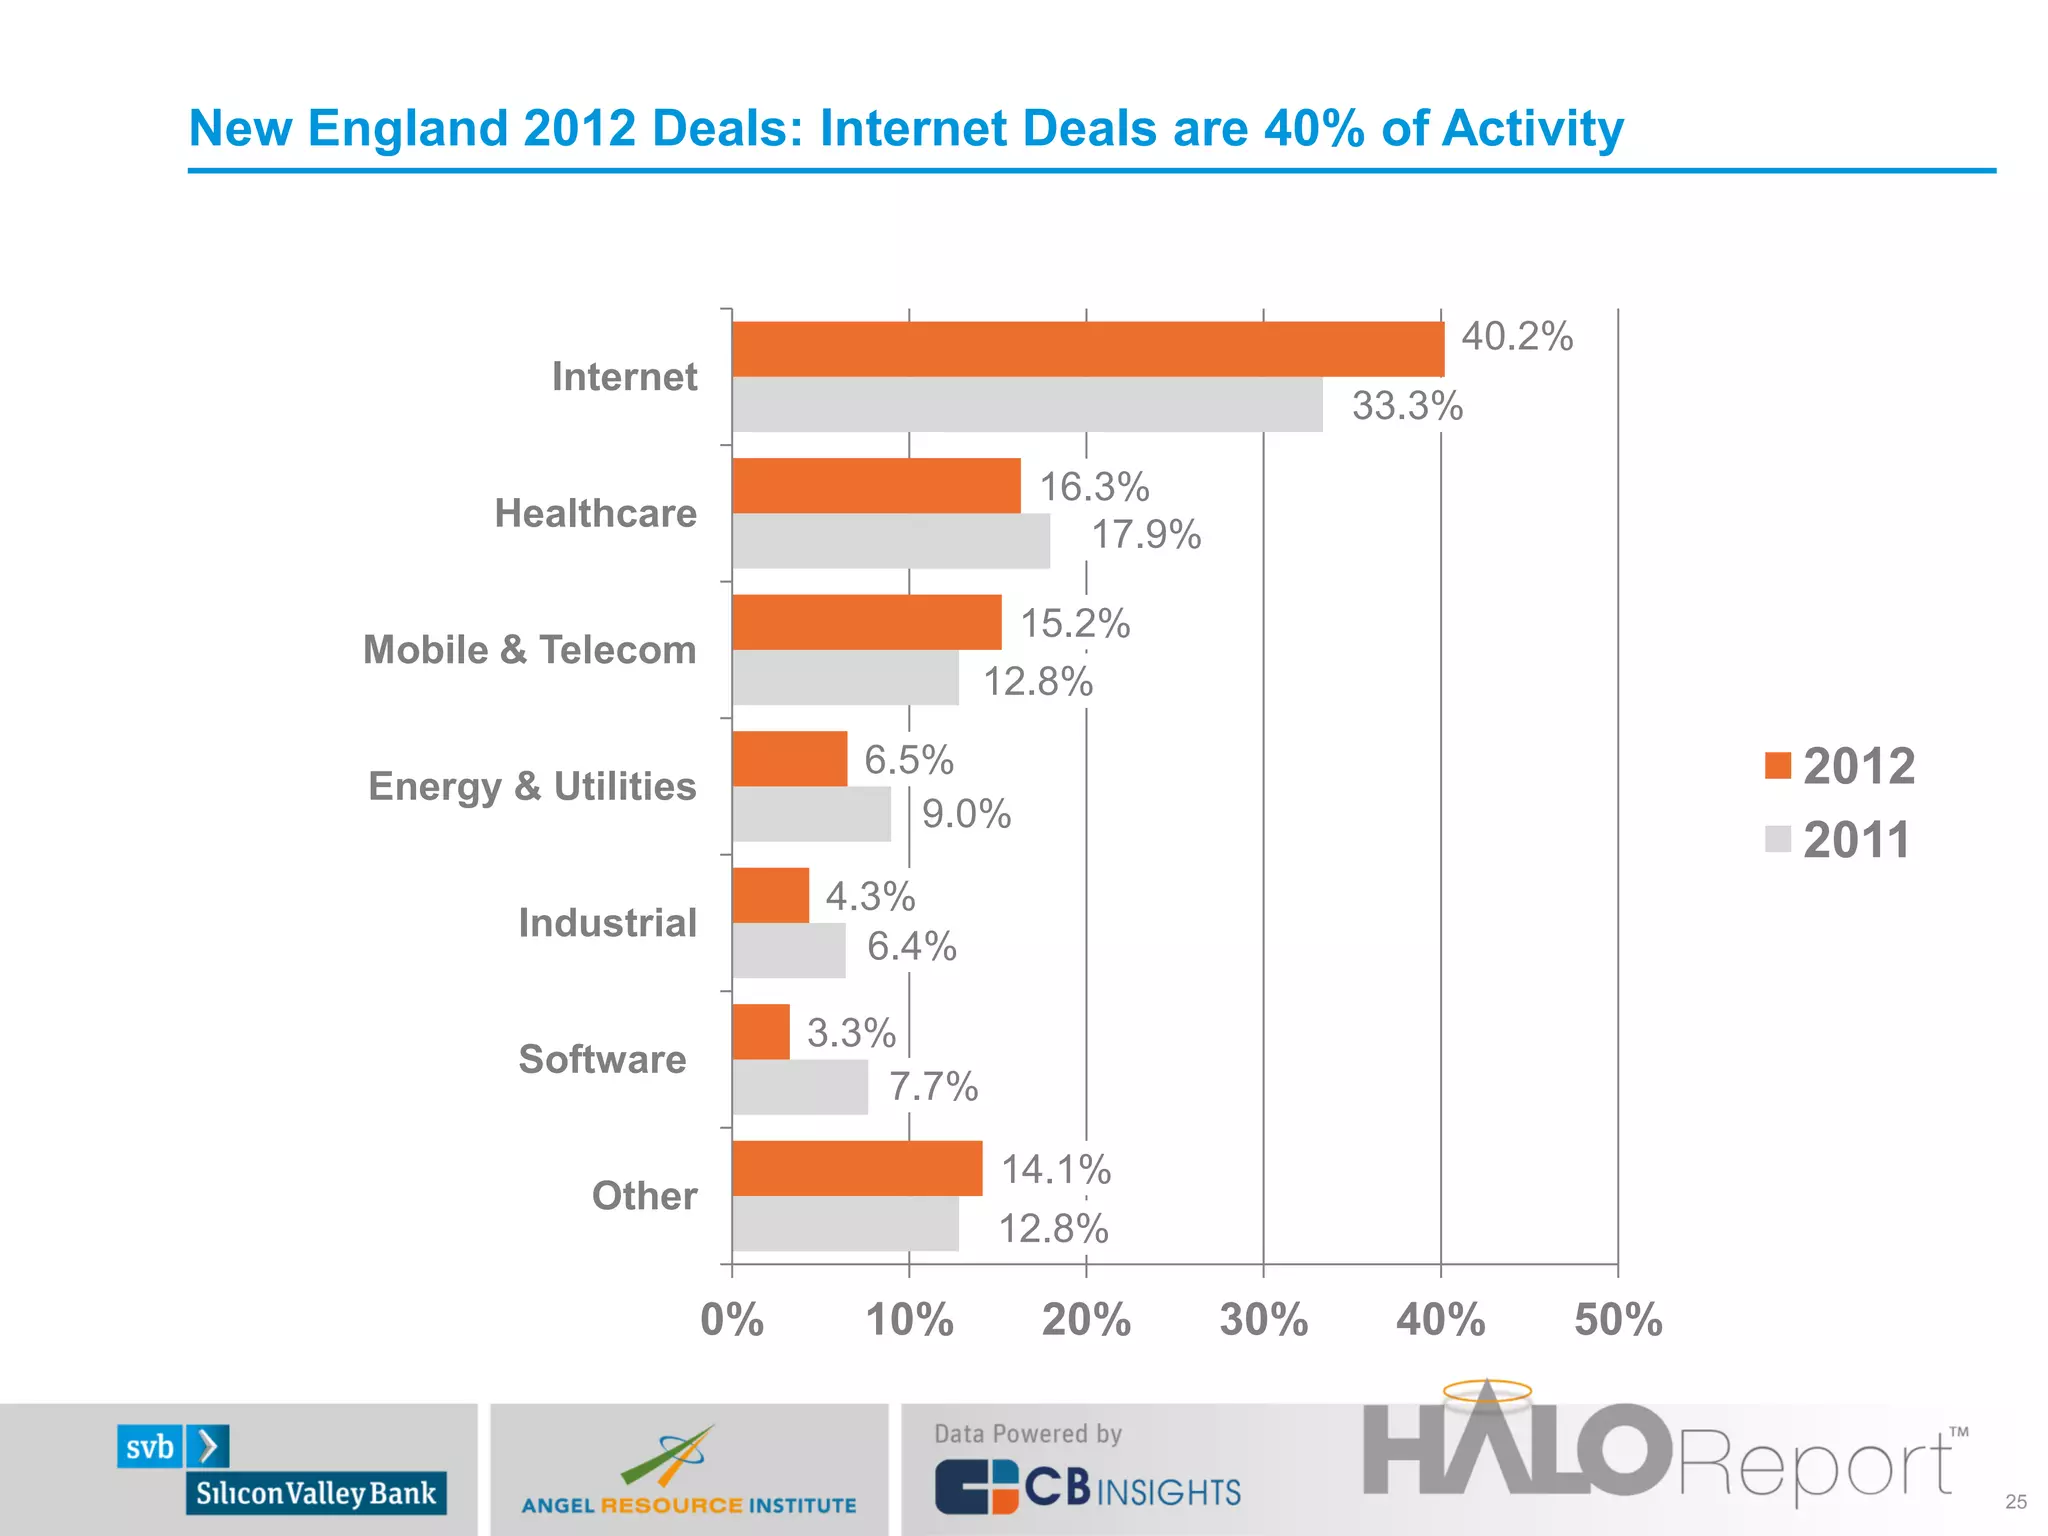
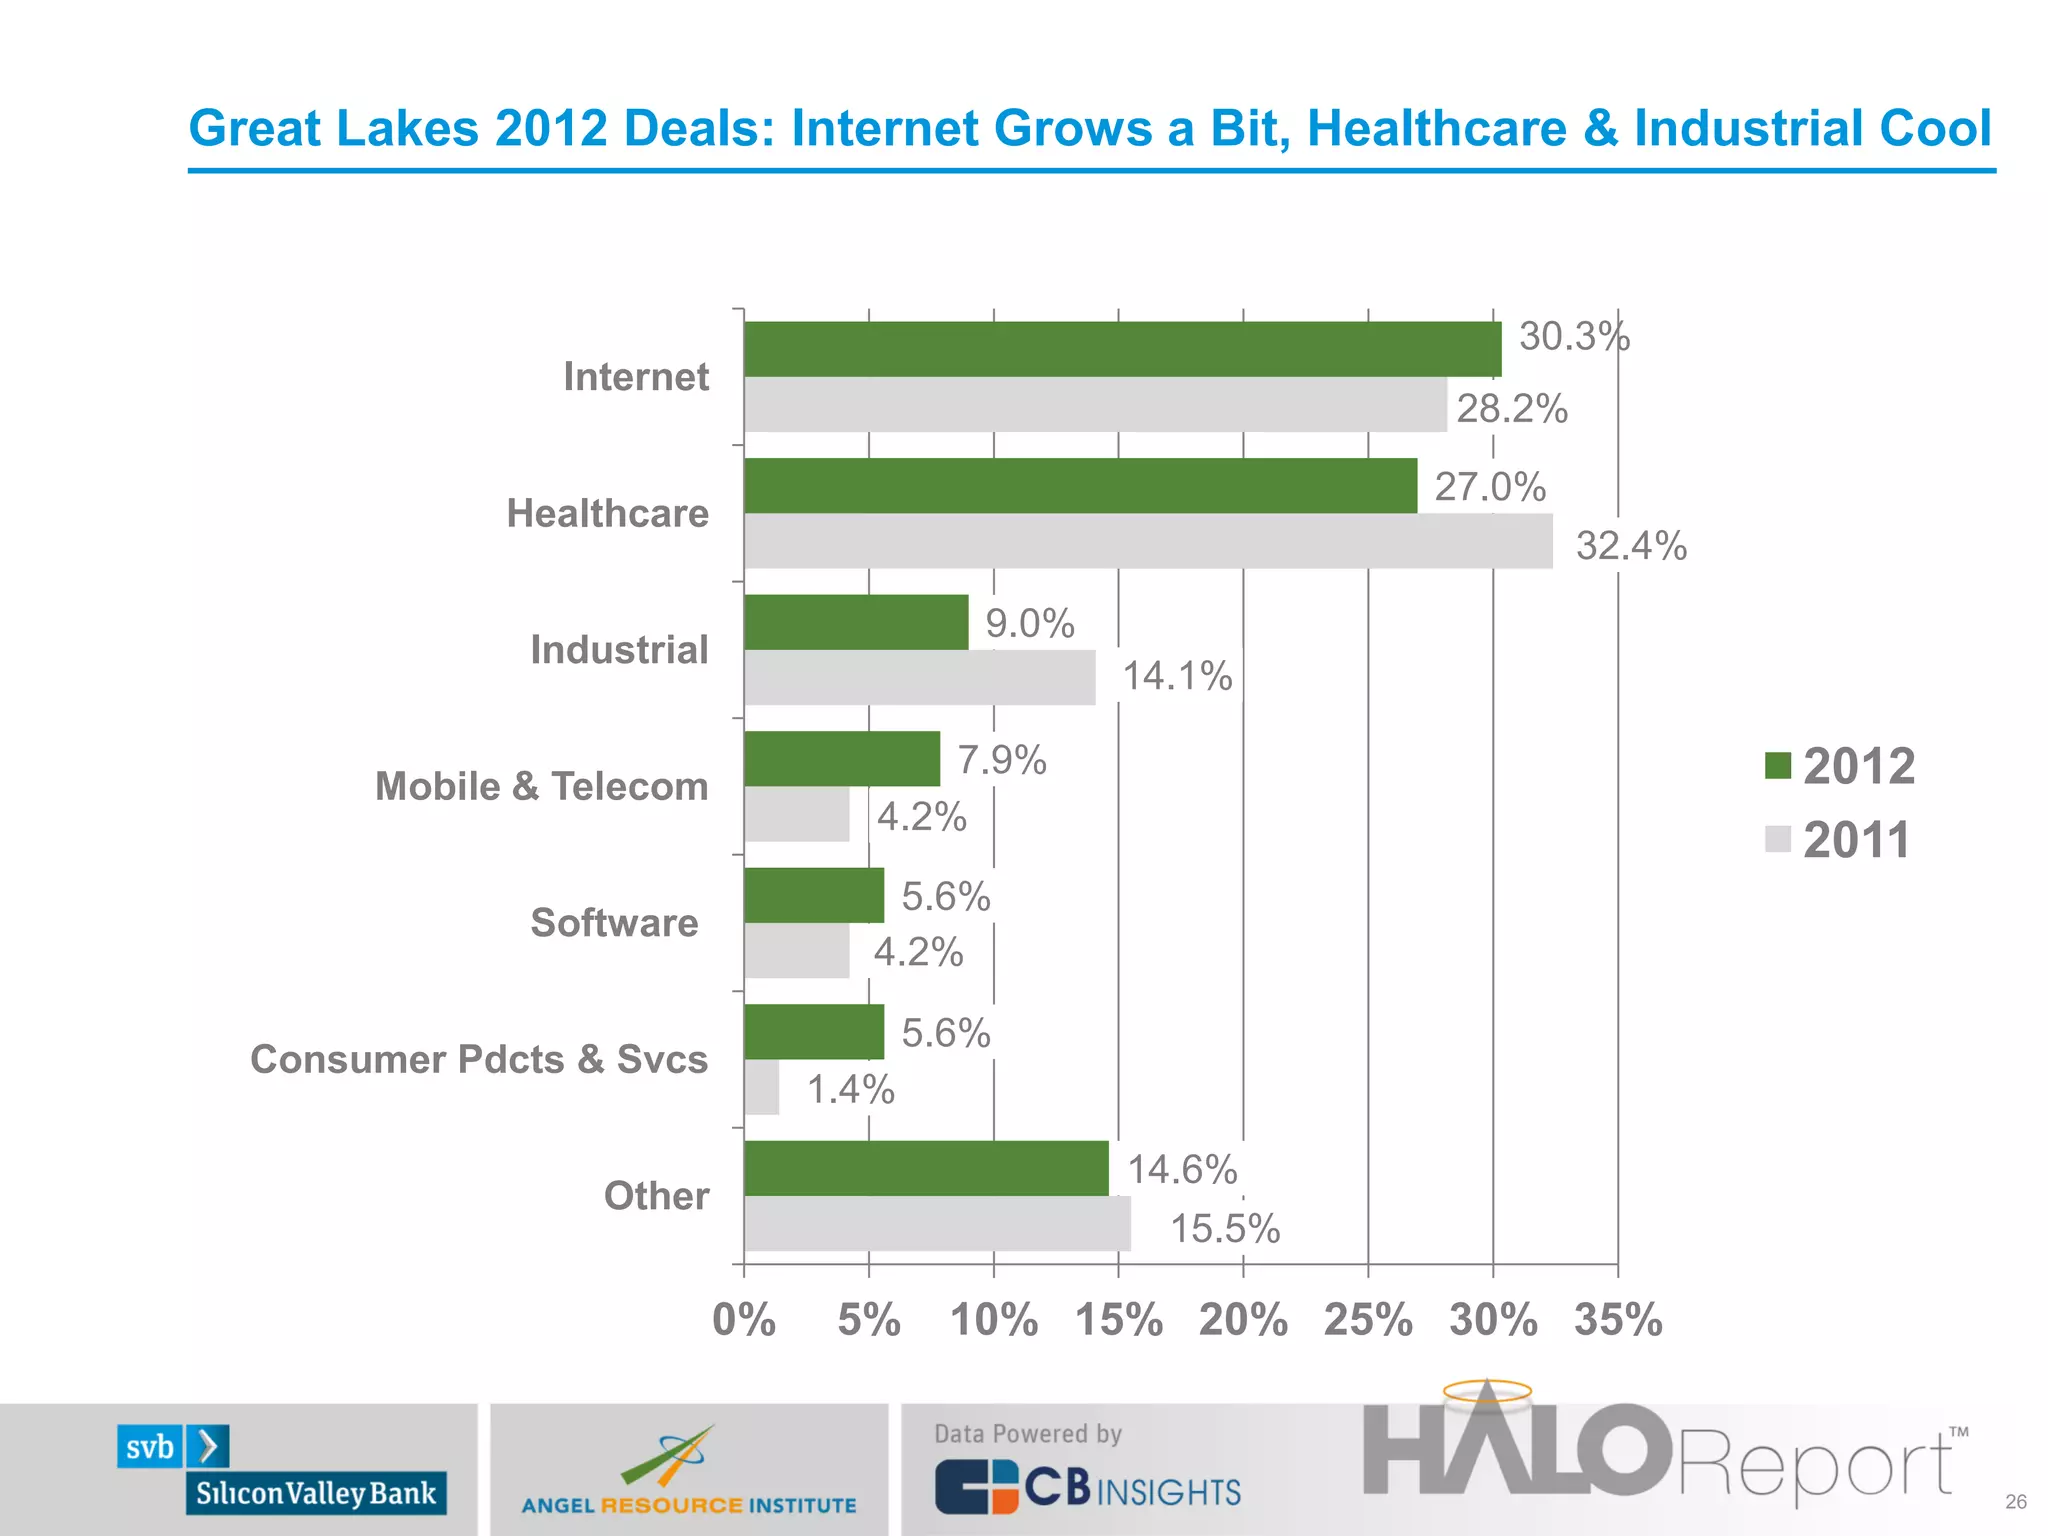
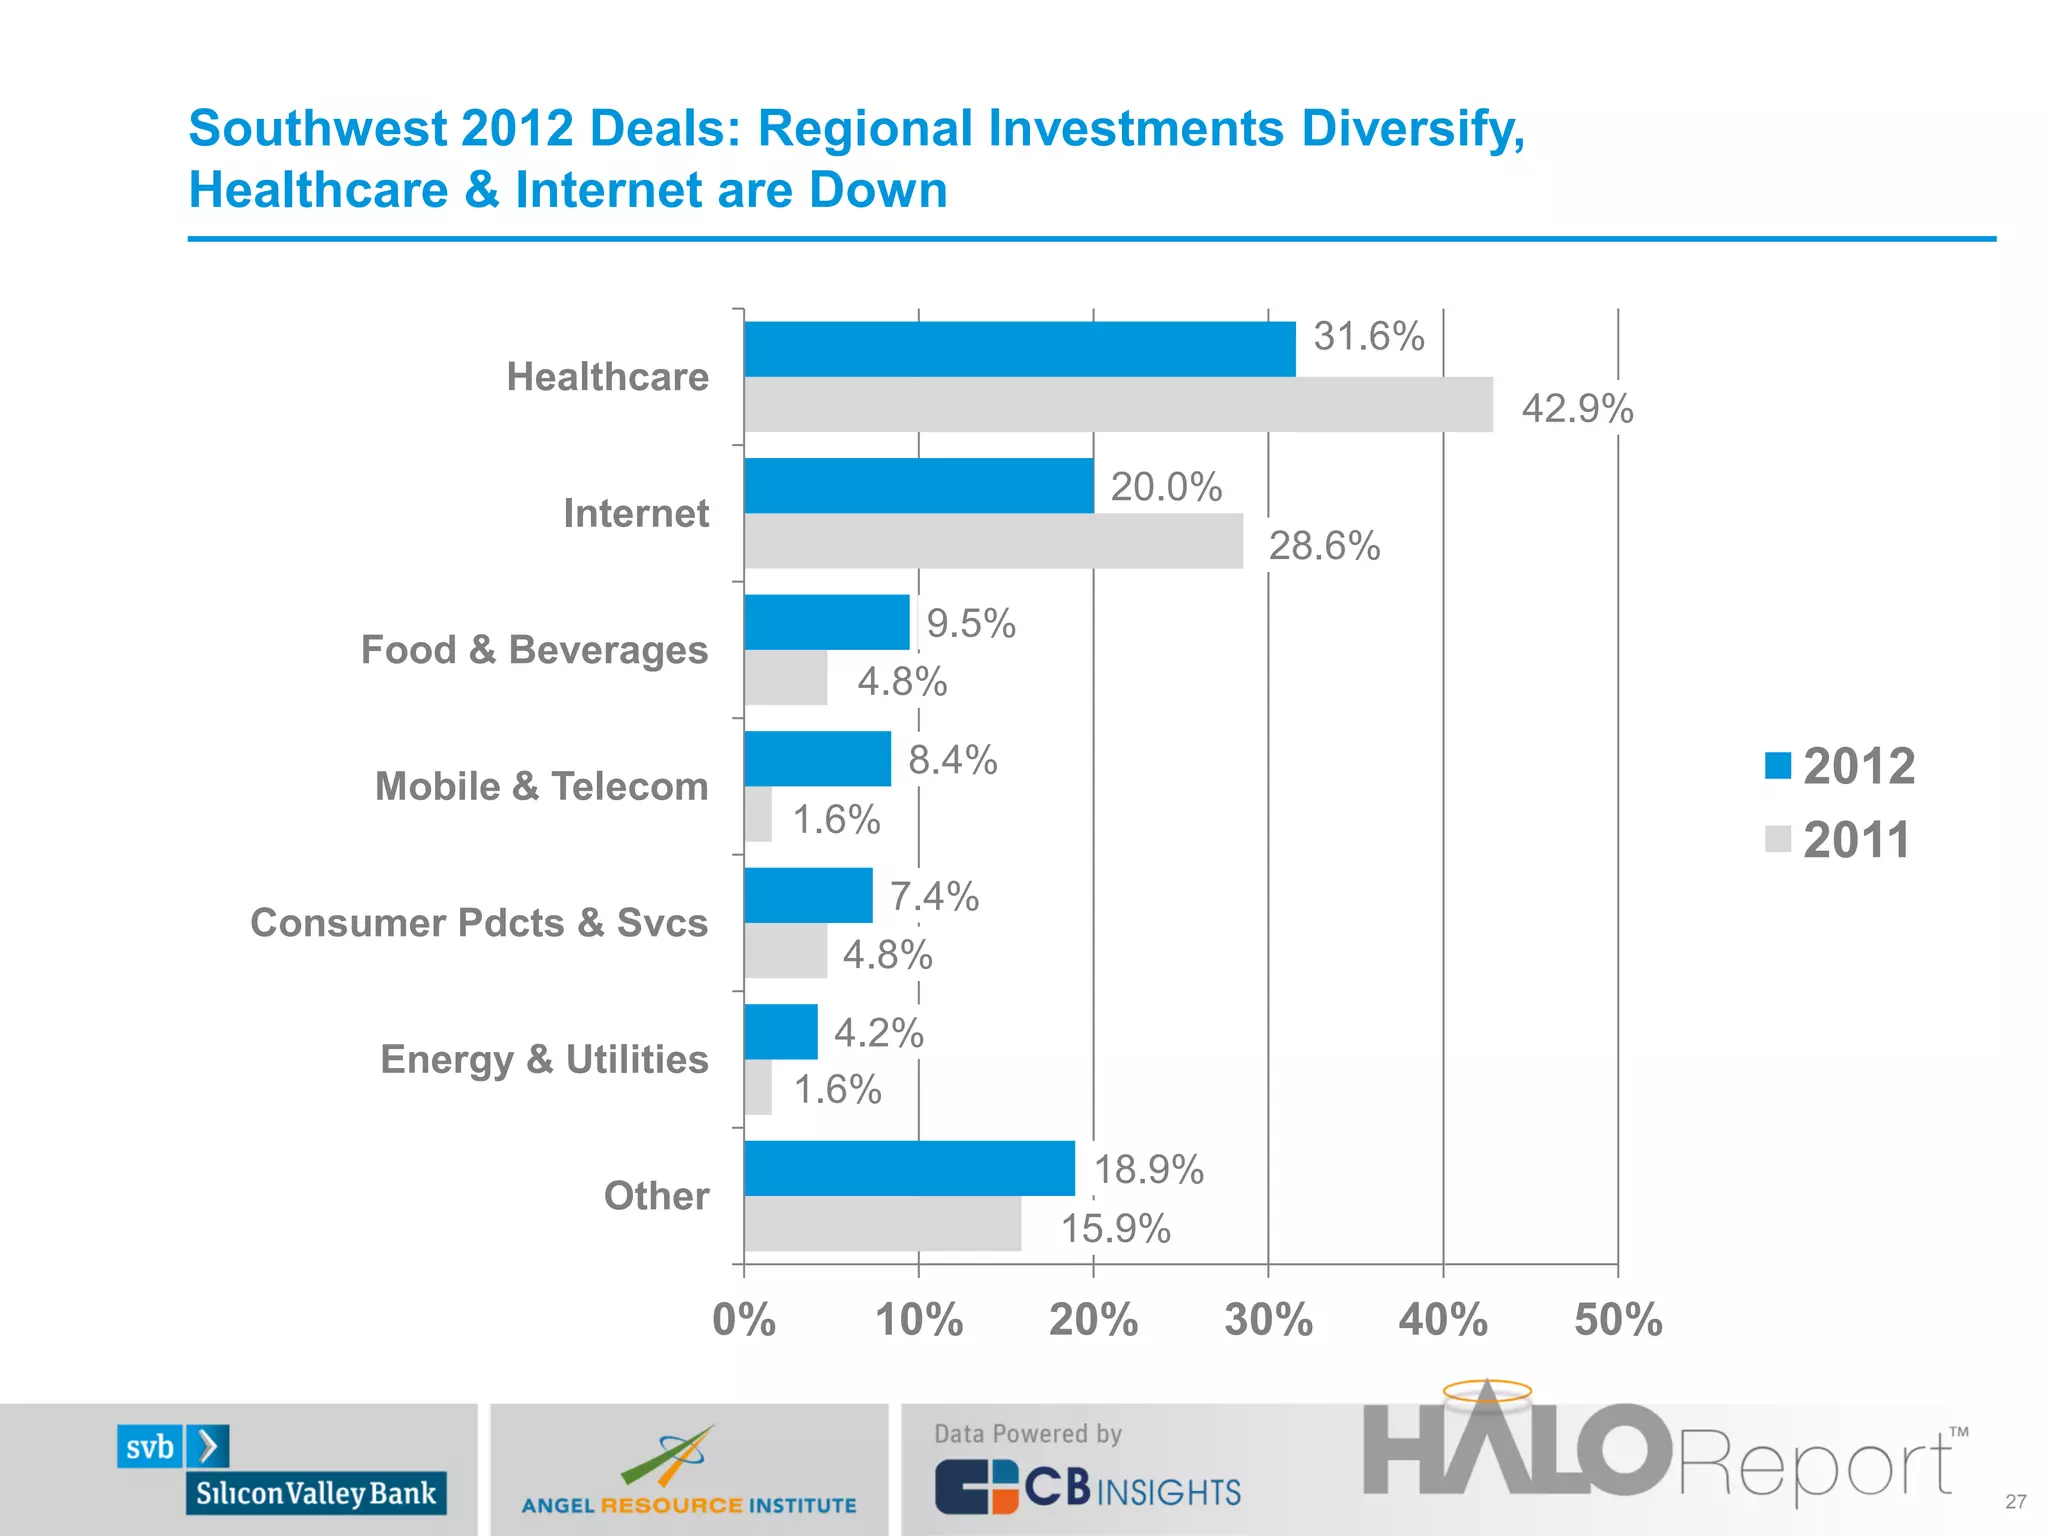
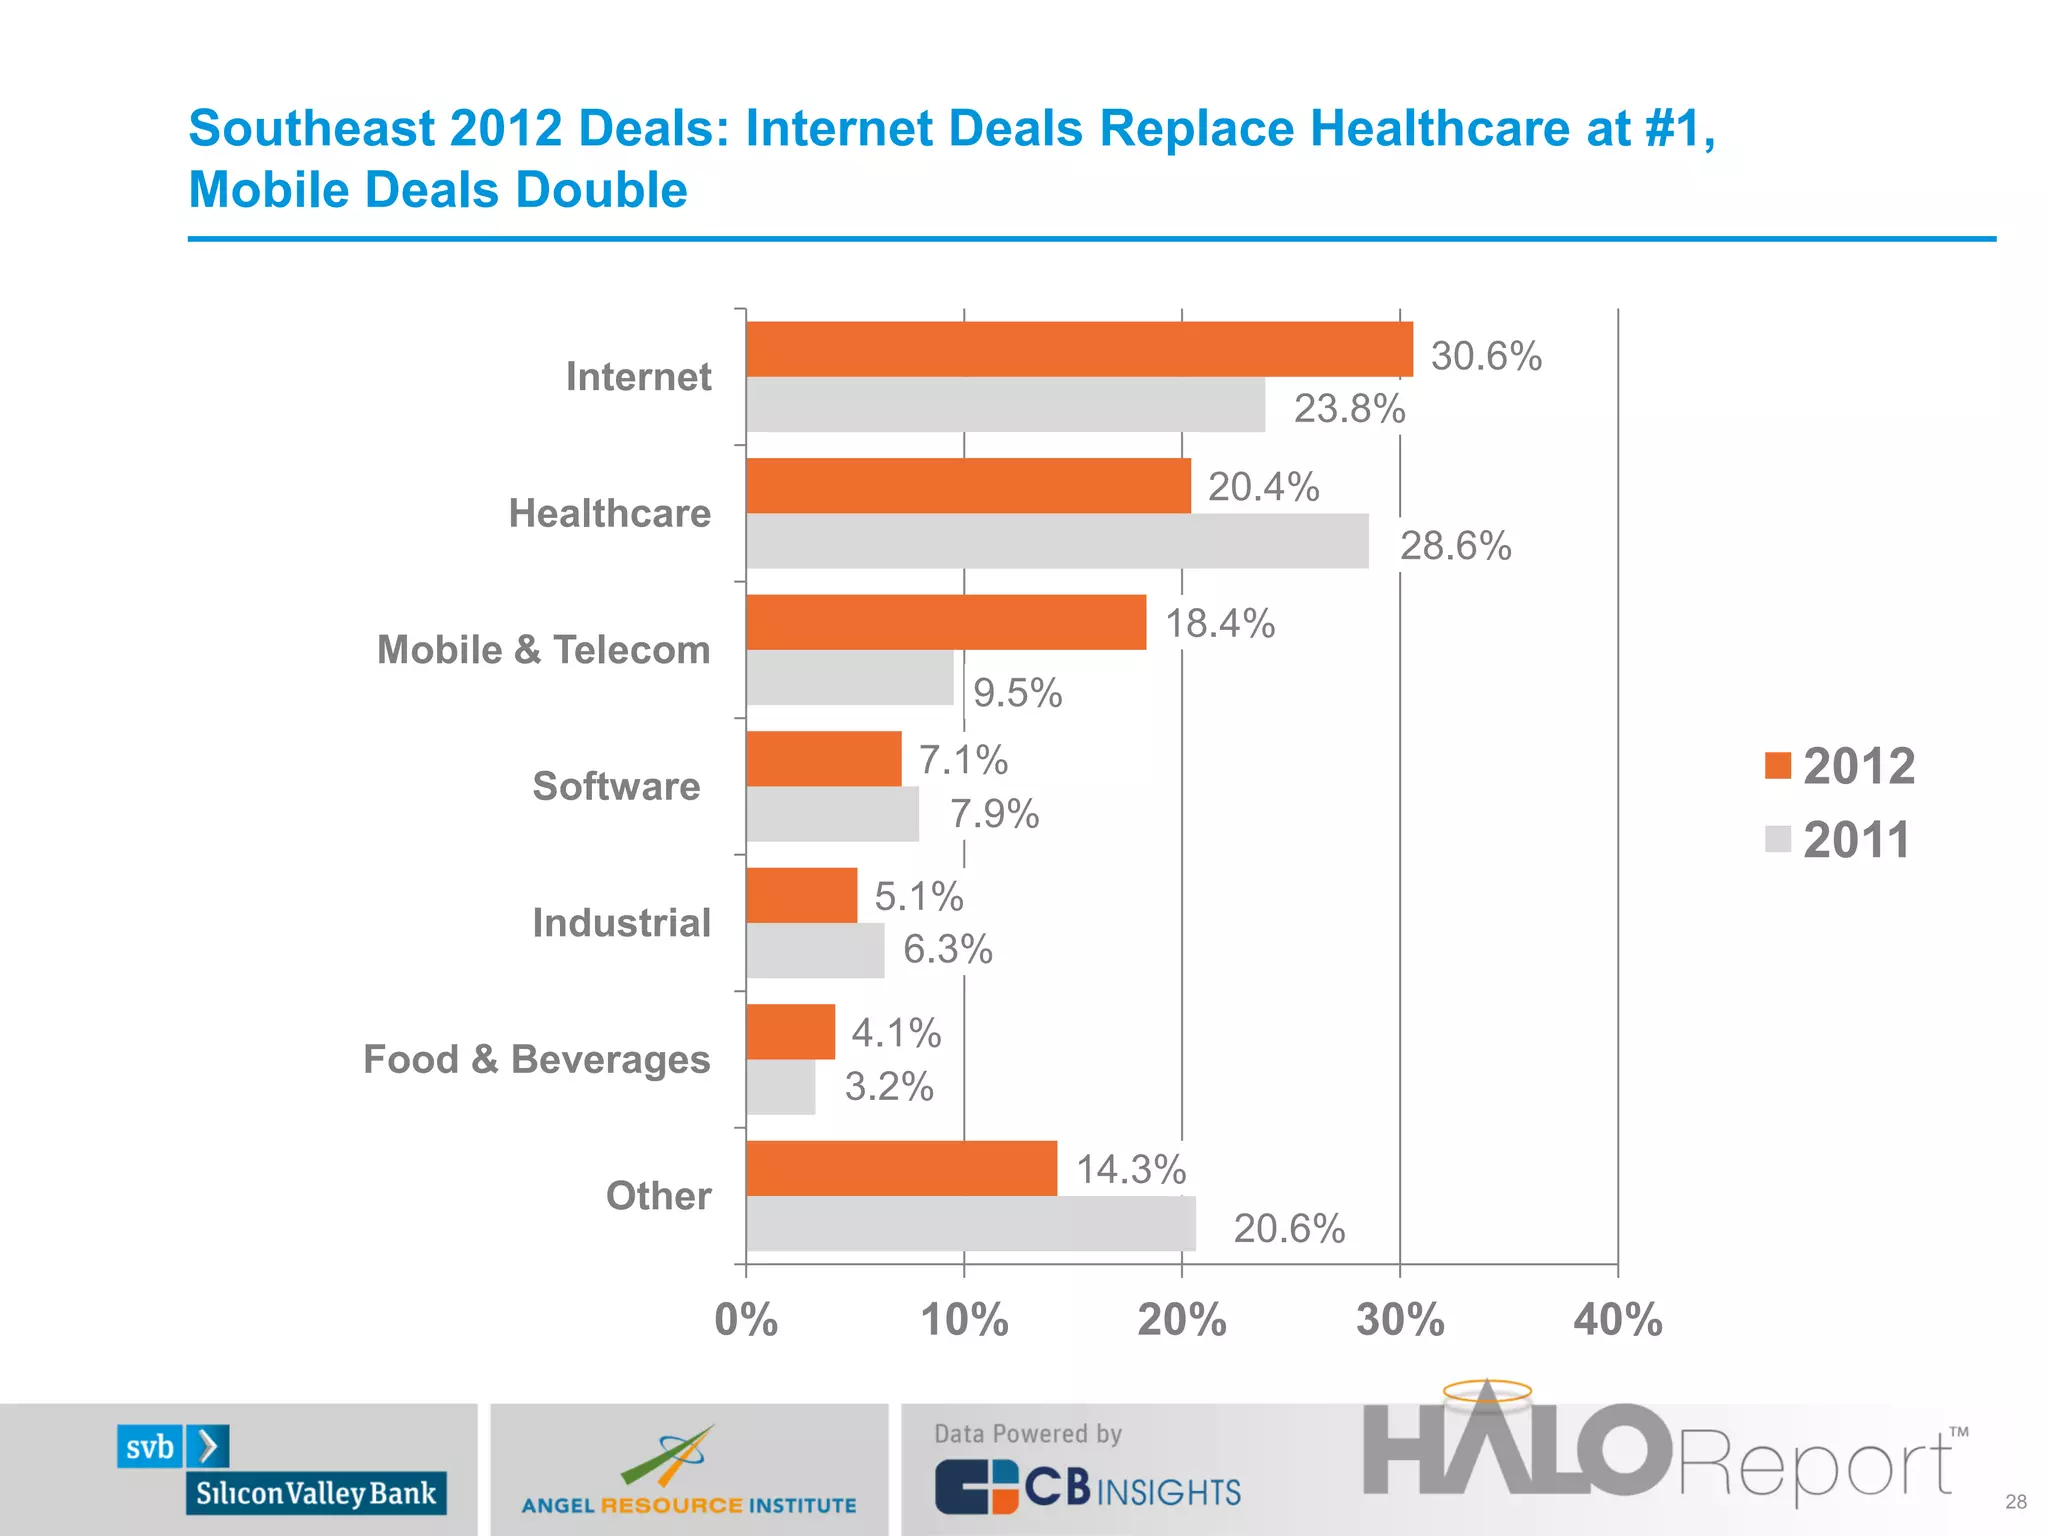

The 2012 Halo Report outlines key trends in angel investment, showing a slight dip in median round sizes but a year-end increase, and highlights the most active angel groups in the U.S. The report indicates a shift in sector focus, with mobile sector investments gaining and healthcare investments decreasing. Additionally, it shows geographical diversification in angel investment, with reduced shares from California and increased activity in other regions.


