May 2014 Housing Sales Statistics
•
0 likes•106 views

The Oklahoma Association of REALTORS® is committed to providing accurate, up-to-date housing information for our state, including monthly data on number of houses sold, average days on market, average sold price and more.

Recommended
Recommended
More Related Content
Recently uploaded
Recently uploaded (20)
Featured
Featured (20)
May 2014 Housing Sales Statistics
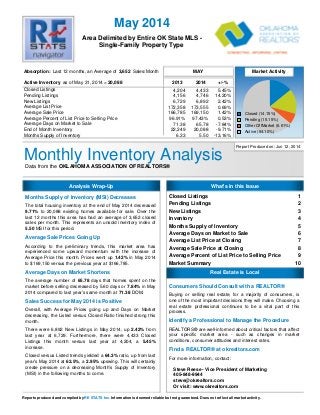
- 1. May 2014 Area Delimited by Entire OK State MLS - Single-Family Property Type 4,204 4,433 5.45% 4,156 4,746 14.20% 6,729 6,892 2.42% 172,358 173,555 0.69% 166,785 169,150 1.42% 96.91% 97.43% 0.53% 71.38 65.78 -7.84% 22,249 20,088 -9.71% 6.33 5.50 -13.16% Monthly Inventory Analysis D a t a f r o m t h e OKLAHOMA ASSOCIATION OF REALTORS® Closed (14.15%) Pending (15.15%) Other OffMarket (6.61%) Active (64.10%) Report Produced on: Jun 12, 2014 Absorption: Active Inventory 3,652 20,088 MAY Market Activity 2013 2014 +/-% Last 12 months, an Average of Sales/Month as of May 31, 2014 = Closed Listings Pending Listings New Listings Average List Price Average Sale Price Average Percent of List Price to Selling Price Average Days on Market to Sale End of Month Inventory Months Supply of Inventory Analysis Wrap-Up What's in this Issue Closed Listings 1 Pending Listings 2 New Listings 3 Inventory 4 Months Supply of Inventory 5 Average Days on Market to Sale 6 Average List Price at Closing 7 Average Sale Price at Closing 8 Average Percent of List Price to Selling Price 9 Market Summary 10 Real Estate is Local Months Supply of Inventory (MSI) Decreases The total housing inventory at the end of May 2014 decreased 9.71% to 20,088 existing homes available for sale. Over the last 12 months this area has had an average of 3,652 closed sales per month. This represents an unsold inventory index of 5.50 MSI for this period. Average Sale Prices Going Up According to the preliminary trends, this market area has experienced some upward momentum with the increase of Average Price this month. Prices went up 1.42% in May 2014 to $169,150 versus the previous year at $166,785. Average Days on Market Shortens The average number of 65.78 days that homes spent on the market before selling decreased by 5.60 days or 7.84% in May 2014 compared to last year’s same month at 71.38 DOM. Sales Success for May 2014 is Positive Overall, with Average Prices going up and Days on Market decreasing, the Listed versus Closed Ratio finished strong this month. There were 6,892 New Listings in May 2014, up 2.42% from last year at 6,729. Furthermore, there were 4,433 Closed Listings this month versus last year at 4,204, a 5.45% increase. Closed versus Listed trends yielded a 64.3% ratio, up from last year’s May 2014 at 62.5%, a 2.95% upswing. This will certainly create pressure on a decreasing Month’s Supply of Inventory (MSI) in the following months to come. Consumers Should Consult with a REALTOR® Buying or selling real estate, for a majority of consumers, is one of the most important decisions they will make. Choosing a real estate professional continues to be a vital part of this process. Identify a Professional to Manage the Procedure REALTORS® are well-informed about critical factors that affect your specific market area - such as changes in market conditions, consumer attitudes and interest rates. Find a REALTOR® at okrealtors.com For more information, contact: Steve Reese - Vice President of Marketing 405-848-9944 steve@okrealtors.com Or visit: www.okrealtors.com Reports produced and compiled by R E S T A T S I n c . Information is deemed reliable but not guaranteed. Does not reflect all market activity.
- 2. Monthly Inventory Analysis OKLAHOMA ASSOCIATION OF REALTORS® May 2014 Closed Sales as of Jun 11, 2014 Closed Listings Closed Listings Ready to Buy or Sell Real Estate? Contact an experienced REALTOR® Data from the Area Delimited by Entire OK State MLS - Single-Family Property Type Report Produced on: Jun 12, 2014 MAY YEAR TO DATE (YTD) +5.45% -0.22% 5 YEAR MARKET ACTIVITY TRENDS 5yr MAY AVG = 3,996 3 MONTHS High Jul 2013 = 4,635 Low Jan 2010 = 1,722 Closed Listings this month at 4,433, above the 5 yr MAY average of 3,996 Jun 2010 Dec 2010 Jun 2011 Dec 2011 Jun 2012 Dec 2012 Jun 2013 Dec 2013 CLOSED LISTINGS & BEDROOMS DISTRIBUTION BY PRICE MA R AP R MAY 5,000 4,000 3,000 2,000 1,000 0 Distribution of Closed Listings by Price Range % AVDOM 2 Beds 3 Beds 4 Beds 5 Beds+ 2010 3,949 2011 3,377 2012 4,017 2013 4,204 2014 4,433 1 Year 2 Year +10.36% 2010 15,065 2011 13,420 2012 15,985 2013 17,153 2014 17,115 1 Year 2 Year +7.07% 3,647 3,753 2.91% 4,433 18.12% $50,000 427 9.63% 82.1 184 203 36 4 and less $50,001 338 7.62% 76.0 127 191 19 1 $75,000 $75,001 467 10.53% 68.3 121 301 42 3 $100,000 $100,001 1,141 25.74% 56.9 203 810 119 9 $150,000 $150,001 884 19.94% 59.9 113 523 239 9 $200,000 $200,001 720 16.24% 68.2 76 288 336 20 $300,000 $300,001 456 10.29% 70.1 47 114 242 53 and up Total Closed Units: Total Closed Volume: Average Closed Price: 4,433 749,841,866 $169,150 65.8 871 107.97M $123,961 2430 353.40M $145,434 1033 256.40M $248,210 99 32.07M $323,914 Reports produced and compiled by R E S T A T S I n c . Information is deemed reliable but not guaranteed. Does not reflect all market activity. pp. 1 Steve Reese - Vice President of Marketing 405-848-9944 steve@okrealtors.com
- 3. Monthly Inventory Analysis OKLAHOMA ASSOCIATION OF REALTORS® May 2014 Pending Listings as of Jun 11, 2014 Pending Listings Pending Listings Ready to Buy or Sell Real Estate? Contact an experienced REALTOR® Data from the Area Delimited by Entire OK State MLS - Single-Family Property Type Report Produced on: Jun 12, 2014 MAY YEAR TO DATE (YTD) +14.20% +4.80% 5 YEAR MARKET ACTIVITY TRENDS 5yr MAY AVG = 3,689 3 MONTHS High Apr 2010 = 4,944 Low Dec 2010 = 2,050 Pending Listings this month at 4,746, above the 5 yr MAY average of 3,689 Jun 2010 Dec 2010 Jun 2011 Dec 2011 Jun 2012 Dec 2012 Jun 2013 Dec 2013 PENDING LISTINGS & BEDROOMS DISTRIBUTION BY PRICE MA R AP R MAY 5,000 4,000 3,000 2,000 1,000 0 Distribution of Pending Listings by Price Range % AVDOM 2 Beds 3 Beds 4 Beds 5 Beds+ 2010 2,403 2011 3,211 2012 3,931 2013 4,156 2014 4,746 1 Year 2 Year +20.73% 2010 16,887 2011 15,021 2012 18,333 2013 19,553 2014 20,491 1 Year 2 Year +11.77% 4,166 4,832 15.99% 4,746 -1.78% $50,000 412 8.68% 70.3 168 211 31 2 and less $50,001 392 8.26% 70.0 113 253 23 3 $75,000 $75,001 941 19.83% 57.3 183 663 84 11 $125,000 $125,001 1,166 24.57% 49.0 160 796 196 14 $175,000 $175,001 750 15.80% 64.0 88 405 242 15 $225,000 $225,001 558 11.76% 65.4 62 208 257 31 $300,000 $300,001 527 11.10% 77.1 45 126 274 82 and up Total Pending Units: Total Pending Volume: Average Listing Price: 4,746 848,819,474 $164,801 67.7 819 106.74M $130,324 2662 396.53M $148,959 1107 284.96M $257,418 158 60.59M $383,493 Reports produced and compiled by R E S T A T S I n c . Information is deemed reliable but not guaranteed. Does not reflect all market activity. pp. 2 Steve Reese - Vice President of Marketing 405-848-9944 steve@okrealtors.com
- 4. Monthly Inventory Analysis OKLAHOMA ASSOCIATION OF REALTORS® May 2014 New Listings New Listings Ready to Buy or Sell Real Estate? Contact an experienced REALTOR® Data from the New Listings as of Jun 11, 2014 Area Delimited by Entire OK State MLS - Single-Family Property Type Report Produced on: Jun 12, 2014 MAY YEAR TO DATE (YTD) +2.42% -0.05% 5 YEAR MARKET ACTIVITY TRENDS 5yr MAY AVG = 6,356 3 MONTHS High Apr 2010 = 7,797 Low Dec 2013 = 3,477 New Listings this month at 6,892, above the 5 yr MAY average of Jun 2010 Dec 2010 Jun 2011 Dec 2011 Jun 2012 Dec 2012 Jun 2013 Dec 2013 NEW LISTINGS & BEDROOMS DISTRIBUTION BY PRICE 6,356 MA R AP R MAY 8,000 7,000 6,000 5,000 4,000 3,000 2,000 1,000 0 Distribution of New Listings by Price Range % 2 Beds 3 Beds 4 Beds 5 Beds+ 2010 5,251 2011 6,115 2012 6,794 2013 6,729 2014 6,892 1 Year 2 Year +1.44% 2010 31,028 2011 29,684 2012 32,269 2013 31,950 2014 31,933 1 Year 2 Year -1.04% 6,597 7,310 10.81% 6,892 -5.72% $50,000 516 7.49% 252 234 30 0 and less $50,001 574 8.33% 211 322 37 4 $75,000 $75,001 1,354 19.65% 307 903 132 12 $125,000 $125,001 1,575 22.85% 228 1,085 240 22 $175,000 $175,001 1,017 14.76% 156 530 312 19 $225,000 $225,001 1,133 16.44% 124 446 490 73 $350,000 $350,001 723 10.49% 69 165 361 128 and up Total New Listed Units: Total New Listed Volume: Average New Listed Listing Price: 6,892 1,375,006,739 $177,390 1347 189.84M $140,932 3685 603.13M $163,673 1602 457.96M $285,869 258 124.07M $480,908 Reports produced and compiled by R E S T A T S I n c . Information is deemed reliable but not guaranteed. Does not reflect all market activity. pp. 3 Steve Reese - Vice President of Marketing 405-848-9944 steve@okrealtors.com
- 5. Monthly Inventory Analysis OKLAHOMA ASSOCIATION OF REALTORS® May 2014 Active Inventory as of Jun 11, 2014 Active Inventory Active Inventory Ready to Buy or Sell Real Estate? Contact an experienced REALTOR® Data from the Area Delimited by Entire OK State MLS - Single-Family Property Type Report Produced on: Jun 12, 2014 END OF MAY ACTIVE DURING MAY -9.63% -5.27% 5 YEAR MARKET ACTIVITY TRENDS 5yr MAY AVG = 23,039 3 MONTHS High Jul 2011 = 26,782 Low Feb 2014 = 19,872 Inventory this month at below the 5 yr MAY average of Jun 2010 Dec 2010 Jun 2011 Dec 2011 Jun 2012 Dec 2012 Jun 2013 Dec 2013 INVENTORY & BEDROOMS DISTRIBUTION BY PRICE 20,088, 23,039 MA R AP R MAY 30,000 20,000 10,000 0 Distribution of Inventory by Price Range % AVDOM 2 Beds 3 Beds 4 Beds 5 Beds+ 2010 23,081 2011 25,584 2012 24,213 2013 22,229 2014 20,088 1 Year 2 Year -17.04% 2010 27,423 2011 31,027 2012 30,456 2013 28,403 2014 26,906 1 Year 2 Year -11.66% 19,955 20,029 0.37% 20,088 0.29% $50,000 1,763 8.78% 126.2 920 737 101 5 and less $50,001 2,037 10.14% 117.3 805 1,084 136 12 $75,000 $75,001 2,316 11.53% 109.1 678 1,387 226 25 $100,000 $100,001 5,468 27.22% 96.7 1,027 3,552 802 87 $175,000 $175,001 3,587 17.86% 98.4 567 1,730 1,183 107 $250,000 $250,001 2,587 12.88% 102.3 347 833 1,186 221 $375,000 $375,001 2,330 11.60% 115.4 263 496 1,092 479 and up Total Active Inventory by Units: Total Active Inventory by Volume: Average Active Inventory Listing Price: 20,088 4,297,669,846 $213,942 106.0 4,607 682.02M $148,039 9,819 1.63B $166,328 4,726 1.46B $308,368 936 525.14M $561,045 Reports produced and compiled by R E S T A T S I n c . Information is deemed reliable but not guaranteed. Does not reflect all market activity. pp. 4 Steve Reese - Vice President of Marketing 405-848-9944 steve@okrealtors.com
- 6. Monthly Inventory Analysis OKLAHOMA ASSOCIATION OF REALTORS® May 2014 Active Inventory as of Jun 11, 2014 Months Supply of Inventory Months Supply Ready to Buy or Sell Real Estate? Contact an experienced REALTOR® Data from the Area Delimited by Entire OK State MLS - Single-Family Property Type Report Produced on: Jun 12, 2014 MSI FOR MAY INDICATORS FOR MAY 2014 -13.09% 5 YEAR MARKET ACTIVITY TRENDS 5yr MAY AVG = 7.2 3 MONTHS High Jun 2011 = 9.7 Low Feb 2014 = 5.4 Months Supply this month at 5.5, below the 5 yr MAY average of 7.2 Jun 2010 Dec 2010 Jun 2011 Dec 2011 Jun 2012 Dec 2012 Jun 2013 Dec 2013 MONTHS SUPPLY & BEDROOMS DISTRIBUTION BY PRICE MA R AP R MAY 10 9 8 7 6 5 4 3 2 1 0 Distribution of Active Inventory by Price Range and MSI % MSI 2 Beds 3 Beds 4 Beds 5 Beds+ 2010 7.0 2011 9.3 2012 7.7 2013 6.3 2014 5.5 1 Year 2 Year -28.24% Inventory 20,088 End of Month Active Inventory Closed 43,820 Closed Last 12 Months Absorption 3,652 Average Closed per Month over 12 Months MSI 5.5 Months Supply of Inventory MSI % 18.178% Percent Months Supply of Inventory 5.5 5.5 0.90% 5.5 -0.23% $50,000 1,763 8.78% 4.1 5.0 3.5 3.7 1.2 and less $50,001 2,037 10.14% 6.4 7.8 5.7 5.9 5.3 $75,000 $75,001 2,316 11.53% 5.9 7.4 5.3 6.4 8.3 $100,000 $100,001 5,468 27.22% 4.2 4.9 4.0 4.0 7.0 $175,000 $175,001 3,587 17.86% 5.5 6.5 5.5 5.0 6.6 $250,000 $250,001 2,587 12.88% 6.9 9.7 7.2 6.0 8.2 $375,000 $375,001 2,330 11.60% 13.5 20.6 14.7 11.8 13.9 and up MSI: Total Active Inventory: 20,088 5.5 6.3 4,607 4.9 9,819 5.8 4,726 9.4 936 Reports produced and compiled by R E S T A T S I n c . Information is deemed reliable but not guaranteed. Does not reflect all market activity. pp. 5 Steve Reese - Vice President of Marketing 405-848-9944 steve@okrealtors.com
- 7. Monthly Inventory Analysis OKLAHOMA ASSOCIATION OF REALTORS® May 2014 Closed Sales as of Jun 11, 2014 Average Days on Market to Sale Average Days on Market Ready to Buy or Sell Real Estate? Contact an experienced REALTOR® Data from the Area Delimited by Entire OK State MLS - Single-Family Property Type Report Produced on: Jun 12, 2014 MAY YEAR TO DATE (YTD) -7.84% -3.29% 5 YEAR MARKET ACTIVITY TRENDS 5yr MAY AVG = 75 3 MONTHS High Mar 2011 = 98 Low May 2014 = 66 Average DOM this month at 66, below the 5 yr MAY average of 75 MA R AP R MAY Jun 2010 Dec 2010 Jun 2011 Dec 2011 Jun 2012 Dec 2012 Jun 2013 Dec 2013 AVERAGE DOM OF CLOSED SALES & BEDROOMS DISTRIBUTION BY PRICE 100 90 80 70 60 50 40 30 20 10 0 Distribution of Average Days on Market to Sale by Price Range % AVDOM 2 Beds 3 Beds 4 Beds 5 Beds+ 2010 73 2011 87 2012 80 2013 71 2014 66 1 Year 2 Year -18.05% 2010 78 2011 94 2012 88 2013 79 2014 77 1 Year 2 Year -12.30% 80 76 -5.73% 66 -13.22% $50,000 427 9.63% 82.1 89.6 76.5 79.0 50.0 and less $50,001 338 7.62% 76.0 76.6 72.3 107.9 112.0 $75,000 $75,001 467 10.53% 68.3 74.6 63.6 79.9 116.0 $100,000 $100,001 1,141 25.74% 56.9 66.3 53.6 63.9 48.6 $150,000 $150,001 884 19.94% 59.9 74.6 56.2 60.9 67.8 $200,000 $200,001 720 16.24% 68.2 91.1 68.7 62.9 62.0 $300,000 $300,001 456 10.29% 70.1 46.4 76.4 72.8 65.5 and up Average Closed DOM: Total Closed Units: Total Closed Volume: 65.8 4,433 749,841,866 76.0 871 107.97M 61.6 2430 353.40M 67.0 1033 256.40M 64.8 99 32.07M Reports produced and compiled by R E S T A T S I n c . Information is deemed reliable but not guaranteed. Does not reflect all market activity. pp. 6 Steve Reese - Vice President of Marketing 405-848-9944 steve@okrealtors.com
- 8. Monthly Inventory Analysis OKLAHOMA ASSOCIATION OF REALTORS® May 2014 Closed Sales as of Jun 11, 2014 Average List Price at Closing Average List Price Ready to Buy or Sell Real Estate? Contact an experienced REALTOR® Data from the Area Delimited by Entire OK State MLS - Single-Family Property Type Report Produced on: Jun 12, 2014 MAY YEAR TO DATE (YTD) +0.69% +0.32% 5 YEAR MARKET ACTIVITY TRENDS 5yr MAY AVG = 164K 3 MONTHS High Jul 2013 = 176,722 Low Jan 2010 = 138,948 Average LPrice this month at 173,555, above the 5 yr MAY average of 164,270 MA R AP R MAY Jun 2010 Dec 2010 Jun 2011 Dec 2011 Jun 2012 Dec 2012 Jun 2013 Dec 2013 AVERAGE LIST PRICE OF CLOSED SALES & BEDROOMS DISTRIBUTION BY PRICE 200,000 100,000 0 Distribution of Average List Price at Closing by Price Range % AVL$ 2 Beds 3 Beds 4 Beds 5 Beds+ 2010 152,484 2011 159,050 2012 163,904 2013 172,358 2014 173,555 1 Year 2 Year +5.89% 2010 146,175 2011 151,632 2012 154,424 2013 164,703 2014 165,231 1 Year 2 Year +7.00% 166,057 166,011 -0.03% 173,555 4.54% $50,000 398 8.98% 33,266 34,789 35,375 39,204 31,050 and less $50,001 335 7.56% 65,157 67,254 66,682 72,758 59,900 $75,000 $75,001 466 10.51% 89,704 90,606 92,038 92,423 99,833 $100,000 $100,001 1,117 25.20% 129,013 131,943 130,332 134,285 133,011 $150,000 $150,001 908 20.48% 174,553 176,663 175,574 180,327 181,433 $200,000 $200,001 742 16.74% 245,041 245,032 244,486 251,215 254,135 $300,000 $300,001 467 10.53% 445,559 437,385 413,956 461,910 463,708 and up Average List Price: Total Closed Units: Total List Volume: $173,555 4,433 769,367,233 $128,396 871 111.83M $149,225 2430 362.62M $253,576 1033 261.94M $333,059 99 32.97M Reports produced and compiled by R E S T A T S I n c . Information is deemed reliable but not guaranteed. Does not reflect all market activity. pp. 7 Steve Reese - Vice President of Marketing 405-848-9944 steve@okrealtors.com
- 9. Monthly Inventory Analysis OKLAHOMA ASSOCIATION OF REALTORS® May 2014 Closed Sales as of Jun 11, 2014 Average Sold Price at Closing Average Sold Price Ready to Buy or Sell Real Estate? Contact an experienced REALTOR® Data from the Area Delimited by Entire OK State MLS - Single-Family Property Type Report Produced on: Jun 12, 2014 MAY YEAR TO DATE (YTD) +1.42% +0.65% 5 YEAR MARKET ACTIVITY TRENDS 5yr MAY AVG = 159K 3 MONTHS High Jul 2013 = 171,683 Low Jan 2010 = 133,317 Average SPrice this month at 169,150, above the 5 yr MAY average of 159,023 MA R AP R MAY Jun 2010 Dec 2010 Jun 2011 Dec 2011 Jun 2012 Dec 2012 Jun 2013 Dec 2013 AVERAGE SOLD PRICE OF CLOSED SALES & BEDROOMS DISTRIBUTION BY PRICE 200,000 100,000 0 Distribution of Average Sold Price at Closing by Price Range % AVS$ 2 Beds 3 Beds 4 Beds 5 Beds+ 2010 147,462 2011 153,080 2012 158,640 2013 166,785 2014 169,150 1 Year 2 Year +6.62% 2010 141,019 2011 145,409 2012 148,837 2013 159,278 2014 160,313 1 Year 2 Year +7.71% 161,154 161,381 0.14% 169,150 4.81% $50,000 427 9.63% 31,956 30,682 32,425 35,709 32,995 and less $50,001 338 7.62% 64,034 64,201 63,955 64,402 51,000 $75,000 $75,001 467 10.53% 88,511 87,608 88,812 88,248 98,467 $100,000 $100,001 1,141 25.74% 127,814 127,839 127,447 130,158 129,333 $150,000 $150,001 884 19.94% 173,681 172,083 172,481 177,058 173,783 $200,000 $200,001 720 16.24% 242,937 238,323 239,572 246,580 247,723 $300,000 $300,001 456 10.29% 436,259 426,836 398,577 452,597 451,068 and up Average Closed Price: Total Closed Units: Total Closed Volume: $169,150 4,433 749,841,866 $123,961 871 107.97M $145,434 2430 353.40M $248,210 1033 256.40M $323,914 99 32.07M Reports produced and compiled by R E S T A T S I n c . Information is deemed reliable but not guaranteed. Does not reflect all market activity. pp. 8 Steve Reese - Vice President of Marketing 405-848-9944 steve@okrealtors.com
- 10. Monthly Inventory Analysis OKLAHOMA ASSOCIATION OF REALTORS® May 2014 Closed Sales as of Jun 11, 2014 Average Percent of List Price to Selling Price Average List/Sell Price Ready to Buy or Sell Real Estate? Contact an experienced REALTOR® Data from the Area Delimited by Entire OK State MLS - Single-Family Property Type Report Produced on: Jun 12, 2014 MAY YEAR TO DATE (YTD) +0.53% +0.17% 5 YEAR MARKET ACTIVITY TRENDS 5yr MAY AVG=96.73% 3 MONTHS High May 2014 = 97.43% Low Jan 2011 = 95.22% Average List/Sell this month at 97.43%, above the 5 yr MAY average of 96.73% MA R AP R MAY Jun 2010 Dec 2010 Jun 2011 Dec 2011 Jun 2012 Dec 2012 Jun 2013 Dec 2013 AVERAGE L/S% OF CLOSED SALES & BEDROOMS DISTRIBUTION BY PRICE Distribution of Average L/S % by Price Range % AVL/S% 2 Beds 3 Beds 4 Beds 5 Beds+ 2010 96.78% 2011 95.96% 2012 96.58% 2013 96.91% 2014 97.43% 1 Year 2 Year +0.87% 2010 96.39% 2011 95.62% 2012 96.00% 2013 96.55% 2014 96.71% 1 Year 2 Year +0.74% 96.58% 96.87% 0.30% 97.43% 0.57% 98 97 96 95 $50,000 427 9.63% 91.78% 89.58% 93.28% 92.57%109.33% and less $50,001 338 7.62% 97.51% 95.75% 99.46% 90.28% 85.14% $75,000 $75,001 467 10.53% 96.88% 96.86% 96.99% 96.04% 98.63% $100,000 $100,001 1,141 25.74% 97.70% 97.12% 97.92% 97.17% 97.67% $150,000 $150,001 884 19.94% 98.22% 97.59% 98.32% 98.37% 96.08% $200,000 $200,001 720 16.24% 98.11% 97.47% 98.12% 98.28% 97.45% $300,000 $300,001 456 10.29% 99.93% 97.58% 96.84%102.29% 97.83% and up Average List/Sell Ratio: Total Closed Units: Total Closed Volume: 97.40% 4,433 749,841,866 95.41% 871 107.97M 97.60% 2430 353.40M 98.68% 1033 256.40M 97.94% 99 32.07M Reports produced and compiled by R E S T A T S I n c . Information is deemed reliable but not guaranteed. Does not reflect all market activity. pp. 9 Steve Reese - Vice President of Marketing 405-848-9944 steve@okrealtors.com
- 11. Monthly Inventory Analysis OKLAHOMA ASSOCIATION OF REALTORS® May 2014 Inventory as of Jun 11, 2014 Market Summary Data from the Area Delimited by Entire OK State MLS - Single-Family Property Type Report Produced on: Jun 12, 2014 Inventory Inventory Market Activity Market Activity New Listings Closed Sales Pending Sales Other Off Market Active Inventory 6,892 = 25.59% Start Inventory 20,036 Total Inventory Units 26,928 Volume $5,548,975,560 4,433 = 14.15% 4,746 = 15.15% 2,070 = 6.61% 20,088 = 64.10% Absorption: Active Inventory 3,652 20,088 MAY Year To Date 2013 2014 +/-% 2013 2014 +/-% Last 12 months, an Average of Sales/Month as of May 31, 2014 = Closed Sales Pending Sales New Listings Average List Price Average Sale Price Average Percent of List Price to Selling Price Average Days on Market to Sale Monthly Inventory Months Supply of Inventory 4,204 4,433 5.45% 4,156 4,746 14.20% 6,729 6,892 2.42% 172,358 173,555 0.69% 166,785 169,150 1.42% 96.91% 97.43% 0.53% 71.38 65.78 -7.84% 22,249 20,088 -9.71% 6.33 5.50 -13.16% 17,153 17,115 -0.22% 19,553 20,491 4.80% 31,950 31,933 -0.05% 164,703 165,231 0.32% 159,278 160,313 0.65% 96.55% 96.71% 0.17% 79.46 76.85 -3.29% 22,249 20,088 -9.71% 6.33 5.50 -13.16% 2013 2014 MAY MARKET AVERAGE PRICES New Listings Pending Listings List Price Sale Price 2013 2014 4,746 +14.20% 2013 2014 169,150 +1.42% 2013 2014 4,156 172,358 166,785 173,555 +0.69% INVENTORY AVERAGE L/S% & DOM 6,729 6,892 +2.42% Active Inventory Monthly Supply of Inventory % of List to Sale Price Days on Market to Sale 22,249 6.33 20,088 -9.71% 5.50 -13.16% 96.91% 97.43% 71.38 +0.53% 65.78 -7.84% Reports produced and compiled by R E S T A T S I n c . Information is deemed reliable but not guaranteed. Does not reflect all market activity. pp. 10 Steve Reese - Vice President of Marketing 405-848-9944 steve@okrealtors.com