More Related Content Similar to CriticalAnalysisofSustainableHeatingElectricalandEfficiencyRetrofitOptionsforaLocalBoardingSchoolinEasternNewYork Similar to CriticalAnalysisofSustainableHeatingElectricalandEfficiencyRetrofitOptionsforaLocalBoardingSchoolinEasternNewYork (20) 1. Critical Analysis of Sustainable Heating, Electrical, and Efficiency Retrofit Options
for a Local Boarding School in Eastern New York
Executive Summary (NG)
An energy, financial, and environmental analysis were conducted for a boarding
school on the border of New York and Massachusetts. Several different technologies
were identified and proposed for implementation with the goals of cutting energy costs,
while displaying the school’s awareness of the positive effects associated with efficient
and environmentally conscious energy technologies. Through the analysis of these
technologies the best retrofit options were identified and compiled into a final proposal.
1. Introduction
a. Goals/Objectives (PW)
The objectives of this analysis are to propose retrofits to the client’s
energy infrastructure that minimize costs, increase the share of renewable energy
in the client’s energy profile, and reduce harmful emissions. The client, a
boarding school in Eastern New York, has already incorporated into their campus
small scale wind turbines on their new science building, a modular solar panel,
and a living machine. Which further suggests the client’s desire to increase the
sustainability of their campus. In order to accomplish these objectives, all options
considered were renewable technologies with the primary determinant of
investment strength being cost minimization and the ancillary determinant being
emissions reductions. The scope of this analysis includes an assessment and
retrofit proposal for heating the Library, Dairy Barn, Wickersham, Brethrens,
Medicine, Neale, and Whittaker. There will be also an assessment and retrofit
proposal for lighting throughout the client’s campus and a proposal for
implementing photovoltaic (PV) panels.
It is important to note that the technologies already implemented by the
client and those proposed herein have an educational value for the students. This
is not a value accounted for in the following investment analysis yet the added
educational opportunity, however incorporeal, is a very real benefit. This value
therefore should be taken into consideration by the client before implementing
any aspect of this analysis and proposal.
b. Constraints/Boundaries (PW)
For this analysis the range of technology options was constrained by the
client’s desire to maintain the historical aesthetics of the campus. This limited the
viability of proposing such technologies as wind turbines or solar panels. The
subsequent analysis was further constrained by the limited amount of information
2. provided by the client. Since no building envelope specifications were provided,
no assessment of insulation or window retrofits could be completed. Therefore,
all retrofits considered were strictly replacement of current systems.
The boundary for the following energy and financial analyses are defined
as the client’s delivered energy, which was provided in the form of energy bills.
The boundary for the environmental analysis was extended to include primary
energy to account for total emissions for fuel combustion. The environmental
analysis; reporting on the emissions of particulate matter, carbon dioxide, carbon
monoxide, nitrogen oxides, and and sulfur dioxide, focuses solely on the flow of
usable energy from primary energy source to consumption by the client. The
impacts from the extraction, refinement, and delivery of fuel were excluded due to
the degree of uncertain that accompany such situationally specific information.
These embodied energy values were excluded for all fuel types including wood
chips because of the difficulty involved in quantifying the sustainability of
extraction or harvest as well as the transportation distances that accompany such
situationally specific values. These factors could be further studied for a broader
emissions boundary.
c. Assumptions (MO, PW)
The assumptions of this analysis are the conversion factors used to
complete the analysis. Constant conversion factors are important to create an
equal comparison between buildings. The major assumptions used for the baseline
analysis are the BTU (British Thermal Unit) conversions: one gallon of fuel oil #
2 equals 138,000 BTU, one gallon of propane equals 83,600.64 BTU, one kWh of
electricity equals 3,412 BTU, and one ton of wood pellets equals 16,400,000
BTU. The assumptions for the financial analysis include a discount rate of 5% and
escalations rates for the price of each energy source, 3% for fuel oil, propane, and
electricity, 2% for wood chips and pellets, and 1.5% for electricity purchased
through a power purchase agreement (PPA). From these baseline assumptions
further calculations and analysis can be performed, any other specific assumptions
for a scenario are stated in the appropriate section.
2. Overview of the Baseline Energy Profile (NG MO)
To establish a baseline for energy use for space heating and domestic hot
water, an analysis was done for all of the buildings independently first. Financial
records from the boarding school were obtained and separated into heating and
electricity for each building. For the heating there were two types of fuel: fuel oil
and propane. From the records the amount of gallons per delivery per month were
found along with the price. Using this and known conversion factors such
1
3. quantitative factors were found such as BTU, mmBTU, $/mmBTU, and
mmBTU/sq ft. For the electricity data the financial records needed more
preprocessing. Some bills included unnecessary information such as power to
outdoor lighting and some were recorded in an incorrect order. For the cost of the
electricity the school had a two part bill, one part showing the cost for the kWh
and one part for the delivery. These costs were added together for the total cost
and from there BTU, mmBTU, and $/mmBTU were found. The sum of the annual
costs and mmBTU’s are important factors when trying to establish the current
system and what a new system would need to match or exceed.
To better understand the energy needed to heat the buildings on a
monthtomonth basis, Heating Degree Days (HDD) from Albany, NY were
averaged over a 30 year time period, which was found on the Cornell NECC
website. The monthly HDD values could then be divided by the 30 year average
annual HDD value to determine the percentage of HDD days per month. This
percentage allowed for school specific fuel usage per month data to be obtained
by multiplying the percentage by the monthly fuel consumption of each of the
buildings proposed for a system change. After converting fuel usage to btu/hr and
kWh to more easily compare to biomass boiler outputs, the peak month was
chosen to ensure that even in unusually coldest months the central biomass boiler
will be able to supply 75% of the heat before utilizing the in place fuel oil
furnaces with hydronic distribution, and the building individual boilers will be
able to supply 100% of the heating demand.
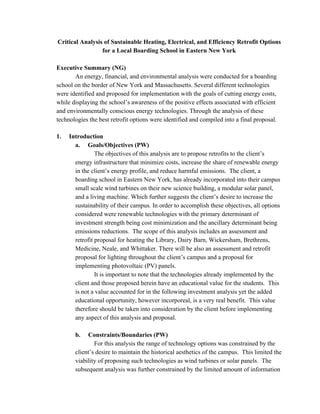
Figure 1: Current energy consumption of campus buildings broken up by
energy type
b. Baseline Environmental Assessment (RH and PW)
The boundaries of this study contains the on site system. The source of the
wood chips is excluded because many factors such as the sustainability of the tree
2
4. harvesting and the transportation distance cannot be quantified. These factors
could be further studied for a broader emission boundary. The lbs of carbon
dioxide, particulate matter, carbon monoxide, nitrogen oxides , and sulfur dioxide
are different for biomass and fossil fuel boilers. For current useage, Bretherans is
the only building that is heated by propane. The Library, Dairy Barn, and
Wickersham buildings are all currently run on heating oil. The current energy
usage of propane is 605 mmBtu annually and the heating oil usage is 6,779
mmBtu.
The particulate matter from a propane boiler is estimated to emit 0.004
pounds of pm10 (particulate matter up to 10 micrometers in size) per mmBtu,
0.021 pounds of CO (carbon monoxide) per mmBtu, 0.154 pounds of nitrogen
oxides/ dioxides per mmBtu, 0.016 pounds of sulfur dioxide per mmBtu, 137
pounds of carbon dioxide per mmBtu. For a heating oil boiler, the emissions are
0.014 pounds of PM10 per mmBtu, 0.035 mmBtu of CO per mmBtu, 0.143
pounds NOx per mmBtu, 0.5 pounds SO2 per mmBtu,159 pounds of CO2 per
mmBtu [24]. Currently, Brethrens emits approximately 2.42 pounds of PM10,
12.7 pounds of CO, 93.17 pounds of NOx, 9.68 pounds of SO, and 82,891.85
pounds of CO2 annually. The library, Dairy Barn, and Wickersham currently
emits 94.9 pounds of PM10, 237.3 pounds of CO, 969.4 pounds of NOx, and
3,389.5 pounds of SO2 and 848,543.22 pounds of CO2 annually. The sum
emissions between the propane and heating oil boiler emissions are 97.3 pounds
of PM10, 250 pounds of CO, 1,062.57 pounds of NOx, 3,399.28 pounds of SO2
and 1,173,256.861 pounds of CO2 annually.
The same emission rates (lbs/mmBTU) that were applied to the central
boiler were used to calculate the emissions produced by Medicine, Neale, and
Whittaker as well. The existing boiler system in Medicine was found to emit
6.448 lbs of PM10, 16.12 lbs of CO, 65.862 lbs of NOx, and 230.288 lbs of SO2,
and 73,231.425 lbs of CO2 annually. The existing boiler system in Neale was
found to emit 10.654 lbs of PM10, 26.635 lbs of CO, 108.821 lbs of NOx,
380.494 lbs of SO2, and 120,996.965 lbs of CO2 annually. The existing boiler
system in Whittaker was found to emit 6.029 lbs of PM10, 15.072 lbs of CO,
61.582 lbs of NOx, 215.321 lbs of SO2, and 68,472.205 lbs of CO2 annually.
The same environmental impact was also found for electricity
consumption on campus as well as for the most common light bulb currently used
by the client. The emissions from electricity consumption is reported on a per
kilowatt basis to exemplify the environmental benefit not only for replacing grid
power with emissions free renewables like PV but also to illustrate the
environmental benefit of reducing electricity consumption from behavioral and
usepattern changes. Behavioral and usepattern changes are not assessed further
3
5. in this proposal and are only brought to attention here to make known the
environmental benefit such initiatives could have on the client’s environmental
impact. A single kilowatthour (kWh) consumed was found to emit 0.00046 lbs
of NOx, 0.0008 lbs of SO2, and 0.6299 lbs of CO2 were emitted. It is important
to note that these emissions values for a single kWh consumed are not annual
quantities and therefore may appear to have a smaller impact than they actually
do. A single 32 watt Philips T8 light bulb was found to emit 0.439 lbs of NOx,
0.766 lbs of SO2, and 604.792 lbs of CO2 annually.
3. Central Boiler Retrofit
a. Building’s Existing Energy Profile for Central Biomass Boiler (NG)
Brethrens, Wickersham, the Dairy Barn, and the Library are some of the
school's largest users of fuel oil or propane for space heating and domestic hot
water. Their current energy demands and proximity to each other are important
factors indicating that they would be good candidates for a central system
application. The table below indicates that the during the peak months 2 mmBTU
or 585 kW is necessary to heat Brethrens, the Dairy Barn, Wickersham, and the
Library.
Table 1: Current energy demands for the for Brethrens, Wickersham, the Dairy Barn,
and the Library during the month of January.
The four buildings have an even distribution of heating demands throughout the months
when looking at the 2013 billing period.
4
6.
Figure 2: Current energy demands for the for Brethrens, Wickersham, the Dairy Barn,
and the Library throughout the year of 2013.
b. Technology of Boiler Systems (RH)
There are two main biomass conversion technologies that are used for
space heating. These two technologies are direct fired combustion and
gasification systems. Direct fired systems has the biomass augured into the
combustion chamber and the biomass is combusted with the suitable temperature
and oxygen requirements to get as close to complete combustion as possible. The
closer to complete combustion of the biomass; the more efficient, lower
emissions, and fewer systems problems the system will have [3].
Gasification systems work in a similar fashion to direct fired combustion.
The biomass is augured into the combustion chamber but instead of complete
combustion, the biomass is heated to the point where the gasses within the
biomass are released. These gasses are called syngas, which are then ignited by a
secondary heated air in a separate chamber. This process theoretically leads to
higher efficiency ratings than a direct boiler, and also leads to a more reliable
system in regards to more complete combustions and less system problems. Both
these systems have similar methods of biomass storage, where the chips can be
automatically augured into the combustion chamber [3].
c. A Central Biomass Boiler with Hydronic Distribution (NG)
When considering heating possibilities for the centrally located area of
campus, buildings with a high demand have the possibility to use one large
centralized biomass boiler, which in conjunction with a hydronic heating
distribution system can be an efficient way to provide heat. Systems like this are
5
7. popular in Europe where oil prices are higher, however savings are likely in
energy and therefore finances when heating the four highenergy use buildings on
the private school being analyzed can still be seen [24].
The general layout of a centralized system starts with thermal energy
generation. A centralized system uses one or more central plants to provide
thermal energy to multiple buildings. The next step involves thermal energy
transmission and distribution. The heat is distributed from the central plant to the
buildings via insulated underground pipes [29]. The distribution pipe is usually in
the form of a thinwall of welded steel with a layer of foam and plastic to decrease
heat loss when in transmission, and is buried about 3 feet deep to help shield the
pipe from the variable and sometimes colder air temperatures [24]. Once at the
building energy transfer occurs from the pipes to air space in the building often
through low temperature hydronic heat emitters [29]. After the heat is extracted
from the water it is returned to the plant to be heated again. Understanding that a
centralized system will use pumps powered by electricity, variable speed pump
controls are used to help cut the electricity necessary for the movement of the
water [24].
d. Advantages of a Centralized Biomass Boiler (NG)
Many advantages can be seen when using one boiler instead of a multitude
of smaller boilers when supplying heat. Air quality improvements can be seen
when using a centralized system with one emission stack instead of multiple. The
area surrounding the boiler can be better monitored in a more controllable
environment than multiple individual systems within individual buildings [24].
Reliability and ease of operation is improved with a centralized system. Fuel
delivery is to one location, offering savings on delivery costs. Service and
maintenance all happens at one place as well, making it easier for the staff
operating the equipment to make adjustments and fixes without running to
different locations, which saves time and money. With the central plant located at
a separate location than the buildings, the removal of the old systems to make
space is not necessary, allowing these systems to act as a backup when service is
needed for the centralized boiler.
Increased safety can also be a benefit to a centralized system. The risk of
carbon monoxide poisoning, fire, and other combustion hazards are only prevalent
at the central plant, where this can be better monitored [24]. The buildings being
heated have virtually none of the risks that can be associated with any building
that has an independent heating system.
6
8. e. Sizing the Centralized Biomass Boiler (NG)
When determining a system out of the wide range that are now available
in today’s markets, it’s important to eliminate systems that will not meet the
energy demands of the four buildings being supplied. Two of the building's
current heating infrastructure will be left in place to serve as a backup if the
boilers cannot meet the highest peak energy demands. To achieve an increase in
efficiency, simplicity, and reliability, 75% of peak demand will be met by the
central biomass boiler for some of the school’s buildings highest energy users.
This will be more cost effective than sizing a system to meet 100% of peak
demand, a level of demand that may only occur in one month out of the year. At
times of high demand, the central plant’s thermal storage may act as a buffer to
increase output, or work effectively at the opposite end of the spectrum in low
demand periods to allow for better efficiency. This is accomplished by allowing
the boilers to run at full capacity, and therefore higher efficiency to create thermal
storage. The central boiler’s hydronic distribution system will replace
Wickersham's and Brethren’s original steam distribution heating systems, and no
longer require the use of the Dairy Barn’s and the Library’s fuel oil furnaces for
the majority of the year. The central location will ideally be placed an equal
distance from each building eliminating long transmission, while still having the
ability to be easily accessed by a biomass delivery truck.
f. Central Biomass Boiler Options Based on Energy Demand (NG, RH)
A couple options are available for supplying heat to the four central
buildings. The main decision to be made is whether one large boiler or the
combined output of three smaller boilers will be used to supply the necessary
heat. Froling and Chiptec will be the two biomass boiler companies analyzed as
options for a central biomass boiler. Chiptec’s PhoenixSeries provides enough
output to use only one boiler, while the Froling T4 boilers will need three boilers
to supply the needed output in times of peak demands. Both have their advantages
and disadvantages when looking at an energy perspective.
Chiptec’s PhoenixSeries can provide the targeted 75% energy demand
during peak months of 2 mmBtu/hr with a 1.5 mmBtu/hr system. The 4,000
gallon thermal storage tank will provide the remaining 25% of the peak demand.
For the Chiptec boiler, the 4,000 gallon thermal storage tank could supply the
buffer amount of 491,310 Btu/hr for 8.8 hours. For the Froling boiler systems, the
4,000 gallon thermal storage tank could supply the buffer amount of 455,910
Btu/hr for 9.5 hours. In theory, the thermal storage tanks will be heated during the
warmer times of the day, when the boiler energy output exceeds the peak demand,
7
10. The Froling system will consist of three T4 boilers to meet the demands.
The advantage of three boilers is that they can individually run at full capacity
more often than one large system can. One 511,800 Btu/hr boiler will be able to
cover any domestic hot water demands in the summer and very early and late
shoulder season months, which can be considered as September and May. A
second 511,800 Btu/ hr boiler will be able to cover the middle of the shoulder
seasons , and the three T4 boilers at 511,800 Btu/ hr systems combined will cover
most of the demands during the winter months, accomplished by using three T4
boilers producing 511,800 Btu/ hr with a combined total of 450 kW. See Figure 4
for clarification. Three of these systems supply 77 percent of the energy demand
for the peak month of january, 90 percent for December, and 93 percent for
February. The energy demand for the rest of the months, March through
November, would be covered completely by the three T4 systems.
Figure 4: A detailed breakdown of how three Froling T4 biomass boilers can
cover demand throughout the year and up to 75% of the peak demand during the
coldest months.
Since three boilers are proposed, the amount of boilers that need to be
turned on is contingent to the amount of energy needed. For instance, if 511,000
Btu/hr is needed, than only one 511,000 Btu/hr boiler is needed, but if 1,000,000
Btu/hr is needed, than two 511,000 Btu/hr boilers would need to be turned on.
The use of multiple boilers, improves efficiency compared to one system, such as
the Chiptec phoenix series boiler.
9
11. Financial (Analysis of baseline and retrofit scenarios)
g. Pricing Points for Centralized System (NG, RH)
Financially a central plant may be less expensive than multiple
independent boilers. The cost of a large biomass boiler will be more expensive
than a smaller one, but the price of each additional smaller boiler to match the
BTU output of the one larger biomass boiler will begin to add up. Central
operation and maintenance cost will be lower than a distributed system. This cost
can be estimated annually as 1% of the total investment in the system [6]. The
distribution of the heated water from the central biomass building to the buildings
being connected to the hydronic distribution pipes will add costs not seen in a
individual building boiler system.
The pricing for one Froling T4 511,800 Btu/ hr boiler is $60,000 to
$70,000. The total cost for the three boilers will range from $180,000 to
$210,000. The installation cost is estimated to be 20% of the hardware costs;
therefore installation costs would range from $36,000 to $42,000.
Thermal storage of the system was sized based off of a recommendation of a
TARM Biomass representative. For a system of this size, a 4,000 gallon thermal
storage tank was recommended. The tank is estimated to be $20,000 with
installation. Two thermal storage tank manufacturers by the name of John Wood
and Wessels were recommended by the proffesional at TARM Biomass [31].
New York Energy Research and Development Authority (NYSERDA)
offers incentives for both the Chiptec and three tandem boiler options. Thermal
storage has to be included with the boiler in order to receive the incentive. A
minimum of 2 gallons per 1000 Btu/hour of boiler output capacity is required. For
the 1.5 mmBtu/hr Chiptec, a 40% discount is offered, with a maximum incentive
of 200,000 dollars. For the three Froling boilers that have a sum thermal output
capacity of 1.53 mmBtu/hr, a 45% discount of the initial capital cost of the boilers
and thermal storage. The 4,000 gallon tank exceeds the minimum thermal storage
amount needed for each incentive. Therefore, the the incentive offers for both can
be used for both the Chiptec and Froling boiler options [10]
Wickersham and Brethrens will need to be retrofitted to accept the
hydronic distribution system instead of the steam piping distribution and radiators
in place. The cost for the conversion can be estimated at 3 dollars/sqft [26]. This
price point is derived from looking at the costs of using a hydronic system in a
residential sized building that needs a pump, radiators, and piping. When using
this price the total cost of conversion for Wickersham and Brethrens can be
estimated to be around $121,722.
Putting the distribution lines in will be cheaper than installing independent
biomass boilers. It is important to size pipes to meet peak demands to not limit the
10
12. output of the system. When looking for a price range, factors like the diameter
and material of the pipes along with the location of the installation impacted by
soil characteristics and contracting costs provide for a lot of variability. A range
from $930/trench meter to $2,670/trench meter can be referenced from the
Community Energy Association [30]. The reference guide notes that the range
includes suburban installations, which tend to have higher installation values.
Given the school is in a rural area we can safely choose an average value of
$1800/trench meter.
A building to house the central boiler(s) will have to be constructed. The
building will have to be able to be accessed for deliveries, be capable of the
storage necessary for either chips or pellets, and hold the thermal storage, heat
exchangers, and pumps. A feasibility assessment for a district biomass boiler by
the Biomass Energy Resource Center reported that that in New York it would cost
around 250 dollars/sqft for a prefabricated steel structure with a below grade
storage bin [24]. A 45 tonne storage unit would be required for the 1.99 MMBTU
system; requiring a 35ft by 15ft with a depth of 10ft [27].
Therefore the square footage of the structure for a woodchip bunker would
need to be 525 sqft. The boiler needs a room size of 11ft by 7ft by 7 ft. The
boiler’s square footage would be 77 feet squared. A thermal storage tank of 4,000
gallons would be approximately 20 ft by 6ft in diameter and be 120 feet squared.
With the bunker sized to 525 sqft, a boiler room of 77 sqft, a thermal storage unit
requiring 120 sqft, the consideration of piping and space for maintenance
estimated at 150 sqft, the total building size to accommodate this size system is
estimated to be 872 square feet. This gives an estimated cost of the 872 sqft
structure of $218,000 at $250/ sqft.
Table 2: Summary of costs of central biomass Chiptec boiler heating distribution
system.
Price Point Cost
Phoenix Boilers $250,000.00
Thermal Storage Tank $20,000.00
Boilers + Storage Tank After Incentives
(Chiptec)
$162,000.00
Installation of Boilers $54,000.00
11
13. Chiptec Feeding System $10,000.00
Piping and Installation (1,800
dollars/meter)
$270,000.00
Steel Frame Building with Storage (250
dollars/sqft)
$218,000.00
Building Conversion from Steam to
Hydronics (3 dollars/sqft)
$46,170.00
O & M 1% of Investment per Year $10,454.20
Total $820,722.20
Table 3: Summary of costs of central biomass Froling boilers heating distribution
system.
Price Point Cost
3T4 Boilers $195,000.00
Thermal Storage Tank $20,000.00
Boilers + Storage Tank After Incentives (Froling) $118,250.00
Installation of Boilers $39,000.00
Torsion Arm Agitator $10,000.00
Piping and Installation (1,800 dollars/meter) $270,000.00
Steel Frame Building with Storage (250 dollars/sqft) $218,000.00
Building Conversion from Steam to Hydronics (3
dollars/sqft)
$46,170.00
O & M 1% of Investment per Year $10,454.20
Total $701,420.00
12
15. chips are delivered in a 30 tonne loads. Each load would contain estimated 327
mmBtu of wood chips, at 10.9 mmBtu/tonne.
For the three Froling systems, each running at 75 percent efficiency,
approximately 5 truck loads of wood chips would be needed to be delivered to
supply the school’s demand. Annually, just under 23.3 loads of wood chips would
be needed to be delivered to the school.
For the Chiptec boiler running at 76 percent efficiency, approximately 5
truck loads of wood chips would be needed to be delivered to supply the school's
energy needs. Annually, 23 truck loads of wood chips would need to be delivered.
The volume needed for the storage of wood chips is greater than either
wood pellets or the current fossil fuel system. This is due to the energy density of
the fuels. Wood chips have a higher moisture content and bulk density than wood
pellets, leading to a lower energy density. Delivery of the biomass also has to be
considered. The delivery trucks hold 30 tonnes. Assuming that the trucks will
deliver 30 tonnes, the bunker should be sized to hold 45 tonnes so when the
bunker is a third the way full, a delivery can be made. A 45 tonne bunker for
wood chips will be 35ft by 15ft, with a depth of 10ft.
Finally, to calculate the size of which each storage unit for each building
was need the peak month of fuel usage was used. Depending on the type of fuel
(chips or pellets) and the efficiency of the wood boiler the size of the bunker
varied. We also contacted a professional from Tarm biomass to figure out prices
for the systems, the efficiencies for the systems and a recommended size and
boiler for each building.
j. Centralized Woodchip Boiler Environmental Assessment (RH)
The wood chip boilers would replace all propane and heating oil of the
target buildings, thus the woodchip boilers would use 7,384 mmBtu annually. The
woodchip boiler would emit 0.1 pounds of PM10 per mmBtu, 0.73 pounds of CO
per mmBTU, 0.165 pounds of NOx per mmBTU, 0.0082 pounds of SO2 per
mmBtu, and 220 pounds of CO2 per mmBtu [24].
For the Chiptec boiler with a 76% efficiency, the annual PM10 amount
would be 776 pounds, the annual CO amount would be 5,666 pounds, the annual
NOx would be 1,281 pounds, the SO2 annual amount would be 64 pounds and the
annual CO2 would be 1,707,474 pounds. If the fossil fuel systems were replaced
by the Chiptec boiler, emissions of PM10 would rise 679 pounds, CO would rise
5416 pounds, NOx would increase 218 pounds, SO2 would decrease by 3,335
pounds CO2 would increase by 534,217 pounds.
For the three Froling boilers with a 75% efficiency, the annual PM10
amount would be 786 pounds, the annual CO amount would be 5,741 pounds, the
14
16. annual NOx would be 1,298 pounds, the SO2 annual amount would be 64 pounds
and the annual CO2 would be 1,730,240 pounds. If the fossil fuel systems were
replaced by the Chiptec boiler, emissions of PM10 would rise 689 pounds, CO
would rise 5491 pounds, NOx would increase 236 pounds, SO2 would decrease
by 3,334 pounds CO2 would increase by 556,983 pounds. The increase in these
emissions can lead to adverse health effect, according to the Environmental
Protection Agency [20].
Figure 5:Annual Emission Differences for Centralized Buildings when Fossil Fuel
Boilers are changed to woodchip boiler(s)
k. Emission Control Technologies (RH)
There are a variety of postcombustion air emission control systems that
are available to reduce the amount of PM10, NOx, SO2. These control systems
vary in function, cost, and control efficiency. There are multiple control
technologies available. MultiCyclones, Baghouses, wet/dry scrubbers and
Electrostatic Precipitators are some of the technologies that effectively reduce
emissions. These systems are available, yet not common for this size system.
A Tarm Biomass representative was contacted for information on
emission control technologies. It was suggested that no emission control systems
were needed for either of the centralized boiler systems [31]
4. Residential Boiler Retrofit (PW and MB)
Additional to the above assessment for a centralized biomass boiler
system, the other end of the spectrum was assessed to realize any potential benefit
from retrofitting smaller buildings that account for only a small portion of the
15
19.
b. Sizing and Pricing of the Residential Boilers (PW and MB)
For this application the energy advising team chose to consider the Froling
T4 boiler based on the aforementioned research for the centralized boiler system
and the T4 boiler’s ability to combust either pellets or wood chips. This boiler’s
dual fuel source capability allows the client to combust the least expensive, most
convenient and accessible fuel source while leaving them with the option of
combusting the alternative biomass fuel if so desired. Furthermore, automatic
ignition, combustion control, and selfcleaning capabilities of this boiler minimize
its operation and maintenance requirements and costs. This boiler has a compact
structure, allowing it to replace the existing boiler without any spatial requirement
issues [11].
The capacity range of the Froling T4 boiler models ranges from 24/30 kW
to 130/150 kW, which converts approximately to a range of 82,000 Btu to
512,000 BTU [11] To satisfy the heat loads of these buildings the boilers chosen
must be able to meet peak demand. In this case the three buildings have such
small peak loads that the smallest T4 boiler size, 24/30 kW, will satisfy the
requirements for Medicine and Whitaker and the second smallest T4 boiler, 40/50
kW, will satisfy the requirements for Neale. It was determined from contact with
a vendor that such a systems could be expected to cost approximately $45,000 for
Medicine and Whitaker and $48,000 for Neale [31]. The installation costs of these
boilers were calculated by multiplying the cost of the boiler and thermal storage
tank, before incentives, by 20%, which provided installation costs of $9,440 for
Medicine and Whitaker and $10,250 for Neale [26]. Lastly, operations and
maintenance (O&M) costs were calculated by multiplying the total investment
cost of each system by 2% [7]. This 2% O&M factor is the low end of a range
from 2% to 7% and was chosen because all three buildings are managed by the
same client who can therefore operate and maintain all three boilers
simultaneously, thus minimizing O&M costs. These O&M costs were found to be
$1,857.80 for Medicine, $2,305.00 for Neale, and $2,162.00 for Whittaker.
c. Sizing and Pricing of the Residential Boilers’ Associated Components
In addition to the boiler, this system will require a storage bunker, which
cost $250/sqft, to store wood chips or pellets and a torsion arm, which cost
$10,000, to move the biomass from the bunker to the boiler. The storage bunker
for the residential systems were sized by scaling down the dimensions of the
centralized boiler system’s bunker to hold enough tons of wood chips to supply
each building with a month’s worth of heat. For the Medicine building, the peak
18
20. month would require 9 tons of wood chips and the bunker dimensions were found
to be 10.5’x10’x10’, which would cost $26,250. Neale would require 15 tons of
wood chips to meet heating demand in the peak month and the bunker dimensions
were found to be 17.5’x10’x10, which would cost $43,750. Whittaker would
require 9 tons of wood chips to meet its heating demand in the peak month and
therefore has the same bunker size as Medicine, 10.5’x10’x10’, which would cost
$26,250.
The same NYSERDA incentive applied to the centralized boiler system,
which provides a 45% discount of the initial capital cost of the boilers and thermal
storage tanks, was also applied to the residential boiler systems. This incentive
stipulates that thermal storage must be installed with the boilers at a minimum of
2 gallons per 1000 Btu/hour of boiler output capacity [10]. The Froling T4 30 kW
boilers for Medicine and Whitaker have an output capacity of approximately
102,000 Btu/hour and therefore each require a minimum thermal storage tank size
of about 205 gallons. A 220 gallon storage tank was chosen and priced at $2,200
for each building before incentives. The Froling T4 50 kW boiler for Neale has
an output capacity of approximately 154,000 Btu/hour and therefore would
require a minimum thermal storage tank size of about 350 gallons. A 400 gallon
storage tank was chosen and priced at $3,250 [10].
The existing heat distribution piping within Whittaker uses steam to
distribute heat throughout the building that needs to be retrofitted with hydronics
piping and radiators. The cost of such a conversion can be estimated at 3
dollars/sqft and since Whittaker is a 5070 square foot building this conversion
would cost $15,210 [26].
d. Woodchip and Pellet Requirements
The quantity of woodchips and pellets required to supply the building with
the same amount of heat as fuel oil was also calculated to determine bunker size
and complete the financial analysis. This was calculated for pellets on a monthly
basis using the following equation:
wood boiler efficiency
Estimated monthly fuel usage (mmBTU)×Oil boiler efficiency
× 1.055GJ/mmBTU
18.03 GJ/ton pellets
Quantity of wood chips required for each of the buildings was calculated
on a monthly basis using the following equation:
wood boiler efficiency
Estimated monthly fuel usage (mmBTU)×Oil boiler efficiency
× 1.055GJ/mmBTU
11.52 GJ/ton chips
19
21. These equations calculate the total tons of pellets and wood chips
respectively needed to maintain the same level of heating as the existing system
on a monthly basis, which was then extrapolated to find the annual total. The
annual cost of pellets and wood chips for each build were then found by
multiplying the total annual tons required by $250/ton for pellets and $41.90/ton
for wood chips [12]. These calculations were completed for the Froling T4 boiler
for a high efficiency estimate of 87.6% and a low efficiency estimate of 75%
[12,31]. The financial analysis was completed for high and low efficiency
estimates to provide a sensitivity analysis of these boiler retrofit options.
Table 4: summary of costs of each Residential Froling system.
Cost
Building Neale Medicine Whitaker
T4 Boiler $48,000.00 $45,000.00 $45,000.00
Thermal Storage Tank $3,250.00 $2,200.00 $2,200.00
Boilers + Storage Tank
After Incentives (Froling)
$28,187.50 $25,960.00 $25,960.00
Installation of Boiler $10,250.00 $9,440.00 $9,440.00
Torsion Arm Agitator $10,000.00 $10,000.00 $10,000.00
Steel Frame Storage Bunker $43,750 $26,250 $26,250
Building Conversion from
Steam to Hydronics (3
dollars/sqft)
N/A N/A $15,210.00
O & M 2% of Investment
per Year
$2,305.00 $1,857.80 $2,162.00
Total $97,742.50 $75,707.80 $91,222.00
20
22. e. Residential Biomass Boiler Environmental Assessment
The T4 boilers for the residential buildings will replace all of the fuel oil
consumed in those buildings and therefore avoid all emissions from the
combustion of fuel oil. Any emissions from heating these buildings will now
come from the combustion of biomass in the Froling T4 boilers. For a heating oil
boiler, the emissions are 0.014 pounds of PM10 per mmBtu, 0.035 mmBtu of CO
per mmBtu, 0.143 pounds NOx per mmBtu, 0.5 pounds SO2 per mmBtu,159
pounds of CO2 per mmBTU [24]. These emissions rates were multiplied by the
current annual fuel oil consumption, in mmBTU, for each building to find the
annual quantity of each pollutant emitted. For Medicine the Froling T4 boiler was
found to emit 49.029 lbs of PM10, 358.353 lbs of CO, 80.998 lbs of NOx, 4.025
lbs of SO2, and 107,996.753 lbs of CO2. For Neale the Froling T4 boiler was
found to emit 81.108 lbs of PM10, 592.09 lbs of CO, 133.829 lbs of NOx, 6.651
lbs of SO2, and 178,438.141 lbs of CO2. For Whittaker the Froling T4 boiler was
found to emit 45.899 lbs of PM10, 335.064 lbs of CO, 75.734 lbs of NOx, 3.764
lbs of SO2, and 100,978.178 lbs of CO2. The above emissions quantities are
based off the low boiler efficiency estimates for the Froling T4 boilers and
represent a conservative estimate of emissions. Less conservative emissions
estimates were also calculated for the high boiler efficiency estimate. Both the
low efficiency and high efficiency emissions quantities were then compared to the
emissions from the existing fuel oil boilers to show the reductions in emissions.
This emissions reduction quantities are displayed in Table (5) below where the
red, negative values depict increases in emissions levels and the black, positive
values depict decreases in emissions levels.
Table 5: Annual Reduction of Emissions in Pounds
21
23. b. Photovoltaics and Wind
Introduction (JZF)
Wind and solar are two options proposed to cover the electrical demand of
the school. Both technologies have the ability to cleanly and efficiently generate
electricity throughout the year under the right conditions. It is important to know
the basics of how each system works to fully understand what conditions are
optimal for them. When it comes to installing these systems there are three factors
most owners account for. First, is the energy created by the system. How much
energy can these systems provide for the school? The economics of the system
usually combines with the energy of the system. Can the system produce the
energy in a way that is more economic than the current system? A special note to
make for this school is that they are non for profit and therefore don’t pay taxes.
Most photovoltaics system and wind turbines provide tax benefits for tax paying
customers which can affect the economics of the system for this project. Since
they cannot take advantage of benefits, a Power Purchase Agreement (PPA) will
need to be looked at. A PPA partners with a third party group to pay taxes and
take advantage of the benefits while also decreasing the cost to you. Last is the
environmental benefit of the system. If the systems can provide cleaner energy
what, environmentally, is that actually saving on emissions? All these categories
will be taken into account when researching alternative electrical generating
systems such as wind turbines or photovoltaics.
Technology of Wind Turbines and Photovoltaics (JZF)
A wind turbine, in all actuality, is a very simple machine. The blades of
the turbine are shaped and designed to create different air pressure as the wind
blows by above and below the blades. This unbalanced pressure is what cause the
turbine to spin. A large scale turbine usual spins at a speed of 3060 revolutions
per minute (rpm). This, however, is not fast enough for a generator to produce
electricity. The rotor is directly connected to a gearbox. The gearbox converts the
slow speed of 3060 rpm to 10001800 rpm which is fast enough for the generator
to produce electricity. The electricity is then sent off to the convertor which is
connected to the grid, or offgrid system. This is the basic system within a wind
turbine, but there are other factors that come into play. For instance, not all
turbines are the same size. Therefore, the sizes of the gearbox and generators
varies. This also means that the rpm of each unit can vary. Also, wind isn’t always
coming from the same direction. Therefore, turbines usually are connected to a
wind vane to calculate the most optimal direction for the turbine to be facing.
Lastly, the speed of the wind is one of the most important factors that come into
22
24. play. Turbines average around 8 mph wind speed before the turn on to generate
electricity. On top of that the speed of the wind can become too much for a
turbine and has to shut off to prevent damage to the machine. However, usually
taller turbines need to worry about wind speed reaching unstable conditions [31]
Capturing the sun’s energy via photovoltaic panels seems like a simple
idea, but a lot of background information goes into these panels. It is important to
understand how this system works before deciding on the panels you want. To
begin, silicon contains four outer shell electrons that can just move between
energy levels when absorbing energy from the sun. When combined with other
silicon atoms, they share their valence electrons are create a crystalline structure.
This can be compared to when carbon form together to create diamonds. When
the silicon electrons reacts to the sunlight’s photons it releases an electron. Using
phosphorus and boron, an electrical field is created between the two layers of
silicon. The freed electron travels through the layer where it is pushed through a
circuit to generate electricity. The electron is then return to the silicon atom where
it can be used again. Multilayered silicon panels have more layers than just the
boron and phosphorous layers. Since there are many energy bands the valence
electrons can jump to, the multilayer panel contains other elements that deal with
electrons with greater energy. This increases efficiency of the system, but also the
price. Thinfilm solar panels use different compounds instead of silicon to become
flexible and thinner. However, these panels are not as efficient [15]
Methods (JZF)
A survey of the site was conducted using the small wind explorer site
provided by NYSERDA [4]. The site is preprogrammed to calculate the
production of the site using various factors like geographic location, wind speed,
direction, and efficiency. The small wind explorer reports the wind speed at 100ft,
the wind direction, and gives a recommendation for the site. Lastly, it organizes
the data into a chart for various turbines sizes (5, 10, 20, and 50 kW) and at
various heights (80, 100, and 120 ft.). Appendix 2 displays the annual production
produced from the small wind explorer.
Analysis for the photovoltaic system was calculated using the clean power
estimator found at NYSUN [19]. This estimator calculates the energy and
savings produced from various systems in both residential and commercial
system. For both systems various default controls were set for the panel system.
The controls were set as follow: panel tilt of 35º, system loss of 5%, discount rates
of 5%, escalation rates of 3 %, south facing panels, commercial price of $3,000
per kW, residential price of $3,500 per kW, and taxable income of $300,000 for
residential and $500,000 for commercial. A commercial system was conducted
23
25. first. First, the clean power estimator was run with the settings of pay cash and
taxable for 10 kW and 50 500 kW systems using intervals of 50. Items recorded
were: initial cost, incentives, taxes, net cost, total kWh per year produced, percent
of total electricity covered, net present value (NPV), payback, and emission
reduction. The same settings were conducted for a pay cash system, but with the
setting of tax exempt. The results can be seen in Appendix 2.
The next set of data was collected using the residential settings in the
clean power estimator. Residential systems involve different pricing, incentives,
taxes, and sizing. Calculations were conducted for 5 – 15 kW systems. Clean
Power Estimator assumes that all residential systems pay taxes. Therefor an
option for taxexempt is not readily available. Clean Power does provide the table
conversions for discount rate and cumulative discounted cash flow. The final
cumulative cash flow is the NPV. These tables were edited to account for the lost
incentives and taxes, and recalculated to obtain the NPV for nontaxable systems.
All data can be seen in Appendix 2.
A third setting used for residential is a power purchase agreement (PPA).
The agreement was conducted using a 10 kW system. The controls follow the
same as above, except the PPA stays constant at $0.1285, the residual amount is
$0, the payment escalation is 1.5%, the electric bill escalation is 3%, and the
agreement is 20 years. Clean Power calculates the savings from avoiding
$0.14/kWh, and subtracts the PPA agreement rate of $0.1285/kWh to obtain
savings. This data can be seen in Table 7.
Discussion (JZF)
After obtaining the report from NYSERDA’s small wind explorer, it was
decided that the area was too inefficient for wind power. NYSERDA’s study
labels any area with wind speeds below 10 mph at 120 ft. as a poor site for
generation. The turbine would be producing around 1/5th
of the potential energy,
which can be seen in Table 6. To obtain a stable supply of energy the turbine
would have to be placed very high and be a larger system. This would also
increase the cost of the system. The client also favored against turbine since they
didn’t want to ruin the view of the surrounding area. This limited the proposal to
small wind units. So taking a 5 kW wind turbine and comparing it annually to a 5
kW photovoltaic system shows why PV is the better option. The wind turbine will
produce 700 – 1000 kWh, while the PV system will produce around 5,954 kWh.
24
26. Table 6: Potential wind turbine output based on size, height, and wind speed.
Understanding the difference between and tax payer and a nontaxpayer is
crucial. It can be seen in the difference for both commercial and residential
system. For those paying taxes, the systems NPV and payback in years are both
significantly better than system purchased with taxexempt pricing. A key feature
to note, is that the NPV of a taxexempt commercial purchase, is always negative.
This means that the cost of the system is greater than the revenues it would
generate at current market values. A special look should also be given to the
residential NPV calculation. The residential system was setup to power a single
building with a monthly electric bill of $150. If the photovoltaic system produces
more than 100% of the energy demanded by the site then the NPV begins to
decrease. This effect can be seen in the residential system. When the system is 11
kW the NPV begins to decrease. This is because you are paid less for the energy
delivered back into the system, or even depending on the time of day paying for
the power to be used. Power going to your demand will save $0.14/kWh, but
power going to the grid will save you less than $0.14/kWh. This is why the
analysis for the commercial system stops at 500 kW. Sizing the system under
100% production is better than over 100% production from an economic
standpoint. Another feature to look at is the payback of the system. Both tax
paying system have a much lower payback. If the client was tax paying, then a
recommendation could be made to buy a photovoltaic system through a loan or
cash. However, since this isn’t the case, a PPA is a better choice to look at.
A PPA was conducted using a 10kW residential system. The agreement
will last twenty years and after the company will sell the system to the client for
fair market price, remove the system, or renew the agreement. In net cost, the
PPA agreement cost a little more than $1,000 more than the residential
nontaxable purchase. However, the residential system could take 18 years to
payback and you wouldn’t see positive returns until the end of the payback
period. With the PPA, profit is earned after the first year. The 10 kW system can
be used as a proportion for more than one system. You could obtain ten 10 kW
25
27. system to match the output of a 100 kW system. The payment would expand
proportional to the 10 kW savings and costs. The PPA also obtain a benefit from
operation and maintenance. It the system breaks, the then the third party will pay
for or help pay for the costs to repair the system. This is added security the client
can gain with the PPA agreement.
Table 7: Comparison between researched 10 kW systems
Table 7 shows that overall comparison between all researched 10 kW
systems. The PPA turns out to be the most expensive system at $30,640. The
taxexempt residential system is close behind at $29,990. It is important to note
that the PPA is a rate payment while the other system are the initial cost of the
system. This means that the PPA is evenly spaced out while everything else is an
upfront cost. If the school paid taxes then the best option would be a residential
system since it supplies the best 10 kW NPV. However, since they don’t pay taxes
then the next best option is an PPA. They all produce the same amount of
electricity and save the same emissions: 7,533 lbs CO2 / year, 9.51 lbs SO2/ year,
and 5.53 lbs NOx/ year. Lastly, the payback is zero since the initial cost is a
cheaper rate than the original rate of $0.14/kWh. Overall, the best option for the
taxexempt school is a PPA.
c. Geothermal Heat Pump
Introduction (MO)
In certain parts of the country paying to heat buildings around the year can
cost a significant amount of money. However companies are starting to reevaluate
their heating systems and seeing what options are out there for more efficient and
sustainable systems. One option that is growing in popularity is a geothermal heat
pump. Geothermal resources are not always recognized as “renewable” sources
because the people still see the source as depletable. However in the time frame of
the system implementation and use when compared to depletable resource, (e.g.
coal) the heat from the earth’s core will not be depleted. While geothermal heat
pumps do have a high capital cost in the long run the system will save the
26
28. consumer money, have a high efficiency, and be a more sustainable system then
older fuel oil boilers for heating.
Geothermal heat pumps work by using the heat available underground,
taking advantage of the fact that this subsurface temperature is relatively constant
at a certain depth. There are two main types of geothermal heat pumps, those that
work with an open or closed loop system. A closed system uses an antifreeze
solution to pump through tubing buried in the ground to absorb the heat which is
then transferred in a heat exchanger. Closed loop systems can be horizontal,
vertical, or connected to a lake. Horizontal versus vertical related to the physical
position of the tubing underground. Horizontal systems are normally the most
costeffective however require a large enough area of land to dig up. Vertical
systems are more popular for areas that cannot allot a large enough area of land
because it minimizes the footprint on the surface. If a sufficient water source such
as a large pond or lake is close enough to the building a lake system can be used.
In this system the tubing is put at least eight feet under the water to prevent
freezing and heat is absorbed from the deep water. While this system can be the
most costeffective of the closed system options the water source must meet
specific criterion in order to be used such as volume and depth. These are all
compared to open loop systems where an underground body of water or well is
used as the exchange fluid and then returned to the ground to be circulated
through again. This type of loop system only works if there is a sufficient supply
of underground water.
The current heating system for the boarding school is mostly provided
through fuel oil and propane. These types of fuel are popular due to their
versatility and low prices. However they are not sustainable, able to be maintained
over time, or efficient, using the least amount of inputs for the most outputs.
Implementing a sustainable heating system in this boarding school will help the
school use primary energy more efficiently, specifically with geothermal it will
help them become more energy independent, and save money in the long run.
Geothermal heat pumps are more efficient than a fuel oil boiler because it
transports a greater amount of thermal energy then it takes to run, yielding a large
efficiency usually represented as a coefficient of performance, or a ratio of
thermal energy produced over input energy [28]. This high efficiency drives down
the operating costs which can combat the high capital cost of the system. This and
other factors will be explored in this analysis to show that this specific boarding
school in Eastern New York should convert its current heating system to a
geothermal heat pump.
27
30. businesses such as WaterFurnace and ClimateMaster Inc. To find the BTU/hr the
method that was used is one that is common for fossil fuel sizings where the peak
month through heating degree days is doubled to find a capacity requirement.
While doubling the BTU/hr seems excessive for some renewable energies it will
help make sure that even in successive cold days the peak load will be met. In
order to implement these systems certain parameters need to be evaluated such as
economic, energy, and environmental factors.
Economic
In order to convince the boarding school to convert to a different energy
technology more than just sustainability has to be factored in. The money factor is
important in that the investment must bring savings to the school. If nothing was
changed in with the current heating system the school is paying $11,837.09 (seen
in Table 9) to heat the Medicine building. If a 22 ton geothermal system was
installed for the Medicine building it would cost roughly $71,000 (seen in Table
9) [14].There is currently a tax incentive on geothermal heat pumps that takes off
30% of the total cost of the system, however since this school is a nonforprofit
establishment this incentive does not apply. With a geothermal system extra
electricity costs must be factored in due to the system running on electricity to
work the pump. Using an estimate of a 167.79 kWh increase per day, this should
be added to the electricity for the Medicine building roughly coming to 40,772.97
kWh extra per year [14].. This total kWh amount was found by factoring in that
the system would not be running during the months of June, July, August, and
September. However when looking into an investment the net present value and
cash flow diagrams show the profitability through the benefits exceeding the costs
of the initial investment over time. This net present value was calculated with a
5% discount rate and the initial investment cost used was the $70,709.55. The
extra kWh are included in this calculation with an electricity price escalation of
3% per year. With all of this factored in the net present value is negative for the
first 13 years and becomes positive in year 14. With the lifetime of the heat pump
being 25 years there are 11 years where the NPV will be positive. These net
present value after 25 years can be seen in Table 9.
29
33. radiators are sized to a certain range of temperatures from the boiler if the new
geothermal heat pump is sending a temperature that does not fall within the
allotted range the radiators will need to be replaced adding an extra cost to be
paid.
Conclusion (MO)
When considering this scenario of implementing a geothermal heat pump
in individual buildings outside the central system the large upfront capital cost
usually deters implementation. However when you consider multiple other factors
this scenario can make a lot of sense to propose. The efficiency of an average
geothermal heat pump is significantly better than the current fuel oil boilers and
since the heat pump runs on electricity the operational costs are lower per year
even with an electricity price escalation of 3% a year. With the net present value
turning positive in year 14 the school would have 11 years of positive cash flow.
In this analysis while only one building was evaluated the methodology can be
applied to any building with any heating load. It would be advised to retrofit one
that has a significant heating demand and the building itself used often in order to
recoup the most benefits from the heat pump.
d. Air Source Heat Pump
Introduction (BM)
In place of their current oil or propane boilers, the utilization of an air source heat
pump (ASHP) may alleviate the need for those heating sources at full capacity. Air
source heat pumps do not have the heating capacity to make a significant impact for the
target buildings that are Brethrens, the Library, the Dairy Barn, and Wickersham. The air
source heat pumps would be used for the secondary and less heating intensive buildings,
which also have a hydronics system so it is compatible. Only two buildings fit the
parameters that were set, as Neale and the Medicine buildings are both residential
structures with a decently high heating need and have a hydronics system already. Having
to completely change a steam system to a hydronics system would be very difficult and
expensive, so it was avoided. Due to what is known about air source heat pumps, it is
unlikely that these technologies will be able to fully replace the current oil boilers, and is
more likely to supplement them even if it just marginally.
Air source heat pumps are heating technologies that utilize the heat in the air to
bring into the building or structure that the system is integrated into. How the pump
works is there are two copper tubing coils, one indoors and one outdoors, which are
surrounded by aluminum fins to help with heat transfer and reduce heat loss. When
heating, there is a liquid refrigerant in the outside coils that extracts heat from the outside
air and then evaporates it into a gas. The coils inside then release that heat from the
32
34. system’s refrigerant as it condenses back into a liquid. Near the compressor there is a
reversing valve that can change the direction of the refrigerant flow, which changes the
system from heating to cooling, or vice versa [8]. Air source heat pumps tend to be much
more efficient than combustion heating systems due to the fact that the system moves
heat around instead of converting it in the form of combusting fuels.
Despite the fact that air source heat pumps tend to be more efficient than
combustion heating systems, the output is typically not as great and cannot match the
overall heating capacity that those combustion heating systems can. The prices of these
systems may also be a deciding factor on whether or not these systems are economically
feasible as well, but if the payback is short enough, it may be a financially and
environmentally viable option to replace a percentage of fossil fuels.
Methods (BM)
There were also several assumptions that were made for the air source heat pump
system after gaining knowledge and expertise from a Nyle Systems representative named
Brian Alderman. Nyle Systems is the company that produces the Geyser ASHP that was
selected to be used for this analysis. One of the assumptions is that the ASHP that was
selected to be used would be able to run for 20 hours a day, every day of the year.
Another assumption that a figure, Figure 11, used to measure the output based on ambient
temperature for the smaller 30,000 BTUH model, can be used to size the 60,000 BTUH
model that was used for the analysis by doubling the outputs. The last assumption was
that the temperature that the water needed to be in the heating system was to be 120
degrees Fahrenheit, another recommendation by Representative Alderman based on past
sales experiences [1].
The first thing that was completed was to determine which and how many
buildings were being analyzed. Because of how air source heat pumps work, as they
operate with hot water, only hydronics systems would have worked with this technology.
And because of the relatively small sizes of these heat pumps, compared to wood chip or
pellet boilers, only residential buildings were targeted. With those parameters, only Neale
and the Medicine Building were feasible project sites.
From there, the BTU needs of the building were calculated and then the cost per
month for oil heating was also determined. After those figures were found, the BTU
output of the air source heat pumps were used to calculate how much of the monthly
heating would be done by the heat pump. Once that was determined, the amount of
gallons of oil, and thus the amount of money saved, was calculated so that the payback
period would be easily determined once a technology was selected. With the original idea
of using a residential system that only had an output of 6275 BTUH, and a very large
amount of sensitivity to the cold, the heating needs were not being met with any
significant amount from the ASHP. In the winter months, the air source heat pump would
33
35. be almost useless as the ambient temperature cannot fall below 45 degree Fahrenheit. In
the fall and spring months, it would supplement the heating needs marginally and would
have a decent payback period. With the coils freezing in the colder months, the air source
heat pump would be almost useless as it would turn off so the coils could defrost. If it
was turned back on to run, the same thing would happen. If the ambient temperature fell
below 45 degrees Fahrenheit, that is when the coils on the system would start to freeze.
Referencing Table 14, five of the coldest months of the year are well below that
temperature and would not make any significant contribution to the heating needs of
Neale and the Medicine Building. Because of the sensitivity to the cold, the 6275 BTUH
residential system was forgone and upon further research, there was an air source heat
pump that operates in colder climates and productively contribute to heating needs of the
building. With larger heating outputs as well, 30,000 and 60,000 BTUH, the heating
contribution is much larger and can save much more money as a result of investing in
these systems. It was decided that this Cold Climate Heat Pump (CCHP)60 model would
be used for each building due to that the CCHP60 model would have double the heating
output, but would only cost $3000 more. The CCHP30 was priced at ~$7000, whereas
the CCHP60 was priced at ~$10000, this is before shipping and installing fees of around
$500 combined. Representative Alderman had a ticket drawn up for this project and
shipping for two heat pumps for Neale and the Medicine building, as well as
recommended how much to expect to pay for the plumbers to install the system [1]. The
60,000 BTUH Cold Climate Heat Pump (CCHP) was selected to be integrated into both
the Medicine Building and Neale Dorms. The monthly output for the CCHP60 model
was calculated by multiplying the output by 20 hours a day by the number of days in that
month. The air source heat pump can run for 20 hours of any given day, providing that
there is a need for it. With the help of Table 14 and Figure 11, the output for the systems
were able to be assessed, and Figure 10 was used to show how much additional electricity
was used.
Discussion (BM)
Representative Alderman had a ticket drawn up for this project and shipping for
two heat pumps would be $425 together, and to hire a good plumber to do a complex
project such as this would be approximately $300 for a plumber and their assistant. The
ticket also showed that the price of the CCHP for the school was given a slight discount
of $250 off the two systems, giving a total of $19,500 instead of $20,000 for the two
CCHP60 models (Appendix 1). With pricing and heating output by the system
determined, the payback of the systems can be calculated. As seen by Tables 12 and 13,
the CCHP replaces a significant amount of fuel oil each month and the savings can be
seen after each month. If the fiscal savings are consistent from year to year, the payback
for the $10,162.50 investment for each of the two CCHP60 models would be 1.43 and
34
36. 1.48 years for Neale and the Medicine Building, respectively. Because of the CCHPs, the
amount of fuel oil that is needed decreases a significant amount. The Neale building
reducing oil needs by 38% and the Medicine Building reducing oil needs by 62%. All of
that oil that they are no longer paying for can be seen as immediate savings each month
and the school can start to see that. With the heat pumps being guaranteed to function at
least ten years, this is a great investment that would involve large amounts of economic
savings and even greater amounts of profit. The Net Present Values of the two buildings
vary too. After ten years, the NPV for Neale Dorms is $18,726.15, and for the Medicine
Building it is $108,021.64. It is certainly a good financial investment, and will save the
client quite a sum of money.
The CCHP60 model requires electricity to operate, that is the premise of how it
runs, and that electricity needs to be taken into account as well. Using Figure 10 the
amount of additional electricity needed for the heat pump was able to be calculated and
then taken account for both financially and environmentally. These additional emissions
can be seen in the form of NOx, SO2, and CO2, and the emissions can be seen via Table
11. Neale and the Medicine Building had reductions of 38% and 62% of heating needs,
respectively. Because of that, it was determined that that percentage less of oil was
burned and thus emissions permitted from the oil burner. The emissions because of
electrical generation for the CCHP was combined with the reduced oil burner needs for
each building to show the combined emission figures in Table 11. Before the CCHP, the
annual Particulate Matter (PM10) decreased from 6.45 pounds to 2.45 pounds in the
Medicine Building. In Neale, PM10 decreased from 10.65 pounds to 6.6 pounds
annually. Carbon Monoxide (CO) is the other emission that did not have any combination
of emissions because of the CCHP. The Medicine Building dropped from 16.12 pounds
to 6.13 pounds, and Neale Dorms dropped from 26.63 pounds to 16.51 pounds a year.
NOx decreased from 65.86 pounds to 45.04 pounds with the addition of 20.01 pounds
from the electricity needed for the CCHP in the Medicine Building. Neale Dorms
decreased from 108.82 pounds to 87.48 pounds, annually, with that same 20.01 pounds
because of electricity needed for the CCHP. SO2 decreased from 230.29 pounds to
122.32 pounds with the combination of 34.81 pounds from the CCHP in the Medicine
Building. Neale had the same addition from the CCHP and decreased from 380.49
pounds to 270.71 pounds. CO2 decreased from 73,321 pounds to 55,238 pounds in the
Medicine Building with the 27,410 pounds needed for CCHP electricity. Neale decreased
from 120,997 pounds to 55,238 pounds of CO2 with the CCHP electricity factored in [19,
24] . There is a significant decrease in emissions per year if there was a transition from
the oil boilers to the CCHP60 model. If emission reduction was high on the priority list,
this would be a good option to pursue for the client.
35
38.
Table 12: Oil/Heating Demand and Savings Seen Because of the ASHP for Neale Dorms
Month(201
42015) Oct Nov Dec Jan Feb Mar April May
Fuel Oil
(gal) 426.8 627.3 642.7 1263.4 1034.2 429.1 881 209.9
mmBTU
Needed 58.9 86.6 88.7 174.3 142.7 59.2 121.6 29.0
ASHP
Output
(BTUH) 60000 60000 60000 54000 58000 60000 60000 60000
Monthly
Output 37.2 36 37.2 33.48 32.48 37.2 36 37.2
Percentage
of Building
Heating
Demand 63% 42% 42% 19% 23% 63% 30% 100%
Gallons
Less of Oil 269.6 260.9 269.6 242.6 235.4 269.6 260.9 209.9
Money
Saved
$951.57
920.87
951.57
856.41
830.83
951.57
920.87
740.95
37
39. Table 13: Oil/Heating Demand and Savings Seen Because of the ASHP for the Medicine
Building
Month(20
142015) Oct Nov Dec Jan Feb Mar April May
Fuel Oil
(gal) 414.1 352.8 421.0 484.6 539.1 540.9 462.5 122.5
mmBTU
Needed 57.1 48.7 58.1 66.9 74.4 74.6 63.8 16.9
ASHP
Output
(BTUH) 60000 60000 60000 54000 58000 60000 60000 60000
Monthly
Output 37.2 36 37.2 33.48 32.48 37.2 36 37.2
Percentag
e of
Building
Heating
Demand 63% 74% 64% 50% 44% 50% 56% 100%
Gallons
Less of Oil 269.6 260.9 269.6 242.6 235.4 269.6 260.9 122.5
Money
Saved
$956.96
926.09
9516.96
861.26
835.54
956.96
926.09
434.88
Table 14: Average Monthly Temperature of Albany, New York from 1981 to 2010 in
Degrees Fahrenheit.
J F M A M J J A S O N D
22.6 25.9 35 47.8 58.3 67.2 71.8 70.1 61.9 49.7 39.7 28.5
[17]
38