The North County industrial market report provides an overview of industrial real estate market conditions for 2013. Some key points:
- The total industrial inventory in North County was 52.2 million SF with an overall vacancy rate of 8.59%. Net absorption for the year was 821,481 SF.
- Among the five submarkets, Carlsbad had the highest vacancy rate at 11.37% while Escondido had the lowest at 4.87%. Rental rates increased across most product types over the year.
- Significant transactions included a 82,751 SF building in Carlsbad that sold for $96/SF and a 56,352 SF building in Escondido that Stone Brewery purchased for
1. YEAR END 2013
NORTH COUNTY SAN DIEGO
SPACES AVAILABLE
INDUSTRIAL MARKET REPORT
OVERVIEW
The North San Diego County industrial market is largely decentralized and comprised of five cities including Carlsbad, Escondido, Oceanside, San
SUBMARKET INDUSTRIAL DIRECT of downtown San Diego and 52 miles south of John Wayne Airport in Orange County, the coastal
SUBMARKET INDUSTRIAL north VACANCY
Marcos and Vista. Situated 35 milesDIRECT VACANCY
location is a major factor in the area’s appeal to corporate users and its 826,985 residents.
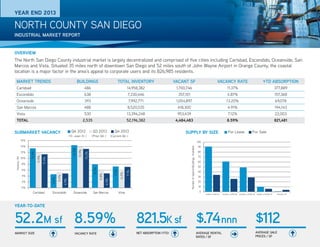
MARKET TRENDS
BUILDINGS
TOTAL INVENTORY
VACANT SF
VACANCY RATE
YTD ABSORPTION
Carlsbad
486
14,958,382
1,700,746
11.37%
377,889
Escondido
638
7,330,446
357,101
4.87%
157,368
Oceanside
393
7,992,771
1,054,897
13.20%
69,078
San Marcos
488
8,520,535
418,300
4.91%
194,143
Vista
530
13,394,248
953,439
7.12%
22,003
2,535
52,196,382
4,484,483
8.59%
821,481
TOTAL
Q4 VACANCY 2013
Q3
SUBMARKET INDUSTRIAL
SUBMARKET VACANCY DIRECT2012
(Yr.-over-Yr.)
(Prior Qtr.)
Q4 2013
SUPPLY BY SIZE
SPACES AVAILABLE For Lease
(Current Qtr.)
16%
100
Number of SpacesBuildings Available
2%
7.1%
7.2%
6.2%
5.8%
4.9%
4.6%
4%
5.4%
6%
4.9%
8.0%
13.2%
13.9%
14.5%
11.4%
8%
11.9%
Vacancy (%)
10%
13.4%
14%
12%
For Sale
0%
Carlsbad
Escondido
Oceanside
San Marcos
90
80
70
60
50
40
30
20
10
0
Vista
5,000 to 9,999 SF
10,000 to 19,999 SF
20,000 to 49,999 SF 50,000 to 99,999 SF
100,000+ SF
YEAR-TO-DATE
52.2M sf 8.59%
821.5K sf $.74nnn
MARKET SIZE
NET ABSORPTION (YTD)
VACANCY RATE
AVERAGE RENTAL
RATES / SF
$112
AVERAGE SALE
PRICES / SF
Industrial Property Report 1
2. NORTH COUNTY - YEAR END 2013
NORTH COUNTY INVENTORY DISTRIBUTION
INVENTORY BREAKDOWN
VACANCY BY PRODUCT TYPE
NORTH COUNTY
e
Total Vacancy by Product Type
20%
R&D
23.0%
15%
IMT
12.8%
10%
Total Existing Inventory
DIST
31.5%
52,196,382
5%
0%
MFG
ORY DISTRIBUTION
32.8%
2007
2008
2009
Distribution
Total Future Inventory
2010
Manufacturing
3,946,954
2011
2012
Multi-Tenant
2013 Q4
R&D
SIGNIFICANT LEASE TRANSACTIONS
DIST
16,419,353
MFG
17,096,027
IMT
6,698,357
R&D
11,982,645
Total Existing Inventory
52,196,382
Under Construction
156,421
Proposed
3,790,533
Total Future Inventory
3,946,954
Flat Fitty
UCC Distributing
Techniche Solutions
Twin Flowers
DiBella Baking Company
SF
11,583
32,666
13,254
14,009
14,302
Term
48
48
24
88
62
Effective Rate
$1.20
$0.47
$0.69
$0.51
$0.69
COE
12/31/13
12/19/13
10/16/13
12/20/13
10/24/13
Price/SF
$96
$115
$209
$93
$132
SIGNIFICANT SALE TRANSACTIONS
5960 Pascal Ct
2120 Harmony Grove Rd
3182 Lionshead Ave
1050 Los Vallecitos Blvd
6190 Yarrow Dr
SF
82,751
56,352
26,811
105,618
17,944
Industrial Property Report
2
3. NORTH COUNTY - YEAR END 2013
INDUSTRIAL STATS
Existing Properties
Type
Total
Inventory
SF
Bldgs
Distribution
208
7,284,032
Direct
Vacant
SF
Direct
Vacancy
Rate
725,567
Absorption
Sublease
Vacant
SF
9.96%
Sublease
Vacancy
Rate
1,184
0.02%
Total
Vacant
SF
Total
Vacancy
Rate
Net
Absorption
SF QTR
726,751
9.98%
New Supply
Net
Absorption
SF YTD
76,408
New
Supply
SF QTR
UC / Proposed
New
Supply
SF YTD
365,496
0
Under
Construction
SF
147,548
0
UC
Availability
Proposed
SF
0.00%
1,425,835
Industrial
687
9,135,321
551,242
6.03%
0
0.00%
551,242
6.03%
65,048
61,948
0
0
0
0.00%
425,246
Manufacturing
932
17,096,027
1,434,317
8.39%
0
0.00%
1,434,317
8.39%
-68,911
121,233
0
37,050
156,421
27.61%
148,978
Multi-Tenant
364
6,698,357
527,010
7.87%
15,406
0.23%
542,416
8.10%
65,268
173,800
0
0
0
0.00%
0
2,191
40,213,737
3,238,136
8.05%
16,590
0.04%
3,254,726
8.09%
137,813
722,477
0
184,598
156,421
27.61%
2,000,059
342
11,925,338
1,161,329
9.74%
11,121
0.09%
1,172,450
9.83%
8,182
99,004
0
0
0
0.00%
1,790,474
Industrial
R&D
Wet Lab
2
57,307
57,307
100.00%
0
0.00%
57,307
100.00%
0
0
0
0
0
0.00%
0
R&D
344
11,982,645
1,218,636
10.17%
11,121
0.09%
1,229,757
10.26%
8,182
99,004
0
0
0
0.00%
1,790,474
Total
2,535
52,196,382
4,456,772
8.54%
27,711
0.05%
4,484,483
8.59%
145,995
821,481
0
184,598
156,421
27.61%
3,790,533
VISTA
NORTH COUNTY
NORTH COUNTY HISTORICAL MARKET TRENDS
TRENDS
NORTH Average Asking Rents
Weighted Monthly COUNTY MARKET
NORTH COUNTY INDUSTRIAL RENT TRENDS
Weighted Monthly Average Asking Rents
14%
1,250
$1.50
12%
1,500
$1.40
$1.30
SF (000s)
750
500
8%
250
6%
0
Vacancy Rate
10%
$/SF/Month
1,000
$1.20
$1.10
$1.00
$0.90
4%
$0.80
2%
$0.60
0%
$0.50
-250
$0.70
-500
-750
2007
2008
2009
Net Absorption
2010
2011
New Supply
2012
2013 Q4
Vacancy
2007
2008
2009
Distribution (NNN)
Multi-Tenant (Mod. Gross)
2010
2011
2012
2013 Q4
Manufacturing (NNN)
R&D (NNN)
Industrial Property Report
3
4. CARLSBAD - YEAR END 2013
CARLSBAD INVENTORY DISTRIBUTION
INVENTORY BREAKDOWN
ESCONDIDO INVE
VACANCY BY PRODUCT TYPE
CARLSBAD
Total Vacancy by Product Type
DIST
3.5%
527,340
20%
MFG
MFG
29.0%
IMT
4,341,496
15%
2,285,360
10%
IMT
15.3%
Total Existing Inventory 14,958,382
5%
0%
R&D
DISTRIBUTION 52.2%
DISTRIBUTION
2007
2008
2009
2010
2011
ESCONDIDO INVENTORY DISTRIBUTION
ESCONDIDO INVENTORY DISTRIBUTION
Total Future Inventory
1,839,132
Distribution
Manufacturing
DIST
MFG
MFG
IMT
IMT
527,340
527,340
4,341,496
4,341,496
2,285,360
2,285,360
R&D
7,804,186
Proposed
1,839,132
Total Future Inventory
Total Future Inventory
1,839,132
1,839,132
R&D
OCEANSIDE
» User building purchases very active in 2013 with 14
Total Vacancy by Product Type
deals closing
»
Multi-tenant projects filling up and asking lease rates will
SAN MARCOS
increase this year by 10% Existing Inventory 7,336,446
Total
»
Speculative development coming back to the market with
several projects in the planning stages
Total Existing Inventory
0
Multi-Tenant
2013 Q4
3-POINT SUMMARY
Total Existing Inventory 14,958,382
OCEANSIDE INVENTORY DISTRIBUTION
Total Existing Inventory 14,958,382
Under Construction
2012
Total Future Inventory
Total Future Inventory
7,336,446
39,500
39,500
Industrial Property Report
4
INV
5. CARLSBAD - YEAR END 2013
INDUSTRIAL STATS
Absorption
Existing Properties
Type
Total
Inventory
SF
Bldgs
Distribution
6
Direct
Vacant
SF
Direct
Vacancy
Rate
Sublease
Vacant
SF
Total
Vacant
SF
Sublease
Vacancy
Rate
Total
Vacancy
Rate
Net
Absorption
SF QTR
527,340
0
0.00%
0
0.00%
0
0.00%
156
4,341,496
548,055
12.62%
0
0.00%
548,055
96
2,285,360
190,283
8.33%
0
0.00%
190,283
Industrial
258
7,154,196
738,338
10.32%
0
0.00%
738,338
R&D
226
7,746,879
905,101
11.68%
0
0.00%
2
57,307
57,307
100.00%
0
0.00%
R&D
228
7,804,186
962,408
12.33%
0
Total
486
14,958,382
1,700,746
11.37%
0
Manufacturing
Multi-Tenant
Wet Lab
New
Supply
SF QTR
New
Supply
SF YTD
Under
Construction
SF
UC
Availability
Proposed
SF
0
3,459
0
0
0
0.00%
100,000
12.62%
43,355
139,735
0
37,050
0
0.00%
0
8.33%
22,052
99,083
0
0
0
0.00%
0
10.32%
65,407
242,277
0
37,050
0
0.00%
100,000
905,101
11.68%
6,982
135,612
0
0
0
0.00%
1,739,132
57,307
100.00%
0
0
0
0
0
0.00%
0
0.00%
962,408
12.33%
6,982
135,612
0
0
0
0.00%
1,739,132
0.00%
1,700,746
11.37%
72,389
377,889
0
37,050
0
0.00%
1,839,132
CARLSBAD
CARLSBAD HISTORICAL MARKET TRENDS
VISTA HISTORICAL MARKET TRENDS
Weighted Monthly Average Asking Rents
CARLSBAD MARKET TRENDS
CARLSBAD INDUSTRIAL RENT TRENDS
600
16%
$1.50
500
14%
$1.40
$1.30
12%
10%
300
8%
200
6%
100
$1.20
Vacancy Rate
400
SF (000s)
UC / Proposed
New Supply
Net
Absorption
SF YTD
$1.10
$1.00
$0.90
4%
$0.80
0
2%
$0.70
-100
0%
2007
2008
2009
2010
2011
2012
2013 Q4
$0.60
2007
2008
2009
2010
2011
2012
2013 Q4
Distribution (NNN)
Net Absorption
New Supply
OCEANSIDE HISTORICAL MARKET TRENDS
Vacancy
Manufacturing (NNN)
Multi-Tenant (Mod. Gross)
R&D (NNN)
SAN MARCOS HISTORICAL MARKET TRENDS
OCEANSIDE
Weighted Monthly Average Asking Rents
Industrial Property Report
5
6. ESCONDIDO
ESCONDIDO - YEAR END 2013
ESCONDIDO INVENTORY DISTRIBUTION
INVENTORY BREAKDOWN
VACANCY BY PRODUCT TYPE
ESCONDIDO
Total Vacancy by Product Type
R&D
4.7%
20%
DIST
25.8%
15%
IMT
16.0%
10%
5%
Total Existing Inventory
7,336,446
0%
DISTRIBUTION
DISTRIBUTION
2007
MFG
53.6%
2008
Distribution
Total Future Inventory
DIST
1,888,654
MFG
3,926,740
IMT
1,170,616
R&D
Total Existing Inventory
y
Total Existing Inventory
2009
344,436
7,336,446
7,336,446
2010
Manufacturing
2011
2012
2013 Q4
Multi-Tenant
R&D
39,500
3-POINT SUMMARY
SAN MARCOS
» 2013 had strong
Total Vacancy by Product Type small-tenant activity (under 10,000 SF
spaces had ~50 new leases); only 2 leases above
10,000 SF
»
SAN MARCOS INVENTORY DISTRIBUTION Purchase prices increased 25% as more large building
(above 10,000 SF) sales closed escrow since 2006
Under Construction
0
Proposed
39,500
Total Future Inventory
Total Future Inventory
39,500
39,500
»
Stone Brewery continues to expand in Escondido by
purchasing a 56,352 SF building for $115/SF
Industrial Property Report
6
7. ESCONDIDO - YEAR END 2013
INDUSTRIAL STATS
Absorption
Existing Properties
Type
Bldgs
Distribution
42
Total
Inventory
SF
Direct
Vacant
SF
Direct
Vacancy
Rate
Sublease
Vacant
SF
Sublease
Vacancy
Rate
85,185
926,483
9.19%
0
0.00%
Total
Vacant
SF
Total
Vacancy
Rate
Net
Absorption
SF QTR
85,185
9.19%
New Supply
Net
Absorption
SF YTD
9,084
New
Supply
SF QTR
UC / Proposed
New
Supply
SF YTD
Under
Construction
SF
UC
Availability
Proposed
SF
152,678
0
147,548
0
0.00%
30,000
Industrial
120
962,171
34,593
3.60%
0
0.00%
34,593
3.60%
0
1,984
0
0
0
0.00%
0
Manufacturing
364
3,926,740
146,124
3.72%
0
0.00%
146,124
3.72%
33,005
-6,457
0
0
0
0.00%
0
Multi-Tenant
85
1,170,616
74,792
6.39%
0
0.00%
74,792
6.39%
-5,650
17,580
0
0
0
0.00%
0
Industrial
611
6,986,010
340,694
4.88%
0
0.00%
340,694
4.88%
36,439
165,785
0
147,548
0
0.00%
30,000
R&D
27
344,436
16,407
4.76%
0
0.00%
16,407
4.76%
0
-8,417
0
0
0
0.00%
9,500
R&D
27
344,436
16,407
4.76%
0
0.00%
16,407
4.76%
0
-8,417
0
0
0
0.00%
9,500
Total
638
7,330,446
357,101
4.87%
0
0.00%
357,101
4.87%
36,439
157,368
0
147,548
0
0.00%
39,500
2012
2013 Q4
CARLSBAD
ESCONDIDO MARKET Rents
Weighted Monthly HISTORICAL MARKET
ESCONDIDOAverage AskingTRENDS TRENDS
ESCONDIDO
NORTH COUNTY HISTORICALAsking Rents TRENDS
Weighted Monthly Average MARKET RENT TRENDS
ESCONDIDO INDUSTRIAL
300
10%
$1.00
9%
200
$0.95
8%
$0.90
7%
6%
0
5%
-100
4%
3%
-200
Vacancy Rate
SF (000s)
100
$0.85
$0.80
$0.75
$0.70
2%
-300
1%
0%
-400
2007
2008
2009
2010
2011
2012
2013 Q4
$0.65
$0.60
2007
2008
2009
2010
2011
Distribution (NNN)
Net Absorption
New Supply
Vacancy
Manufacturing (NNN)
Multi-Tenant (Mod. Gross)
R&D (NNN)
OCEANSIDE
SAN MARCOS
Weighted Monthly Average Asking Rents
Weighted Monthly Average Asking Rents
Industrial Property Report
7
8. STRIBUTION
ISTRIBUTION
ESCONDIDO INVENTORY DISTRIBUTION
ESCONDIDO INVENTORY DISTRIBUTION
OCEANSIDE
OCEANSIDE - YEAR END 2013
OCEANSIDE INVENTORY DISTRIBUTION
INVENTORY BREAKDOWN
MFG
IMT
MFG
527,340
VACANCY BY PRODUCT TYPE
4,341,496
527,340
2,285,360
4,341,496
IMT MFG
SAN MARCOS INV
OCEANSIDE
Total Vacancy by Product Type
2,285,360
Total 3.2% Inventory 14,958,382
Existing
IMT
Total Existing Inventory 14,958,382
14.3%
Total Future Inventory
Total Future Inventory
R&D
11.9%
1,839,132
1,839,132
45%
40%
Total Existing Inventory
35%
Total Existing Inventory
7,336,446
7,336,446
30%
25%
20%
Total Future Inventory
Total Existing Inventory 7,992,771
15%
Total Future Inventory
10%
39,500
39,500
5%
0%
ISTRIBUTION
DISTRIBUTION
DIST
70.6%
2007
2008
2009
SAN MARCOS INVENTORY DISTRIBUTION
SAN MARCOS INVENTORY DISTRIBUTION
Distribution
Total Future Inventory
DIST
5,641,183
MFG
256,997
IMT
0
Proposed
1,380,401
Total Future Inventory
1,380,401
Total Future Inventory
Manufacturing
2012
2013 Q4
Multi-Tenant
R&D
1,380,401
»
Sysco buying US Foods so future of 28 acre site in
Ocean Ranch unknown
»
Coca Cola closed on Totalacres in Ocean Ranch in late
14 Existing Inventory 8,520,535
December for $14.75 Total Existing Inventory 8,520,535
SF
»
Small buildings for sale market very active in 2013
with 21 closed escrows Future Inventory
Total
53,000
Total Existing Inventory 7,992,771
Under Construction
2011
3-POINT SUMMARY
1,140,506
Total Existing Inventory 7,992,771
R&D
954,085
2010
Total Future Inventory
53,000
1,380,401
Industrial Property Report
8
9. OCEANSIDE - YEAR END 2013
CARLSBAD
Weighted Monthly Average Asking Rents
INDUSTRIAL STATS
CARLSBAD HISTORICAL MARKET TRENDS
VISTA HISTORICAL MARKET TRENDS
Absorption
Existing Properties
Type
Total
Inventory
SF
Bldgs
Distribution
Direct
Vacant
SF
Multi-Tenant
Sublease
Vacancy
Rate
Total
Vacant
SF
Total
Vacancy
Rate
Net
Absorption
SF QTR
0
0.00%
522,274
321,932
7.73%
0
0.00%
321,932
7.73%
70,566
27.46%
0
0.00%
70,566
27.46%
1,477,490
522,274
272
Manufacturing
Sublease
Vacant
SF
35.35%
25
Industrial
Direct
Vacancy
Rate
4,163,693
12
256,997
35.35%
New Supply
Net
Absorption
SF YTD
32,929
New
Supply
SF QTR
UC / Proposed
New
Supply
SF YTD
Under
Construction
SF
UC
Availability
Proposed
SF
69,158
0
0
0
0.00%
1,023,342
17,764
23,060
0
0
0
0.00%
342,081
-17,184
-30,003
0
0
0
0.00%
14,978
64
1,140,506
88,366
7.75%
5,000
0.44%
93,366
8.19%
31,114
11,633
0
0
0
0.00%
0
373
7,038,686
1,003,138
14.25%
5,000
0.07%
1,008,138
14.32%
64,623
73,848
0
0
0
0.00%
1,380,401
R&D
20
954,085
39,099
4.10%
7,660
0.80%
46,759
4.90%
5,565
-4,770
0
0
0
0.00%
0
R&D
20
954,085
39,099
4.10%
7,660
0.80%
46,759
4.90%
5,565
-4,770
0
0
0
0.00%
0
Total
393
7,992,771
1,042,237
13.04%
12,660
0.16%
1,054,897
13.20%
70,188
69,078
0
0
0
0.00%
1,380,401
Industrial
OCEANSIDE
OCEANSIDE HISTORICAL MARKET TRENDS
SAN MARCOS HISTORICAL MARKET TRENDS
Weighted Monthly Average Asking Rents
OCEANSIDE MARKET TRENDS
OCEANSIDE INDUSTRIAL RENT TRENDS
20%
$0.90
18%
$0.85
500
16%
400
14%
300
12%
200
10%
100
8%
0
-100
6%
-200
4%
-300
2%
-400
0%
2007
2008
2009
2010
2011
2012
2013 Q4
$0.80
Vacancy Rate
SF (000s)
700
600
$0.75
$0.70
$0.65
$0.60
$0.55
$0.50
2007
2008
2009
2010
2011
2012
Distribution (NNN)
New Supply
Vacancy
Manufacturing (NNN)
Multi-Tenant (Mod. Gross)
Net Absorption
2013 Q4
R&D (NNN)
Insufficient data for R&D rents
Industrial Property Report
9
10. DISTRIBUTION
DISTRIBUTION
SAN MARCOS
SAN MARCOS INVENTORY DISTRIBUTION
INVENTORY BREAKDOWN
SAN MARCOS - YEAR END 2013
VACANCY BY PRODUCT TYPE
SAN MARCOS
Total Vacancy by Product Type
35%
Total Existing Inventory
Total Existing Inventory
Total Future Inventory
Total Future Inventory
DIST
68.5%
MFG
7,336,446
7,336,446
16.3%
39,500R&D
39,500
13.3%
30%
IMT
1.8%
25%
20%
Total Existing Inventory 8,520,535
15%
10%
5%
0%
2007
2008
Total Future Inventory
Y DISTRIBUTION
Y DISTRIBUTION
2009
2010
2011
2012
2013 Q4
53,000
Distribution
Manufacturing
Multi-Tenant
R&D
DIST
5,838,680
3-POINT SUMMARY
MFG
1,390,013
»
Expect 5-10% rent and sale price growth due to 4.9%
vacancy and steady demand
R&D
1,136,789
Total Existing Inventory 8,520,535
Total Existing Inventory 8,520,535
»
Lack of available alternatives > 15,000 SF forces tenants
and buyers to look outside San Marcos
Under Construction
»
Multi-tenant lease rates reaching into the $.80’s/SF
modified gross in newer, well-maintained projects
IMT
155,053
0
Proposed
53,000
Total Future Inventory
Total Future Inventory
53,000
53,000
Industrial Property Report 10
11. SAN MARCOS - YEAR END 2013
ARLSBAD
ESCONDIDO
ghted Monthly Average Asking Rents
Weighted Monthly Average Asking Rents
INDUSTRIAL STATS
VISTA HISTORICAL MARKET TRENDS Properties
Existing
Type
Total
Inventory
SF
Bldgs
Distribution
Direct
Vacant
SF
Direct
Vacancy
Rate
Absorption
Sublease
Vacant
SF
Total
Vacant
SF
Sublease
Vacancy
Rate
Total
Vacancy
Rate
Net
Absorption
SF QTR
New Supply
Net
Absorption
SF YTD
New
Supply
SF QTR
UC / Proposed
New
Supply
SF YTD
Under
Construction
SF
UC
Availability
Proposed
SF
111
2,332,898
80,022
3.43%
1,184
0.05%
81,206
3.48%
17,033
101,763
0
0
0
0.00%
0
259
3,505,782
142,311
4.06%
0
0.00%
142,311
4.06%
43,744
75,682
0
0
0
0.00%
53,000
74
1,390,013
88,717
6.38%
0
0.00%
88,717
6.38%
10,058
26,212
0
0
0
0.00%
0
9
155,053
29,706
19.16%
2,400
1.55%
32,106
20.71%
4,580
-1,671
0
0
0
0.00%
0
453
7,383,746
340,756
4.61%
3,584
0.05%
344,340
4.66%
75,415
201,986
0
0
0
0.00%
53,000
R&D
35
1,136,789
70,499
6.20%
3,461
0.30%
73,960
6.51%
1,575
-7,843
0
0
0
0.00%
0
R&D
35
1,136,789
70,499
6.20%
3,461
0.30%
73,960
6.51%
1,575
-7,843
0
0
0
0.00%
0
Total
488
8,520,535
411,255
4.83%
7,045
0.08%
418,300
4.91%
76,990
194,143
0
0
0
0.00%
53,000
Industrial
Manufacturing
Multi-Tenant
Industrial
CEANSIDE
SAN MARCOS MARKET TRENDS
MARCOS HISTORICAL MARKET
ghted Monthly Average Asking Rents
SAN MARCOS
TRENDS
SAN MARCOS INDUSTRIAL
Weighted Monthly Average Asking Rents
$1.50
9%
300
RENT TRENDS
8%
200
7%
5%
0
4%
3%
-100
Vacancy Rate
6%
100
SF (000s)
$1.25
$1.00
$0.75
2%
-200
1%
$0.50
0%
-300
2007
2008
2009
2010
2011
2012
2013 Q4
2007
2008
2009
2010
2011
2012
Distribution (NNN)
Net Absorption
New Supply
Vacancy
Manufacturing (NNN)
Multi-Tenant (Mod. Gross)
2013 Q4
R&D (NNN)
Industrial Property Report
11
12. VISTA INVENTORY DISTRIBUTION
INVENTORY BREAKDOWN
VISTA - YEAR END 2013
NORTH
VISTA
VACANCY BY PRODUCT TYPE
VISTA
Total Vacancy by Product Type
20%
IMT
14.5%
R&D
13.0%
15%
DIST
18.8%
10%
Total Existing Inventory 13,394,248
5%
0%
MFG
53.6%
TRIBUTION
RIBUTION
2007
2008
2009
2010
Distribution 634,921
Manufacturing
Total Future Inventory
DIST
2,523,496
MFG
7,180,781
IMT
2012
R&D Existing Inventory 13,394,248
1,743,149
Total
Total Existing Inventory 13,394,248
»
478,500
Total Future Inventory
Total Future Inventory
634,921
634,921
R&D
Strong demand seen from both owner-occupiers and
investors as nine sales are completed during Q4 – median
size: 13,000 SF and price/SF: $110
Total Existing Inventory
vacancy) Existing Inventory
Total will help push
52,196,382
sale prices
52,196,382
»
Limited supply (7.12%
and lease rates higher during 2014
»
Vacancy increased from 6.20% Q3 to 7.12% Q4 due to
Dimension One Spa vacating a 128,000 SF building
Total Future Inventory
3,946,954
156,421
Proposed
Multi-Tenant
2013 Q4
3-POINT SUMMARY
1,946,822
Under Construction
2011
NORTH COUNTY INVENTORY DISTRIBUTION
NORTH COUNTY INVENTORY DISTRIBUTION
Total Future Inventory
3,946,954
Industrial Property Report 12
C
13. VISTA - YEAR END 2013
INDUSTRIAL STATS
Existing Properties
Type
Total
Inventory
SF
Bldgs
Distribution
24
Industrial
2,019,821
Direct
Vacant
SF
Direct
Vacancy
Rate
Absorption
Sublease
Vacant
SF
Total
Vacant
SF
Sublease
Vacancy
Rate
38,086
1.89%
0
0.00%
Total
Vacancy
Rate
38,086
Net
Absorption
SF QTR
1.89%
New Supply
Net
Absorption
SF YTD
New
Supply
SF QTR
UC / Proposed
New
Supply
SF YTD
Under
Construction
SF
17,362
38,438
0
0
UC
Availability
0
Proposed
SF
0.00%
272,493
36
503,675
52,406
10.40%
0
0.00%
52,406
10.40%
3,540
-38,778
0
0
0
0.00%
30,165
Manufacturing
326
7,180,781
580,855
8.09%
0
0.00%
580,855
8.09%
-138,145
-8,254
0
0
156,421
27.61%
134,000
Multi-Tenant
110
1,946,822
143,863
7.39%
8,006
0.41%
151,869
7.80%
13,172
47,175
0
0
0
0.00%
0
496
11,651,099
815,210
7.00%
8,006
0.07%
823,216
7.07%
-104,071
38,581
0
0
156,421
27.61%
436,658
R&D
34
1,743,149
130,223
7.47%
0
0.00%
130,223
7.47%
-5,940
-15,578
0
0
0
0.00%
41,842
R&D
34
1,743,149
130,223
7.47%
0
0.00%
130,223
7.47%
-5,940
-15,578
0
0
0
0.00%
41,842
Total
530
13,394,248
945,433
7.06%
8,006
0.06%
953,439
7.12%
-110,011
23,003
0
0
156,421
27.61%
478,500
Industrial
VISTA
VISTA HISTORICAL MARKET TRENDS
VISTA MARKET TRENDS
Weighted Monthly Average Asking Rents
VISTA INDUSTRIAL RENT TRENDS
$1.20
10%
300
9%
$1.10
8%
200
$1.00
100
6%
5%
0
4%
Vacancy Rate
SF (000s)
7%
$0.90
$0.80
3%
2%
-100
$0.70
$0.60
1%
-200
0%
2007
2008
2009
2010
2011
2012
2013 Q4
$0.50
2007
2008
2009
2010
2011
2012
2013 Q4
Distribution (NNN)
Net Absorption
New Supply
Vacancy
Manufacturing (NNN)
Multi-Tenant (Mod. Gross)
R&D (NNN)
SAN MARCOS HISTORICAL MARKET TRENDS
Industrial Property Report 13
14. 76
PACIFIC COAST
BUSINESS PARK
OCEAN RANCH
CORPORATE CENTER
North County San Diego
OCEAN VISTA
VENTURE COMMERCE
CENTER
AIRPORT
BUSINESS
PARK
INDUSTRY STREET
Total Industrial Buildings 2,535
Total Square Footage
52.2 M
Total Vacancy
8.59%
Under Construction
156,421
PRESCOTT
VISTA PACIFIC
SEAGATE
CORPORATE
CENTER
OCEANSIDE GATEWAY
RANCHO DEL ORO
78
OAK RIDGE
BUSINESS CENTER I
SYCAMORE VISTA
NORTH COUNTY
INDUSTRIAL PARK
TWIN OAKS
INDUSTRIAL
OAK RIDGE
BUSINESS CENTER II
5
GATEWAY
CENTER
CARLSBAD
RESEARCH
CENTER
SAN MARCOS
INDUSTRIAL PARK
CARLSBAD
OAKS NORTH
PALOMAR
TECH CENTER
RANCHO
VISTA
BUSINESS
PARK
CARLSBAD
OAKS WEST
WEST CARLSBAD
RANCHEROS
DRIVE
CARLSBAD RANCH
ESCONDIDO
AUTO PARK
EAST ESCONDIDO
INDUSTRIAL
UNIVERSITY AREA
CARLSBAD
CORPORATE
CENTER
CARLSBAD
AIRPORT CENTRE
CARLSBAD
OAKS EAST
CARLSBAD
RACEWAY
PALOMAR
CORPORATE
CENTER
LIBERTY
GATEWAY
PALOMAR
FORUM
PALOMAR AIRPORT
BUSINESS PARK
BRESSI RANCH
CORPORATE
CENTER
Prepared by:
ADAM MOLNAR
TUCKER HOHENSTEIN
MIKE ERWIN
760 438 8950
MEYERS/BARHAM
BUSINESS PARK
ESCONDIDO
RESEARCH &
TECHNOLOGY
CENTER
WINERDIGE
BUSINESS PARK
LA COSTA MEADOWS
INDUSTRIAL PARK
This document has been prepared by Colliers International for advertising and general information only. Colliers International makes no guarantees, representations
or warranties of any kind, expressed or implied, regarding the information including, but not limited to, warranties of content, accuracy and reliability. Any
interested party should undertake their own inquiries as to the accuracy of the information. Colliers International excludes unequivocally all inferred or implied
terms, conditions and warranties arising out of this document and excludes all liability for loss and damages arising there from.
Industrial Property Report 14