Luxottica FY14 Analyst & Investor presentation
•
4 likes•6,834 views

Luxottica reported record sales and profits in 2014. Sales increased 4.6% reported and 5.3% adjusted to over €7.6 billion, driven by strong growth in North America, Europe, and emerging markets. Adjusted operating income rose 14% and adjusted net income increased 15%, with free cash flow exceeding €800 million. Looking ahead, Luxottica expects another year of mid to high single-digit sales growth in 2015 at constant currencies.

Recommended
Recommended
More Related Content
What's hot
What's hot (20)
Viewers also liked
Similar to Luxottica FY14 Analyst & Investor presentation
Similar to Luxottica FY14 Analyst & Investor presentation (20)
Recently uploaded
Recently uploaded (20)
Luxottica FY14 Analyst & Investor presentation
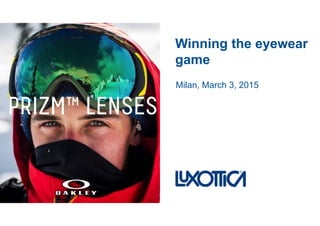
- 1. Winning the eyewearg y game Milan, March 3, 2015
- 2. FORWARD LOOKING STATEMENTS Certain statements in this investor presentation may constitute “forward-looking statements” as defined in the Private Securities Litigation Reform Act of 1995. Such statements involve risks, uncertainties and other factors that could cause actual results to differ materially from those which are anticipated. Such risks and uncertainties include, but are not limited to, our ability to manage the effect of the uncertain current global economic conditions on our business, our ability to successfully acquire new businesses and integrate their operations, our ability to predict future economic conditions and changes in consumer preferences, our ability to successfully introduce and market new products, our ability to maintain an efficient distribution network, our ability to achieve and manage growth our ability to negotiate and maintain favorable license arrangements the availability of correction alternatives tomanage growth, our ability to negotiate and maintain favorable license arrangements, the availability of correction alternatives to prescription eyeglasses, fluctuations in exchange rates, changes in local conditions, our ability to protect our proprietary rights, our ability to maintain our relationships with host stores, any failure of our information technology, inventory and other asset risk, credit risk on our accounts, insurance risks, changes in tax laws, as well as other political, economic, legal and technological factors and other risks and uncertainties described in our filings with the US Securities and Exchange Commission. These forward-looking statements are made as of the date hereof, and we do not assume any obligation to update them. This investor presentation contains measures that were not prepared in accordance with IAS/IFRS. For a reconciliation of non- IAS/IFRS measures used in these materials, see the Company’s press release titled “Luxottica net sales and profits reached record highs in 2014” dated March 2, 2015, available on the company’s website www.luxottica.com under the Investors tab. 2
- 3. 2014: CELEBRATING ANOTHER All-time high sales: over €7.6 billion RECORD YEAR • North America leading the way - LensCrafters back to solid growth Wholesale exceeding expectations- Wholesale exceeding expectations • Europe continuing its growth • Emerging markets stronger than ever • Sunglass Hut total sales up by 13.5%(1) Solid increase in adjusted operating income(3)(4): +14%,( )( ) up by 90bps at constant forex(1) Breaking the €800 million ceiling in free cash flow(3)g g (3) For additional disclosures regarding information in this presentation, please see “Notes to the presentation” in the Appendix 3Winning the eyewear game
- 4. STRONG MOMENTUM CONTINUES Solid competitive position • New leadership team reaping more opportunities and tackling the growing market complexity • First choice for fashion-luxury brands and new partners to explore the future of eyewear Strong operational execution • More diversified and effective distribution • Best-in-class service levels • Inventory optimization driving cash generation 4Winning the eyewear game
- 5. FY 2014 RESULTS AND 2015 OUTLOOK 5
- 6. STRONG SALES GROWTH 4Q 2014 FY 2014 x x x xAdjusted(3)(4) +14.9% Reported +13.4% Adjusted(3)(4) +5.3% Reported +4.6% xx xx +9.3% @c.fx(1) +7.9% @c.fx(1) Wholesale at constant forex(1) +6.7% @c.fx(1) +6.1% @c.fx(1) Wholesale at constant forex(1) xx xx +6.5% Retail comps(2) +8.6% Retail comps(2)xx xxRetail comps(2) +5.0% +4.0% Retail comps(2) For additional disclosures regarding information in this presentation, please see “Notes to the presentation” in the Appendix 6Winning the eyewear game
- 7. REVENUE ROADMAP BY GEOGRAPHY North America Western Europe Emerging markets +19% +11% +28% +22% +17% ale(1) +6% +7% +11% 4Q FY 4Q FY +4% +7% -8% +1% +14% +17% Wholesa Optical AustraliaNorth America Emerging markets 2013 2013 2014 2014 4Q 2013 FY 2013 4Q 2014 FY 2014 4Q 2013 FY 2013 4Q 2014 FY 2014 W +2% +2% +5% +3% +15% +12% +7% +10% fl t +4% fl t +1% Retail(2) +15 4Q 2013 FY 2013 4Q 2014 FY 2014 4Q 2013 FY 2013 4Q 2014 FY 2014 flat flat 4Q 2013 FY 2013 4Q 2014 FY 2014 R For additional disclosures regarding information in this presentation, please see “Notes to the presentation” in the Appendix 7Winning the eyewear game
- 8. 2014 ADJUSTMENTS TO REPORTED RESULTS Impact on Group sales (€ mn) Impact on Group operating income(3) (€ mn) Impact on Group net income(3) (€ mn) EyeMed change in presentation of net sales (2H 2014) • EyeMed sales presented on a net basis due to a change in the contractual terms of an insurance underwriting agreement -46.6 - - agreement E ti d d t 20 0 14 5Executive redundancy payments - -20.0 -14.5 Extraordinary tax charge for transfer pricing tax audits • Years 2008-2011 - - -30.3 8Winning the eyewear game
- 9. SOLID GROWTH IN ADJUSTED OPERATING PROFITABILITY(3)(4) Group (€ mn) Wholesale (€ mn) 90b @ f +110bps @c.fx.(1) 22.7% +90bps @c.fx.(1) 109 14.6% 15.3% 14.6% 15.5% 22.0% 1 065 1,178 658 725 94 4Q 2013 4Q 2014 FY 2013 FY 2014 11.4% 1,065 Retail (€ mn) +60bps @c.fx.(1) 164 215 636 10.0% % 10 8% 12.5% 13.5% 14.1% 586 FY 2013 FY 20144Q 2013 4Q 2014 For additional disclosures regarding information in this presentation please see “Notes to the 10.8% 149 109 4Q 2013 4Q 2014 FY 2013 FY 2014 For additional disclosures regarding information in this presentation, please see Notes to the presentation” in the Appendix 9Winning the eyewear game
- 10. STRONG GROWTH IN ADJUSTED NET INCOME(3)(4) and EPS(3)(4) Group (€ mn) EPS (€ cents) 687 +70bps @c.fx.(1) 8.4% 8.9% 0 20 0.25 1.31 1.44 617 EPS (US$ cents)6 4% 0.20 4Q 2013 4Q 2014 FY 2013 FY 2014 ( $ ) 93 122 5.6% 6.4% 1.74 1.92 FY 2013 FY 20144Q 2013 4Q 2014 0.27 0.32 4Q 2013 4Q 2014 FY 2013 FY 2014 For additional disclosures regarding information in this presentation, please see “Notes to the presentation” in the Appendix 10Winning the eyewear game
- 11. RECORD FREE CASH FLOW(3) GENERATION DRIVING DELEVERAGE 1,461 1 013 Net debt(3) (€ mn) Reduction in Net debt/adjusted EBITDA(3)(4) to 0.6x in 2014 • €308 million dividend payment €44 illi i t d i i iti Strong free cash flow generation 1,013 FY 2013 FY 2014 Free cash flow(3) (€ mn) • €44 million invested in acquisitions Strong free cash flow(3) generation • Profitability improvement and effective working capital control • Capex equal to €419 million 648 802 Free cash flow(3) (€ mn) ∆ days DSO 3 FY 2013* FY 2014 Operating working capital (€ mn) *FY 2013 excludes extraordinary tax payment of €38 million • DSO -3 • DSI -10 • DPO +1 -14 26 FY 2013 FY 2014 11 For additional disclosures regarding information in this presentation, please see “Notes on the presentation” in the Appendix Winning the eyewear game
- 12. FIFTH YEAR IN A ROW DELIVERING ON “RULE OF THUMB”(1) Consistent execution pays off Adjusted(1)(3)(4) +7%HIGH SINGLE-DIGIT j (1)(3)(4) SALES GROWTH +14%2x SALES GROWTHOPERATING INCOME +15%2x SALES GROWTHNET INCOME BELOW 0.75xNET DEBT/EBITDA(3) 0.6x 12 For additional disclosures regarding information in this presentation, please see “Notes to the presentation” in the Appendix Winning the eyewear game
- 13. PROPOSED DIVIDEND PAYMENT FOR 2014: €1.44 PER SHARE Time to give cash back to shareholders DPS (€) & Payout (%) 0.72 DPS (€) & Payout (%) Ordinary DPS +122% 0 Extraordinary DPS 0.44 0.49 0.58 0.65 0.72 50% 50% 50% 50%Ordinary payout (%) 2010 2011 2012 2013 2014E 50% 13 % % 50%y p y ( ) 50% Winning the eyewear game
- 14. INCREASING CAPITAL INVESTMENTS TO FUEL GROWTH €230 milion 4% of Group sales €419 milion 5.5% of Group sales 5.5% of Group sales 55%45% 53%47% 48%52% 2010 2014 2015E Maintenance Growth 14Winning the eyewear game
- 15. 2015: ANOTHER “RULE OF THUMB” YEAR Constant forex(1) MID TO HIGH SINGLE-DIGITADJUSTED SALES(3)(4) GROWTH 2x SALES GROWTH 2x SALES GROWTHNET INCOME OPERATING INCOME 0.6xNET DEBT/EBITDA(3) 15 For additional disclosures regarding information in this presentation, please see “Notes to the presentation” in the Appendix Winning the eyewear game
- 16. 2015E: FOREX, FROM HEADWIND TO TAILWIND 2014 sales breakdown 2014 costs breakdown CNY 2% Other 12% % CNY 6% Other 9% AUD 7% BRL 4% USD 53% AUD 6% BRL 3% USD 55% EUR 20% USD 53% EUR 23% 16Winning the eyewear game
- 17. A GLIMPSE INTO 2015 January and February Group sales off to a good start Strong momentum for brand portfolio • Solid order portfolio • Global launch of Michael Kors; 2015E sales to reach €70 million Expected positive contribution from currencies 17Winning the eyewear game
- 18. LEADING PRODUCT INNOVATION AND SUPPLY C C SSCHAIN EFFECTIVENESS 18
- 19. VERTICAL INTEGRATION Business model structurally centered around this Luxottica’s core DNA Business model structurally centered around this competitive advantage • In-house cutting edge R&D • Exponentially growing distinctive and unique know-how • Supporting unmatched innovation capabilities • Operational key strengths: automation, efficiency, flexibility and time-to-market 19Winning the eyewear game
- 20. MADE IN LUXOTTICA: THE BACKBONE OF FUTURE GROWTH A growing and efficient production platform US* Brazil* Italy* China & India* % 3% 0% 0%2012 7% 3% 50% 40% 2014 10% 4% 43% 43% Exploring further geographic production diversification 10% 4% 39% 46%2016E 20 Exploring further geographic production diversification*Production output Winning the eyewear game
- 21. SIMPLIFICATION TO MANAGE GROWING TECHNOLOGICAL COMPLEXITY Managing mix diversification 25% 33% 34% Technologies breakdown (%) • Aluminum, wood, die casting, fabrics, LiteForce technology • Plastic injection fast lines 44% 32% 31% 35% 36% j • Sun lenses colors and coatings 44% 32% 30% 2010 2014 2016E Metal Injected Acetate Complexity reduction • New lifecycle management program SKUs • Optimizing introduction of new styles 21 2013 2014 2015E 2016E Winning the eyewear game
- 22. OPTIMIZING LOGISTICS Direct shipments Leveraging direct shipments from primary distribution centers Direct shipments 2013 2014 2016E From 18 to 14 distribution centers by 2016 22 From 18 to 14 distribution centers by 2016 Winning the eyewear game
- 23. FURTHER DRIVING EFFECTIVENESS AND EFFICIENCY Improving service levels and cash generation Inventories (days)Lead time Inventories (days)Lead time ~-10% ~-10% Room for further improvements 20142013 2016E 20142013 2016E 23 Room for further improvements Winning the eyewear game
- 24. COMBINING CRAFTSMANSHIP WITH FULL AUTOMATION Lauriano Ray-Ban Cube Bringing forward efficiencies while uncompromizing on quality 24 Bringing forward efficiencies while uncompromizing on quality Winning the eyewear game
- 25. INNOVATION: ALWAYS AT THE INDUSTRY FOREFRONT Prizm lens 25Winning the eyewear game
- 26. INNOVATION: ALWAYS AT THE INDUSTRY FOREFRONT Pushing the boundaries of eyewear 26Winning the eyewear game
- 27. INNOVATION: ALWAYS AT THE INDUSTRY FOREFRONT Wood frame 27Winning the eyewear game
- 28. INNOVATION: ALWAYS AT THE INDUSTRY FOREFRONT Razor 28Winning the eyewear game
- 29. INNOVATION: ALWAYS AT THE INDUSTRY FOREFRONT Lace-engraved acetate 29Winning the eyewear game
- 30. LEADING THE EVOLUTION OF EYEWEAR 30
- 31. A JOURNEY TOWARDS LONG-TERM SUSTAINABLE GROWTH Huge opportunities still lay ahead Transformational Leading eyewearGrowingTransformational acquisitions LensCrafters Leading eyewear evolution Ne markets/brands Growing over the cycle Vertical integrationLensCrafters Ray-Ban Sunglass Hut OPSM New markets/brands E-commerce Innovation Efficiencies Vertical integration Brand portfolio Emerging markets OPSM Cole National Oakley Efficiencies Returns M&A 1995 20142007 2008 2015 2020 Continuing to balance top line growth with margin expansionContinuing to balance top line growth with margin expansion 31Winning the eyewear game
- 32. EYEWEAR: A STRUCTURALLY GROWING INDUSTRY Accelerating growth rate: >30% in the next 5 years ~900 mn~900 mn ~1,200 mn frames ~1,200 mn frames framesframes Emerging markets Emerging marketsDeveloped markets D l d marketsDeveloped markets Today In 5 years 32 Source: Euromonitor and company estimates Winning the eyewear game
- 33. SECULAR GROWTH DRIVERS SUPPORTING LONG-TERM GROWTH DEMOGRAPHICS • Additional 500 million vision correction wearers by 2020 I d d f i d b h i l h DEMOGRAPHICS • Increased need for eye correction due to behavioral changes 60% f l b l l ti h i i d b t l 25% PENETRATION • 60% of global population has vision needs but only 25% pursue vision correction • Evolving and elevating the eyewear category in all markets and channelschannels PREMIUMIZATION • The smallest and fastest growing category within accessories PREMIUMIZATION • 80% of US customers buy sunglasses <US$50 33Winning the eyewear game
- 34. NORTH AMERICA: THE LARGEST MARKET YET STILL EMERGING Industry to grow to US$44-47 billion by 2020 vs. US$35.5 billion in 2013 2008 2011 2014 2016E 4,880 4,799 5,705 Total sales US$ million , % of total Group sales ~65% ~57% ~56% - % of polarized sold by Sunglass Hut ~35% ~42% ~50% ~52% 34Winning the eyewear game
- 35. A LOCAL PLAYER IN THE EMERGING MARKETS 2008 2011 2014 2016E Total sales € million 409 708 1,168 % of total Group sales € million ~8% ~11% ~15% - Store footprint 360 ~1,000 ~1,340 ~2,000 Wholesale subsidiaries 3 4 17 p ~360 23 35Winning the eyewear game
- 36. HOW TO WIN THE EYEWEAR GAME Our differentiation points V ti l i t ti• Vertical integration • Scale and efficiency • InnovationInnovation • A business portfolio designed to win • Wholesale: state-of-the-art go-to-market approach • Proven retail model 36Winning the eyewear game
- 37. DOUBLING SALES OVER THE NEXT 10 YEARS Shaping our long-term growth Extracting the brands’ full potentialExtracting the brands full potential • Oakley replicating Ray-Ban’s success story Elevating service levels • STARSSTARS • My.Luxottica Expanding premium sun penetration • Sunglass Hut driving evolution of sun category• Sunglass Hut driving evolution of sun category New channels to win new consumers • E-commerce supercharging penetration • Department stores and travel retail the point of reference for• Department stores and travel retail the point of reference for premium consumer Unmatched presence in emerging markets • Seizing opportunities in China and Latin America 37 • Seizing opportunities in China and Latin America Winning the eyewear game
- 38. 2015E: LEVERAGING GROWTH ENGINES AND GLOBAL PRESENCE M i d t i b d hil i k tManaging and nurturing brands while growing across markets )rands(1 Total sales: +12-14%+8-10% +8-10% Br Comps(2): +3-4% kets(1) Europe +5-7% Asia-Pacific +10-14% Latin America +16-20% North America +4-6% Mark +5 7% +10 14% +16 20%+4 6% Wholesale(1) +9-11% Retail(2) +3-5% 38 For additional disclosures regarding information in this presentation, please see “Notes to the presentation” in the Appendix Winning the eyewear game
- 39. WHOLESALE: BURSTING THROUGH THE LIMITS 39
- 40. 2014: STRONG TRADING ENVIRONMENT IN NORTH AMERICA AND EMERGING MARKETS 24 0% Wholesale (€ mln) EMERGING MARKETS 22.7% 22 0% 24.0% Continuous sound growth in sales and market share gains in North America • Outperforming the market: sales +11% in US$ 20 7% 21.5% 21.8% 22.0% 20 0% 22.0% Strong growth across key emerging markets • Go direct strategy in Southeast Asia in line with plan 20.7% 20.0%• Go-direct strategy in Southeast Asia in line with plan - Successful first year in Thailand - Malaysia opening completed 18.0% 2010 2011 2012 2013 2014 Sales Adj. operating margin % Positive growth in Europe, gaining market share in the optical business in major markets (3)(4) 40Winning the eyewear game
- 41. NORTH AMERICA: SOLID FOUNDATION FOR FUTURE GROWTH R l tl l th i N th A i FOR FUTURE GROWTH Relentless sales growth in North America • Five-year CAGR >10% in US$ A unique brand portfolioA unique brand portfolio • Michael Kors to strengthen the product offering • Tory Burch, among the top five eyewear brands in North A iAmerica Enhanced organization driving efficiency going forward • Luxury sales force realignment • STARS roll-out: +750 doors • Supply chain optimization 41Winning the eyewear game
- 42. EUROPE: ANOTHER YEAR OF MARKET SHARE GAINS 2014 l 2 5% SHARE GAINS 2014 sales: +2.5%(1) • Continental and Eastern Europe on fast track, no sunshine in Mediterranean countries Reaping the benefits of European reorganization • Free up resources to boost marketing investments Pioneering new ways of engaging customers • Best-in-class service levels • Shift in distribution: +1,070 STARS doors, more to come 42Winning the eyewear game For additional disclosures regarding information in this presentation, please see “Notes to the presentation” in the Appendix
- 43. ASIA: CHINA, INDIA AND SOUTHEAST ASIA THE RISING “STARS”THE RISING “STARS” 2014: double-digits sales growth in China, India and Southeast Asia • Ray-Ban and Oakley leading the way, luxury confirming lid tsolid momentum Enhancing distribution • Dedicated organizations for Ray-Ban and Oakley • STARS development of approx. 240 new doors in 2014, another approx. 540 planned for 2015 Go-direct strategy in Southeast Asia • Ready for Indonesiay 43Winning the eyewear game
- 44. BRAZIL, EDGING CLOSER TO #2 LARGEST WHOLESALE MARKET 2014 sales: +17% LARGEST WHOLESALE MARKET 2014 sales: +17%(1) • Solid growth across the entire portfolio, with outstanding performance of luxury brands Leveraging local presence • Approximately 50% of units sold are “Made in Brazil” • Service level now aligned to developed market standardsService level now aligned to developed market standards • Distribution deeply rooted Leveraging multichannel platform • STARS, e-com, My.Luxottica • Expand international brands to additional 4,000 doors currently selling only local collections 44Winning the eyewear game For additional disclosures regarding information in this presentation, please see “Notes to the presentation” in the Appendix
- 45. RONA: MULTIBRAND STRATEGY TO GROW CEYEWEAR AND EYE CARE 45
- 46. RESTORED GROWTH AT LENSCRAFTERS Strong improvements across the board 2014 comps(2): +1 8%2014 comps(2): +1.8% • 1Q: -1.8%; 2Q: +0.9%; 3Q: +2.5%; 4Q: +6.3% Performance improving quarter after quarterPerformance improving quarter after quarter • +2.7% sales from eye exams (+6.8% in 4Q) • +3.8% conversion rate “ ”• +120bps “Right the First Time” Continuous profitability growth L b d i i i• Labor productivity improvement • Discount reduction • Labs service, lens mix, waste & shrink 46 For additional disclosures regarding information in this presentation, please see “Notes to the presentation” in the Appendix Winning the eyewear game
- 47. EFFECTIVE EXECUTION Foundations set in 2014 to drive future growth Eye care • Brand’s essence: sharp focus on eye exams and doctors • Major operational improvements Customer serviceCustomer service • Customer satisfaction: “Right the First Time” and speed • New field organization and incentive system Operational effectiveness • Segmentation, enhanced product planning • CRM digital direct marketing• CRM, digital, direct marketing • Labor acumen, investment, rebalancing • Performance management • Labs service efficiency quality speed• Labs service, efficiency, quality, speed 47Winning the eyewear game
- 48. US$100 MILLION INVESTMENTS IN 2015 Elevating the optical customer experience to the next level RONA • Digital tools to simplify, improve and personalize customer, doctor and associate experience • CRM: new analytics and campaign management, predictive modeling, centralized call center • Continued expansion and strengthening of EyeMed LensCrafters • New, state-of-the-art iPad-enabled POS system • Updating the store base • Customer notification and doctors’ digital toolkit • Expanding Digital AccuExam 48Winning the eyewear game
- 49. SUN SHINES AT SUNGLASS HUT 49
- 50. 2014: ANOTHER SUNNY YEAR Total sales up by 13.5%(1), global comps(2) up by 7.4% • Strong growth in luxury and premium/fashion: now at 30% of total sales • Polarized: record levels in North America and solid growth in RoW Leveraging brand equity and recognition • Brand health indicators reaching an all time-high in keyBrand health indicators reaching an all time high in key markets: US, Australia and South Africa • Owning summer with the largest media campaign ever launched in USA, Australia, Iberia, UK and South Africa, , , Effective execution driving profitability growth 50Winning the eyewear game For additional disclosures regarding information in this presentation, please see “Notes to the presentation” in the Appendix
- 51. SUNGLASS HUT RECOGNIZED AS THE SUN AUTHORITY Always new & fabulous at Sunglass Hut SUN AUTHORITY Always new & fabulous at Sunglass Hut • 130 million people visit Sunglass Hut every year • Selling 15 sunglasses every minute • 90 new styles per month Attracting and engaging customers across channelsAttracting and engaging customers across channels • Strong culture, training and staff engagement driving solid growth in conversion globally Record sales on Black Friday in North America: US$10 million 51Winning the eyewear game
- 52. THE PATH TO DIGITAL CITIZENSHIP CONTINUES Global online reach: 13 countries six languages CONTINUES Global online reach: 13 countries, six languages • Four e-com websites generating >26 million visits, 130 million page views and sales up by 45% • Mobile websites activated in all markets: traffic +66% and conversion +49% in 2014 Omni channel stepping for ardOmni channel stepping forward • “Experience 360” in North America and Australia: an endless assortment available in all stores; UK and Brazil t f llto follow • Traffic and sales boost through digital windows E com ready to reach 5 10% of global chain sales by 2017 52 E-com ready to reach 5-10% of global chain sales by 2017 Winning the eyewear game
- 53. SUNGLASS-HUTIZATION: THE JOURNEY TO DATE Store productivity in North America: approx 250 stores TO DATE Store productivity in North America: approx. 250 stores with over US$1 million and over 40 stores over US$2 million in annual sales • Times Square Flagship continues to break records with• Times Square Flagship continues to break records with over US$10 million annual sales in 2014 and 3,000 daily visitors Successful global footprint expansion with entry in four additional countries in 2014 O 250 t i 2014• Over 250 new stores in 2014 - Entered Malaysia and Indonesia - Travel retail locations in Mexico 53Winning the eyewear game
- 54. 2015E: LEADING FASHION-FORWARD SUN TRENDS Total sales expected to grow double-digits for the sixth SUN TRENDS year in a row • E-com, travel retail and department stores the fastest growing channels Growing retail presence: +280 stores planned in 2015 • Significant expansions in Indonesia, Thailand, Mexico, Spain • Entry into Mainland China: over 30 stores by year end - Expected to reach the highest luxury sales penetration • Exploring new opportunities in host model environmentExploring new opportunities in host model environment More investments in IT, digital and marketing • Bringing forward the “LOVE” brand journey globally T ti 4 000 t b 2016Targeting 4,000 stores by 2016 54Winning the eyewear game
- 55. OneSight is a non-profit leading the global effort to provide permanent access to quality vision care and eyewear in underserved communities worldwide. Since 1988, OneSight has engaged thousands of skilled volunteers across Luxottica and other industry partners to hand-deliver sight to 9 million people in 41 countries. FY 2014 RESULTS Vision care programs OneSight helped 154,359 people through 42 vision clinics and numerous community o treach programs and pro ided charitable care in Vietnam and Indonesia for the first timeoutreach programs, and provided charitable care in Vietnam and Indonesia for the first time. Sustainable programs OneSight supports four permanent vision centers and a central manufacturing lab in The Gambia, a country in West Africa that previously had one optometrist to serve 1.8 million l Th t id t ff d bl i i I 2014 17 688 G bi Constantine is a student earning her master’s degree in climate change. Without glasses, she could not see to people. These centers provide access to affordable vision care. In 2014, 17,688 Gambians received care across vision centers in Farafenni, Bansang Kanifang and Brikama. Overall, 900,000 Gambians now have access to vision care! By the end of 2015, four more vision centers will open to serve the vision care needs of the entire country. Research programs c ate c a ge t out g asses, s e cou d ot see to read and had particular difficulty studying at night. Now, with her glasses from the vision center at Farafenni Regional Hospital, she is equipped to finish her degree. She has the clear vision she needs to excel at the work she loves: educating her fellow Gambians and working Research programs OneSight has extended its partnership with REAP, a conglomerate of Chinese NGOs. The project first focused on research to determine the vision care needs of children living in rural China and efforts to increase awareness and inform policy makers. As a result of this work, the Chinese government has acknowledged vision care’s role in improving educational to create a better future for her country. 2014 OneSight Vision Center in The Gambia g g p g outcomes. The next phase of the study will test a vision center model in rural China. 55OneSight
- 56. APPENDIX 56
- 57. NOTES ON THE PRESENTATION › 1 Figures at constant exchange rates are calculated using the average exchange rates in effect during the corresponding period of the previous year. Please refer to the “Major currencies” table in the press release titled › 3 Net debt / EBITDA, net debt / adjusted EBITDA, net debt, EBITDA, adjusted EBITDA, adjusted operating income, adjusted operating margin, adjusted net income adjusted net sales adjusted earnings per shareto the Major currencies table in the press release titled “Luxottica net sales and profits reached record highs in 2014” dated March 2, 2015 available at the www.luxottica.com website under the Investors tab. income, adjusted net sales, adjusted earnings per share and free cash flow are not measures in accordance with IAS/IFRS. For additional disclosure, see the press release titled “Luxottica net sales and profits reached record highs in 2014” dated March 2 2015 available at › 2 Comparable store sales reflect the change in sales from one period to another, that, for comparison purposes, includes in the calculation only stores open in the more recent period that also were open during the record highs in 2014 dated March 2, 2015 available at the www.luxottica.com website under the Investors tab. › 4 Excluding non-recurring items the more recent period that also were open during the comparable prior period, and applies to both periods the average exchange rate for the prior period and the same geographic area. › 5 Equals interest income minus interest expenses › 6 Equals extraordinary income minus extraordinary expenses › 7 Net debt figures are calculated using the average exchange rates used to calculate EBITDA figures 57Appendix
- 58. RETAIL COMPARABLE STORE SALES(2) 4Q 2014 FY 2014 Optical North America • LensCrafters +6.3% +1.8% • Licensed brands +8.0% +6.2% Optical Australia/New Zealand +0.2% +1.4% Sunglass Hut worldwide +5.9% +7.4% Group retail +5.0% +4.0% 58 p Appendix
- 59. SALES BREAKDOWN 2014 2013 EUR mln FY 2012 % FY 2013 % FY 2014 % Curr. FX Const. FX Europe 1,317 19% 1,443 20% 1,507 20% 4.5% 4.6% Wholesale 1,183 17% 1,273 17% 1,295 17% 1.8% 2.5% 2014 vs. 2013 Retail 134 2% 170 2% 212 3% 24.6% 21.1% North America 4,123 58% 4,124 56% 4,287 56% 4.0% 4.2% Wholesale 742 10% 763 10% 841 11% 10.3% 11.2% Retail 3,381 48% 3,361 46% 3,445 45% 2.5% 2.6%Retail 3,381 48% 3,361 46% 3,445 45% 2.5% 2.6% Asia-Pacific 985 14% 1,005 14% 1,050 14% 4.5% 9.5% Wholesale 348 5% 386 5% 433 6% 12.0% 15.9% Retail 637 9% 618 8% 617 8% -0.2% 5.5% Latam 427 6% 470 6% 506 7% 7.6% 15.3% Wholesale 299 4% 324 4% 350 5% 8.1% 15.4% Retail 128 2% 146 2% 156 2% 6.6% 15.2% f 3% 4% 4% % %Rest of the World 234 3% 271 4% 303 4% 11.5% 13.3% Wholesale 201 3% 245 3% 274 4% 11.8% 12.4% Retail 33 0% 26 0% 29 0% 8.9% 22.0% GROUP TOTAL 7,086 100% 7,313 100% 7,652 100% 4.6% 6.1% 59Appendix
- 60. DEBT OVERVIEW Adj EBITDA 1 431 1 562 FY 2013*FY 2013* FY 2014FY 2014 Dec. 31, 2013 Dec. 31, 2013 Dec. 31, 2014 Dec. 31, 2014 ΔΔ Adj. EBITDA(3)(4) 1,431 1,562 ∆ working capital 75 107 Capex (370) (419) Net US$ debt(3) (518) (352) 166 Net € debt(3) (1,086) (723) 363 Capex (370) (419) Operating cash flow 1,136 1,250 Translation adj. (1) € 1 = US$ 1.3791 1.2141 Net debt (€) (1 461) (1 013) 449Financial charges(5) (92) (98) Taxes paid (390) (349) E di Net debt (€)(3) (1,461) (1,013) 449 Net debt/adj. EBITDA(3)(4) 1.0x 0.6x Extraordinary charges(6) (6) (1) Free cash flow(3) 648 802 Net debt/adj. EBITDA excluding exchange rate effect(3)(4)(7) 1.0x 0.6x 60 *FY 2013 excludes extraordinary tax payment of €38 million (3)(4)(7) Appendix
- 61. INVESTOR RELATIONS TEAM Tel. +39 (02) 8633 - 4662 Alessandra Senici Upcoming events A il 24 G l M ti f St kh ld ( ) alessandra.senici@luxottica.com Tel +39 (02) 8633 4038 Elena Dimichino › April 24 – General Meeting of Stockholders › May 4 – 1Q 2015 results › July 27 – 2Q 2015 results Tel. +39 (02) 8633 - 4038 elena.dimichino@luxottica.com Giorgio Iannella › October 26 – 3Q 2015 results http://www.luxottica.com/en/company/investors/financial-calendar Tel. +39 (02) 8633 - 4510 giorgio.iannella@luxottica.com Elisa Cattaruzza Tel. +39 (02) 8633 - 4870 elisa.cattaruzza@luxottica.com 61
- 62. SOCIAL MEDIA CONTACTS Like our Luxottica Group page Instagram.com/Luxotticagroup @@Luxottica Pinterest.com/Luxotticagroup LinkedIn.com/company/Luxottica_Group Youtube com/luxotticagroupYoutube.com/luxotticagroup Slideshare.net/LuxotticaGroup 62