Autotask Performance Dashboard with Analytics
•
0 likes•534 views

Is your business poised for long-term growth? Which engineers are under-performing? Are you meeting all of your SLA commitments? How do you know if your services are priced correctly? Who is your most profitable client? Understand your business. ===================================================== For more information about Autotask: Integrated Computer Systems, Inc. 3/F Limketkai Bldg., ortigas Ave., Greenhills, San Juan City 1502 Philippines Tel: (+63 2) 744 3000 • 727 3801 Fax: (+63 2) 721 4502 • 621 9464 Email: info@ics.com.ph Website: http://www.ics.com.ph

Recommended
Recommended
More Related Content
More from Integrated Computer Systems, Inc.
More from Integrated Computer Systems, Inc. (20)
Recently uploaded
Recently uploaded (20)
Autotask Performance Dashboard with Analytics
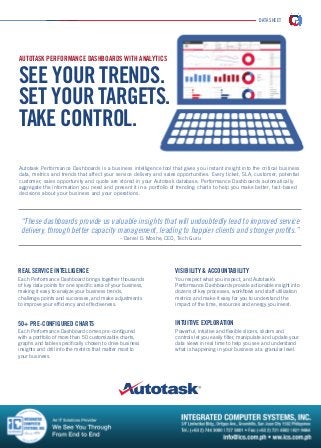
- 1. data sheet Autotask PERFORMANCE DASHBOARDS with Analytics SEE YOUR TRENDS. SET YOUR TARGETS. TAKE CONTROL. Autotask Performance Dashboards is a business intelligence tool that gives you instant insight into the critical business data, metrics and trends that affect your service delivery and sales opportunities. Every ticket, SLA, customer, potential customer, sales opportunity and quote are stored in your Autotask database. Performance Dashboards automatically aggregate the information you need and present it in a portfolio of trending charts to help you make better, fact-based decisions about your business and your operations. “These dashboards provide us valuable insights that will undoubtedly lead to improved service delivery, through better capacity management, leading to happier clients and stronger profits.” – Daniel D. Moshe, CEO, Tech Guru REAL SERVICE INTELLIGENCE VISIBILITY & ACCOUNTABILITY Each Performance Dashboard brings together thousands of key data points for one specific area of your business, making it easy to analyze your business trends, challenge points and successes, and make adjustments to improve your efficiency and effectiveness. You respect what you inspect, and Autotask’s Performance Dashboards provide actionable insight into dozens of key processes, workflows and staff utilization metrics and make it easy for you to understand the impact of the time, resources and energy you invest. 50+ PRE-CONFIGURED CHARTS INTUITIVE EXPLORATION Each Performance Dashboard comes pre-configured with a portfolio of more than 50 customizable charts, graphs and tables specifically chosen to drive business insights and drill into the metrics that matter most to your business. Powerful, intuitive and flexible slicers, sliders and controls let you easily filter, manipulate and update your data views in real time to help you see and understand what is happening in your business at a granular level.
- 2. data sheet INSTANT ACCESS TO YOUR OWN BIG DATA Performance Dashboards combine Autotask’s reliable cloud data service and the unique power of Microsoft’s Business Intelligence Platform - including Excel, SQL Server, Sharepoint and PowerPoint - to provide a powerful, portable and familiar way to access, interact with and use your own big data in ways you never thought possible before. Easy to set up. Easy to use. Simply enter your credentials and go. Your data typically refreshes in less than a minute and automatically updates all of your charts, graphs and tables in real time. FOCUS ON THE METRICS THAT MATTER SERVICE PERFORMANCE DASHBOARDS Analyze service delivery workflow data and trends from start to finish. Is your backlog growing or shrinking? Which days and times are you most likely to miss first response SLAs? How do your clients feel about your services? Knowing the answers will help you improve staff utilization and management, adjust billing rates and optimize your procedures and processes. SALES & OPPORTUNITY PERFORMANCE DASHBOARDS Can you accurately predict your revenue stream next week? Next month? Next quarter? Without real-time visibility into your sales pipeline it is impossible to scale your operations to meet your clients needs. The Sales & Opportunity Dashboard gives you access to all the sales trend and success data you need to know at a glance what new business is likely to close - and what is at risk. Top 5 Services Metrics that Matter Top 5 Sales Metrics that Matter 1. 2. 3. 4. 5. 1. 2. 3. 4. 5. Opening Ticket Balances Backlog Over 30 Days Tickets Opened Tickets Completed Tickets Added to Backlog Corporate Headquarters East Greenbush, USA T + 1 518 720 3500 www.autotask.com ©2013 Autotask Corporation International Headquarters London, England T +44 20 3006 3147 DS PDB US LTR 082113 Recurring Monthly Revenue Opportunities Closed One-Time Fee Opportunities Closed Professional Services Opportunities Closed Consulting Services Opportunities Closed Hardware / Software Opportunities Closed Germany Munich, Germany T +49 (0) 89 5908 2069 Asia Beijing, China T +86 010 8278 4881 All trademarks used are the property of their respective owners. All rights reserved. Australia Sydney, Australia T +61 2 8103 4001