December 2013 Multi-family Housing Activity Report – Boston, MA Real Estate
•
1 like•401 views

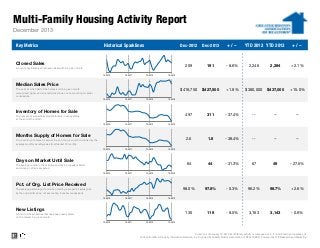
Here’s December 2013′s Monthly Multi-family Housing Activity Report from the Greater Boston Association of Realtors®. What Was Going On With Multi-family Housing Activity In November? (Comparing December 2013 to December 2012) • Closed sales were down -8.6% • Median prices were up +1.8% • Inventory of homes for sale were down -37.4% • Months supply of homes for sale were down -38.4% • Days on market until sale were down -0.3% • Percentage of original list price received were up +1.5% • New Listings were down -8.5%

Recommended
Recommended
More Related Content
More from Unit Realty Group
More from Unit Realty Group (20)
Recently uploaded
Recently uploaded (20)
December 2013 Multi-family Housing Activity Report – Boston, MA Real Estate
- 1. 5B Multi-Family Housing Activity Report December 2013 Key Metrics Historical Sparklines Dec-2012 2,294 + 2.1% $427,500 + 1.8% $380,000 $437,000 + 15.0% 311 - 37.4% -- -- -- 1.6 - 38.4% -- -- -- 64 44 - 31.3% 67 49 - 27.5% 98.0% 97.8% - 0.3% 96.2% 98.7% + 2.6% 130 12-2012 2,246 2.6 12-2011 - 8.6% 497 12-2010 191 $419,750 A count of actual sales that have closed within a given month. +/– 209 Closed Sales Dec-2013 YTD 2012 YTD 2013 +/– 119 - 8.5% 3,163 3,143 - 0.6% 12-2013 Median Sales Price The point at which half of the homes sold in a given month were priced higher and one half priced lower, not accounting for seller concessions. 12-2010 12-2011 12-2012 12-2013 Inventory of Homes for Sale The number of properties available for sale in active status at the end of the month. 12-2010 12-2011 12-2012 12-2013 Months Supply of Homes for Sale The inventory of homes for sale at the end of a given month, divided by the average monthly pending sales from the last 12 months. 12-2010 12-2011 12-2012 12-2013 Days on Market Until Sale The average number of days between when a property is listed and when an offer is accepted. 12-2010 12-2011 12-2012 12-2013 Pct. of Org. List Price Received The average percentage found when dividing a property's sales price by the original list price, not accounting for seller concessions. 12-2010 12-2011 12-2012 12-2013 New Listings A count of the properties that have been newly listed on the market in a given month. 12-2010 12-2011 12-2012 12-2013 Current as of January 16, 2014. Multi-family activity is comprised of 2-, 3- and 4-family properties only. All data from MLS Property Information Network, Inc. Provided by Greater Boston Association of REALTORS®. Powered by 10K Research and Marketing.
- 2. Multi-Family Housing Activity Report – 2-Family Properties December 2013 Closed Sales Median Sales Price Days on Market Inventory 12-2012 Acton Arlington Ashland Attleboro Bedford Bellingham Belmont Boston Boxborough Brookline Burlington Cambridge Canton Carlisle Chelsea Concord Dedham Dover Everett Foxborough Framingham Franklin Holliston Hopkinton Hudson Lexington Lincoln Malden Mansfield Marlborough Maynard Medfield Medford Medway Milford Millis Milton Natick Needham Newton 12-2013 +/– 12-2012 12-2013 +/– 12-2012 12-2013 +/– 12-2012 12-2013 +/– 0 4 0 4 1 1 5 38 0 0 0 5 1 0 6 0 2 0 3 0 2 0 0 0 0 0 1 9 1 1 0 1 8 1 2 0 2 0 0 3 0 2 0 5 0 0 4 35 0 2 0 3 1 0 3 0 1 0 9 1 4 0 0 0 2 0 0 12 0 3 0 0 7 0 2 0 1 2 3 2 -- 50.0% -+ 25.0% - 100.0% - 100.0% - 20.0% - 7.9% ---- 40.0% 0.0% -- 50.0% -- 50.0% -+ 200.0% -+ 100.0% ------ 100.0% + 33.3% - 100.0% + 200.0% -- 100.0% - 12.5% - 100.0% 0.0% -- 50.0% --- 33.3% $0 $606,000 $0 $171,000 $355,000 $220,000 $593,000 $398,000 $0 $0 $0 $1,060,000 $335,000 $0 $232,500 $0 $320,000 $0 $345,000 $0 $142,450 $0 $0 $0 $0 $0 $156,900 $330,000 $295,000 $168,000 $0 $299,000 $470,500 $292,500 $183,500 $0 $427,500 $0 $0 $590,000 $0 $539,000 $0 $179,900 $0 $0 $770,500 $425,000 $0 $1,498,000 $0 $835,000 $250,000 $0 $355,000 $0 $338,000 $0 $385,000 $280,000 $298,600 $0 $0 $0 $237,500 $0 $0 $412,500 $0 $220,000 $0 $0 $526,000 $0 $200,000 $0 $440,500 $482,750 $789,000 $715,000 -- 11.1% -+ 5.2% - 100.0% - 100.0% + 29.9% + 6.8% ---- 21.2% - 25.4% -+ 52.7% -+ 5.6% -+ 11.6% -+ 109.6% ------ 100.0% + 25.0% - 100.0% + 31.0% -- 100.0% + 11.8% - 100.0% + 9.0% -+ 3.0% --+ 21.2% 0 11 0 129 81 49 50 47 0 0 0 21 42 0 51 0 188 0 71 0 35 0 0 0 0 0 15 119 85 205 0 60 52 454 101 0 99 0 0 94 0 18 0 116 0 0 31 45 0 8 0 7 25 0 53 0 8 0 47 49 53 0 0 0 178 0 0 44 0 55 0 0 31 0 4 0 21 62 4 68 -+ 71.4% -- 9.9% - 100.0% - 100.0% - 38.3% - 3.7% ---- 68.3% - 40.5% -+ 3.9% -- 95.7% -- 33.2% -+ 53.6% ------ 100.0% - 63.2% - 100.0% - 73.2% -- 100.0% - 39.4% - 100.0% - 96.0% -- 78.8% --- 27.9% 0 4 2 16 0 3 2 82 0 1 0 5 2 0 14 3 4 0 11 0 7 1 1 0 8 1 1 14 1 8 2 4 9 0 9 0 5 2 1 11 0 1 0 7 0 0 3 53 0 1 0 6 2 0 6 0 3 0 10 2 1 1 0 0 1 0 0 9 1 8 3 0 5 1 3 0 1 4 0 8 -- 75.0% - 100.0% - 56.3% -- 100.0% + 50.0% - 35.4% -0.0% -+ 20.0% 0.0% -- 57.1% - 100.0% - 25.0% -- 9.1% -- 85.7% 0.0% - 100.0% -- 87.5% - 100.0% - 100.0% - 35.7% 0.0% 0.0% + 50.0% - 100.0% - 44.4% -- 66.7% -- 80.0% + 100.0% - 100.0% - 27.3% All data from MLS Property Information Network, Inc. Provided by Greater Boston Association of REALTORS®. Powered by 10K Research and Marketing.
- 3. Multi-Family Housing Activity Report – 2-Family Properties (cont.) December 2013 Closed Sales Median Sales Price Days on Market Inventory 12-2012 12-2013 +/– 12-2012 12-2013 +/– 12-2012 12-2013 +/– 12-2012 12-2013 +/– Norfolk North Attleboro Norwood Plainville Quincy Revere Saugus Sharon Sherborn Somerville Southborough Stow Sudbury Walpole Waltham Watertown Wayland Wellesley Weston Westwood Winchester Winthrop Woburn Wrentham 0 1 0 0 13 5 5 0 0 12 0 0 0 0 1 1 0 0 0 0 0 0 0 0 0 0 2 0 6 9 0 0 0 4 0 0 0 1 1 5 0 0 0 0 1 1 3 0 -- 100.0% --- 53.8% + 80.0% - 100.0% --- 66.7% ----0.0% + 400.0% --------- $0 $160,000 $0 $0 $360,000 $315,000 $240,000 $0 $0 $585,000 $0 $0 $0 $0 $395,000 $432,000 $0 $0 $0 $0 $0 $0 $0 $0 $0 $0 $387,500 $0 $438,650 $320,000 $0 $0 $0 $574,500 $0 $0 $0 $375,340 $522,000 $557,500 $0 $0 $0 $0 $672,000 $450,000 $349,900 $0 -- 100.0% --+ 21.8% + 1.6% - 100.0% --- 1.8% ----+ 32.2% + 29.1% --------- 0 270 0 0 68 44 96 0 0 45 0 0 0 0 24 5 0 0 0 0 0 0 0 0 0 0 20 0 53 44 0 0 0 41 0 0 0 63 7 19 0 0 0 0 19 16 75 0 -- 100.0% --- 22.0% + 0.5% - 100.0% --- 8.7% ----- 70.8% + 276.0% --------- 0 5 5 1 13 24 0 1 0 12 2 0 1 2 6 6 1 0 1 0 2 4 7 1 2 5 0 0 9 18 2 1 0 4 0 0 0 1 0 2 0 1 0 0 0 8 2 0 -0.0% - 100.0% - 100.0% - 30.8% - 25.0% -0.0% -- 66.7% - 100.0% -- 100.0% - 50.0% - 100.0% - 66.7% - 100.0% -- 100.0% -- 100.0% + 100.0% - 71.4% - 100.0% Greater Boston 139 137 -1.4% $382,500 $420,000 +9.8% 66 45 -32.5% 328 195 -40.5% Note: The "Greater Boston" figures are not a compilation or total of the individual areas. All data from MLS Property Information Network, Inc. Provided by Greater Boston Association of REALTORS®. Powered by 10K Research and Marketing.
- 4. Multi-Family Housing Activity Report – 3-Family Properties December 2013 Closed Sales Median Sales Price Days on Market Inventory 12-2012 Acton Arlington Ashland Attleboro Bedford Bellingham Belmont Boston Boxborough Brookline Burlington Cambridge Canton Carlisle Chelsea Concord Dedham Dover Everett Foxborough Framingham Franklin Holliston Hopkinton Hudson Lexington Lincoln Malden Mansfield Marlborough Maynard Medfield Medford Medway Milford Millis Milton Natick Needham Newton 12-2013 +/– 12-2012 12-2013 +/– 12-2012 12-2013 +/– 12-2012 12-2013 +/– 0 0 0 1 0 0 1 33 0 0 0 1 0 0 2 0 1 0 2 0 2 0 0 0 0 0 0 1 0 0 0 0 1 0 0 0 0 0 1 0 0 0 0 1 0 0 0 24 0 1 0 0 0 0 0 0 0 0 2 0 0 0 0 1 0 0 0 1 0 0 0 0 1 0 0 0 0 0 0 0 ---0.0% --- 100.0% - 27.3% ---- 100.0% --- 100.0% -- 100.0% -0.0% -- 100.0% ------0.0% ----0.0% ------ 100.0% -- $0 $0 $0 $122,000 $0 $0 $765,480 $439,000 $0 $0 $0 $834,000 $0 $0 $295,000 $0 $443,000 $0 $430,000 $0 $290,000 $0 $0 $0 $0 $0 $0 $425,000 $0 $0 $0 $0 $502,000 $0 $0 $0 $0 $0 $800,000 $0 $0 $0 $0 $275,000 $0 $0 $0 $436,500 $0 $1,185,000 $0 $0 $0 $0 $0 $0 $0 $0 $391,750 $0 $0 $0 $0 $440,000 $0 $0 $0 $505,000 $0 $0 $0 $0 $612,000 $0 $0 $0 $0 $0 $0 $0 ---+ 125.4% --- 100.0% - 0.6% ---- 100.0% --- 100.0% -- 100.0% -- 8.9% -- 100.0% ------+ 18.8% ----+ 21.9% ------ 100.0% -- 0 0 0 19 0 0 13 72 0 0 0 28 0 0 10 0 28 0 71 0 59 0 0 0 0 0 0 56 0 0 0 0 5 0 0 0 0 0 49 0 0 0 0 61 0 0 0 40 0 71 0 0 0 0 0 0 0 0 53 0 0 0 0 119 0 0 0 7 0 0 0 0 5 0 0 0 0 0 0 0 ---+ 221.1% --- 100.0% - 44.5% ---- 100.0% --- 100.0% -- 100.0% -- 26.1% -- 100.0% ------- 87.5% ----0.0% ------ 100.0% -- 0 0 5 6 0 0 0 70 0 1 0 2 0 0 5 0 0 0 11 0 5 0 1 0 3 0 0 2 0 3 1 0 2 0 3 0 0 0 0 0 0 0 0 3 0 0 0 53 0 0 0 3 1 0 2 0 0 0 4 0 2 0 0 0 0 1 0 0 2 3 0 0 2 0 1 0 0 0 0 0 --- 100.0% - 50.0% ---- 24.3% -- 100.0% -+ 50.0% --- 60.0% ---- 63.6% -- 60.0% -- 100.0% -- 100.0% --- 100.0% -0.0% - 100.0% -0.0% -- 66.7% ------ All data from MLS Property Information Network, Inc. Provided by Greater Boston Association of REALTORS®. Powered by 10K Research and Marketing.
- 5. Multi-Family Housing Activity Report – 3-Family Properties (cont.) December 2013 Closed Sales Median Sales Price Days on Market Inventory 12-2012 12-2013 +/– 12-2012 12-2013 +/– 12-2012 12-2013 +/– 12-2012 12-2013 +/– Norfolk North Attleboro Norwood Plainville Quincy Revere Saugus Sharon Sherborn Somerville Southborough Stow Sudbury Walpole Waltham Watertown Wayland Wellesley Weston Westwood Winchester Winthrop Woburn Wrentham 0 1 0 0 1 0 1 0 0 5 0 0 0 0 0 2 0 0 0 0 0 1 0 0 0 1 0 0 1 2 0 0 0 4 0 0 0 0 1 1 0 0 0 0 0 1 0 0 -0.0% --0.0% --100.0% ---20.0% ------50.0% -----0.0% --- $0 $330,000 $0 $0 $535,000 $0 $390,000 $0 $0 $475,000 $0 $0 $0 $0 $0 $652,500 $0 $0 $0 $0 $0 $310,000 $0 $0 $0 $340,000 $0 $0 $607,000 $429,000 $0 $0 $0 $942,500 $0 $0 $0 $0 $682,000 $650,000 $0 $0 $0 $0 $0 $519,000 $0 $0 -+3.0% --+13.5% --100.0% --+98.4% ------0.4% -----+67.4% --- 0 26 0 0 44 0 101 0 0 96 0 0 0 0 0 39 0 0 0 0 0 56 0 0 0 50 0 0 48 74 0 0 0 6 0 0 0 0 5 3 0 0 0 0 0 37 0 0 -+92.3% --+9.1% --100.0% ---93.5% ------92.2% ------33.9% --- 0 2 1 0 3 4 0 0 0 3 0 0 0 1 1 1 0 0 0 0 0 0 0 1 0 5 1 0 1 2 1 0 0 4 0 0 0 1 1 1 0 0 0 0 0 1 0 0 -+150.0% 0.0% --66.7% -50.0% ---+33.3% ---0.0% 0.0% 0.0% --------100.0% Greater Boston 57 42 -26.3% $436,500 $446,500 +2.3% 64 39 -38.7% 137 95 -30.7% Note: The "Greater Boston" figures are not a compilation or total of the individual areas. All data from MLS Property Information Network, Inc. Provided by Greater Boston Association of REALTORS®. Powered by 10K Research and Marketing.
- 6. Multi-Family Housing Activity Report – 4-Family Properties December 2013 Closed Sales Median Sales Price Days on Market Inventory 12-2012 Acton Arlington Ashland Attleboro Bedford Bellingham Belmont Boston Boxborough Brookline Burlington Cambridge Canton Carlisle Chelsea Concord Dedham Dover Everett Foxborough Framingham Franklin Holliston Hopkinton Hudson Lexington Lincoln Malden Mansfield Marlborough Maynard Medfield Medford Medway Milford Millis Milton Natick Needham Newton 12-2013 +/– 12-2012 12-2013 +/– 12-2012 12-2013 +/– 12-2012 12-2013 +/– 0 0 0 0 0 0 0 4 0 0 0 2 0 0 1 0 0 0 0 0 0 0 0 0 1 0 0 0 0 0 0 0 0 0 0 0 0 0 0 0 0 0 0 1 0 0 0 2 0 0 0 1 0 0 1 0 1 0 0 0 1 0 0 0 0 0 0 0 1 0 0 0 0 0 0 0 0 0 0 1 -------- 50.0% ---- 50.0% --0.0% ---------- 100.0% ---------------- $0 $0 $0 $0 $0 $0 $0 $1,550,000 $0 $0 $0 $900,000 $0 $0 $435,000 $0 $0 $0 $0 $0 $0 $0 $0 $0 $550,000 $0 $0 $0 $0 $0 $0 $0 $0 $0 $0 $0 $0 $0 $0 $0 $0 $0 $0 $170,000 $0 $0 $0 $967,500 $0 $0 $0 $1,600,000 $0 $0 $509,900 $0 $362,500 $0 $0 $0 $385,000 $0 $0 $0 $0 $0 $0 $0 $284,000 $0 $0 $0 $0 $0 $0 $0 $0 $0 $0 $629,000 -------- 37.6% ---+ 77.8% --+ 17.2% ---------- 100.0% ---------------- 0 0 0 0 0 0 0 28 0 0 0 11 0 0 8 0 0 0 0 0 0 0 0 0 65 0 0 0 0 0 0 0 0 0 0 0 0 0 0 0 0 0 0 42 0 0 0 16 0 0 0 17 0 0 25 0 27 0 0 0 66 0 0 0 0 0 0 0 195 0 0 0 0 0 0 0 0 0 0 56 -------- 45.1% ---+ 54.5% --+ 212.5% ---------- 100.0% ---------------- 1 0 0 2 0 0 0 7 0 1 0 2 0 0 0 0 0 0 1 0 1 0 3 0 0 0 0 0 0 3 0 1 0 0 1 0 0 0 0 2 0 0 0 2 0 0 0 8 0 0 0 0 0 0 0 0 0 0 0 0 0 1 0 0 0 0 0 1 0 1 0 0 0 0 0 0 0 0 0 0 - 100.0% --0.0% ---+ 14.3% -- 100.0% -- 100.0% ------- 100.0% -- 100.0% -- 100.0% ------- 66.7% -- 100.0% --- 100.0% ----- 100.0% All data from MLS Property Information Network, Inc. Provided by Greater Boston Association of REALTORS®. Powered by 10K Research and Marketing.
- 7. Multi-Family Housing Activity Report – 4-Family Properties (cont.) December 2013 Closed Sales Median Sales Price Days on Market Inventory 12-2012 12-2013 +/– 12-2012 12-2013 +/– 12-2012 12-2013 +/– 12-2012 12-2013 +/– Norfolk North Attleboro Norwood Plainville Quincy Revere Saugus Sharon Sherborn Somerville Southborough Stow Sudbury Walpole Waltham Watertown Wayland Wellesley Weston Westwood Winchester Winthrop Woburn Wrentham 0 1 0 0 1 1 0 0 0 2 0 0 0 0 0 0 0 0 0 0 0 0 0 0 0 0 1 0 1 0 0 0 0 1 0 0 0 0 0 0 0 0 0 0 0 0 0 0 --100.0% --0.0% -100.0% ----50.0% --------------- $0 $395,000 $0 $0 $575,000 $400,000 $0 $0 $0 $871,500 $0 $0 $0 $0 $0 $0 $0 $0 $0 $0 $0 $0 $0 $0 $0 $0 $589,000 $0 $700,000 $0 $0 $0 $0 $700,000 $0 $0 $0 $0 $0 $0 $0 $0 $0 $0 $0 $0 $0 $0 --100.0% --+21.7% -100.0% ----19.7% --------------- 0 15 0 0 1 6 0 0 0 103 0 0 0 0 0 0 0 0 0 0 0 0 0 0 0 0 3 0 36 0 0 0 0 70 0 0 0 0 0 0 0 0 0 0 0 0 0 0 --100.0% --+3500.0% -100.0% ----32.0% --------------- 0 1 0 1 2 2 0 0 0 1 0 0 0 0 0 0 0 0 0 0 0 0 0 0 0 2 1 0 1 1 0 0 0 0 0 0 0 0 3 0 0 0 0 0 0 0 0 0 -+100.0% --100.0% -50.0% -50.0% ----100.0% --------------- Greater Boston 13 12 -7.7% $740,000 $609,000 -17.7% 34 47 +41.1% 32 21 -34.4% Note: The "Greater Boston" figures are not a compilation or total of the individual areas. All data from MLS Property Information Network, Inc. Provided by Greater Boston Association of REALTORS®. Powered by 10K Research and Marketing.