SlideShare a Scribd company logo
1 of 14
Download to read offline
March 2016 Quick Facts
2
3
4
5
6
7
8
9
10
11
12
13
14
City of Boston Overview
Regional Map
Median Sales Price
Housing Affordability Index
Inventory of Homes for Sale
Months Supply of Inventory
Days on Market Until Sale
Percent of Original List Price Received
Monthly Indicators
Negative housing headlines should be read with calm or skepticism, not alarm.
National housing trends, like the steady rise in home prices and decline in
inventory, should certainly be observed with care, but tracking wider economic
conditions is also necessary. Buyers want to get into the market, but unlike the
rising-price sales environment of ten years ago, people are not diving headlong
into risky mortgages or uncomfortable situations. This carefulness should be
celebrated, not feared.
Closed Sales increased 12.5 percent for Single-Family homes and 30.0 percent for
Condominium homes. Pending Sales increased 35.9 percent for Single-Family
homes and 18.0 percent for Condominium homes. Inventory increased 14.8
percent for Single-Family homes and 5.6 percent for Condominium homes.
The Median Sales Price was up 0.6 percent to $472,000 for Single-Family homes
and 5.5 percent to $480,000 for Condominium homes. Days on Market decreased
13.0 percent for Single-Family homes and 9.1 percent for Condominium homes.
Months Supply of Inventory increased 4.8 percent for Single-Family homes but
remained flat for Condominium homes.
Employment figures are positive, wages are going up and employers are hiring.
Consumers are holding for the right deal, even in the face of extremely low
mortgage rates. As seller and builder confidence increases, we should see more
activity in Q2 2016. The second quarter tends to rank as the best time to list a
home for sale. But if inventory stays low, it will be difficult to sustain sales
increases in year-over-year comparisons. Prices are seemingly not so high as to
stall the market completely. Demand is present but an abundance of choice is not,
and therein lies the rub.
Data is refreshed regularly to capture changes in market activity so figures shown may be different than previously reported. Current as of April 18, 2016. All data from MLS Property Information
Network, Inc. Provided by the Greater Boston Association of REALTORS® and the Massachusetts Association of REALTORS®. Report © 2016 ShowingTime 10K.
Single-Family Home Market Overview
+ 20.5% + 12.5% + 30.0%
This is a research tool provided by the Greater Boston Association of
REALTORS®. Percent changes are calculated using rounded figures.
Condominium Market Overview
Year-Over-Year (YoY)
Change in Closed Sales
All Properties
Year-Over-Year (YoY)
Change in Closed Sales
Single-Family Only
Year-Over-Year (YoY)
Change in Closed Sales
Condominium Only
Closed Sales
Pending Sales
New Listings
Single-Family Home Market Overview
Historical Sparkbars 3-2015 3-2016
Percent
Change YTD 2015 YTD 2016
Percent
Change
+ 41.0%1,506 2,196 + 45.8% 2,998 4,228
Current as of April 18, 2016. All data from MLS Property Information Network, Inc. Provided by the Greater Boston Association of REALTORS® and the Massachusetts Association of REALTORS®. Report © 2016 ShowingTime 10K. | 2
+ 0.5%
Pending Sales 1,118 1,519 + 35.9% 2,467 3,134 + 27.0%
Pct. of Orig. List Price Received 96.5% 97.6% + 1.1% 95.9% 96.4%
New Listings
--
Days on Market Until Sale 92 80 - 13.0% 90 80 - 11.1%
Months Supply of Inventory 2.1 2.2 + 4.8% -- --
- 4.4%
Inventory of Homes for Sale 2,280 2,618 + 14.8% -- -- --
Housing Affordability Index 92 90 - 2.2% 90 86
2,208 + 13.9%
Median Sales Price $469,000 $472,000 + 0.6% $475,000 $490,000 + 3.2%
1,938
Key market metrics for the current month and year-to-date figures for Single-Family Homes Only.
Closed Sales 687 773 + 12.5%
Key Metrics
Mar 2014 Sep 2014 Mar 2015 Sep 2015 Mar 2016
Condominium Market Overview
Historical Sparkbars 3-2015 3-2016
Percent
Change YTD 2015 YTD 2016
Percent
Change
Key market metrics for the current month and year-to-date figures for Condominium Properties Only.
Closed Sales 577 750
Median Sales Price $455,000 $480,000
Inventory of Homes for Sale 1,399 1,478
Days on Market Until Sale 66 60
Housing Affordability Index 94
+ 30.0%
Key Metrics
1,827 + 20.6%1,515
88 - 6.4% 97 92 - 5.2%
+ 5.5% $443,500 $460,000 + 3.7%
--
-- --
+ 5.6% -- --
Months Supply of Inventory 1.6 1.6 0.0% --
- 9.1% 66
+ 26.2%
Pct. of Orig. List Price Received 98.7% 99.7% + 1.0% 98.3%
- 9.1%
98.7% + 0.4%
60
Current as of April 18, 2016. All data from MLS Property Information Network, Inc. Provided by the Greater Boston Association of REALTORS® and the Massachusetts Association of REALTORS®. Report © 2016 ShowingTime 10K. | 3
+ 27.1%Pending Sales 995 1,174 + 18.0% 2,109 2,680
New Listings 1,264 1,530 + 21.0% 2,601 3,282
Mar 2014 Sep 2014 Mar 2015 Sep 2015 Mar 2016
Closed Sales
Closed Sales Single-Family
Year-Over-Year
Change Condominium
Year-Over-Year
Change
Apr-2015 767 -6.0% 691 -23.8%
May-2015 1,063 -10.1% 956 -9.6%
Jun-2015 1,873 +11.1% 1,390 +5.8%
Jul-2015 1,908 +8.8% 1,374 +13.2%
Aug-2015 1,711 +11.5% 1,252 +7.7%
Sep-2015 1,221 +17.5% 943 +7.0%
Oct-2015 1,121 +8.3% 832 -4.7%
Nov-2015 1,011 +7.8% 773 +16.4%
Dec-2015 1,252 +11.3% 912 +8.1%
Jan-2016 845 +17.9% 607 +24.9%
Feb-2016 590 +10.5% 470 +4.0%
Mar-2016 773 +12.5% 750 +30.0%
12-Month Avg 1,178 +8.3% 913 +5.0%
Historical Closed Sales by Month
Current as of April 18, 2016. All data from MLS Property Information Network, Inc. Provided by the Greater Boston Association of REALTORS® and the Massachusetts Association of REALTORS®. Report © 2016 ShowingTime 10K. | 4
A count of the actual sales that closed in a given month.
666
704687
577
773 750
Single-Family Condominium
March
250
500
750
1,000
1,250
1,500
1,750
2,000
1-2003 1-2004 1-2005 1-2006 1-2007 1-2008 1-2009 1-2010 1-2011 1-2012 1-2013 1-2014 1-2015 1-2016
Single-Family Condominium
1,856
1,728
1,938
1,515
2,208
1,827
Single-Family Condominium
Year to Date
2014 2015 2016
+ 30.0%- 18.0%+ 12.5%+ 3.2% - 12.3%+ 13.9%+ 4.4% + 20.6%
2014 2015 2016 2014 2015 2016 2014 2015 2016
- 11.9% - 6.8% + 3.7%+ 5.5%
Median Sales Price
Median Sales Price Single-Family
Year-Over-Year
Change Condominium
Year-Over-Year
Change
Apr-2015 $510,000 +5.2% $436,000 +9.0%
May-2015 $520,000 +5.7% $462,000 +10.5%
Jun-2015 $560,000 +4.7% $460,000 +7.0%
Jul-2015 $550,000 +5.8% $460,000 +10.0%
Aug-2015 $529,500 +2.8% $455,000 +8.9%
Sep-2015 $492,000 +7.2% $425,900 +3.5%
Oct-2015 $475,000 +0.8% $455,000 +15.2%
Nov-2015 $518,000 +6.6% $450,000 +7.1%
Dec-2015 $500,501 +5.4% $445,000 +5.4%
Jan-2016 $490,000 +0.9% $442,000 -1.1%
Feb-2016 $518,750 +10.1% $449,500 +7.2%
Mar-2016 $472,000 +0.6% $480,000 +5.5%
12-Month Avg* $511,313 +4.3% $451,700 +7.4%
Historical Median Sales Price by Month
* Median Sales Price for all properties from April 2015 through March 2016. This is not the
average of the individual figures above.
Current as of April 18, 2016. All data from MLS Property Information Network, Inc. Provided by the Greater Boston Association of REALTORS® and the Massachusetts Association of REALTORS®. Report © 2016 ShowingTime 10K. | 5
Point at which half of the sales sold for more and half sold for less, not accounting for seller concessions, in a given month.
$465,000
$417,308
$469,000
$455,000
$472,000 $480,000
Single-Family Condominium
March
$200,000
$300,000
$400,000
$500,000
$600,000
1-2003 1-2004 1-2005 1-2006 1-2007 1-2008 1-2009 1-2010 1-2011 1-2012 1-2013 1-2014 1-2015 1-2016
Single-Family Condominium
$450,000
$407,000
$475,000
$443,500
$490,000
$460,000
Single-Family Condominium
Year to Date
2014 2015 2016
+ 5.5%+ 9.0%+ 0.6%+ 0.9% + 9.0%+ 3.2%+ 5.6% + 3.7%
2014 2015 2016 2014 2015 2016 2014 2015 2016
+ 14.8% + 11.1% + 11.5%+ 6.3%
Housing Affordability Index
Affordability Index Single-Family
Year-Over-Year
Change Condominium
Year-Over-Year
Change
Apr-2015 85 +4.9% 99 +1.0%
May-2015 84 +2.4% 94 -2.1%
Jun-2015 76 +1.3% 93 -1.1%
Jul-2015 76 -1.3% 91 -5.2%
Aug-2015 80 +2.6% 93 -4.1%
Sep-2015 87 0.0% 101 +4.1%
Oct-2015 90 +4.7% 94 -8.7%
Nov-2015 82 -2.4% 94 -3.1%
Dec-2015 85 -2.3% 96 -1.0%
Jan-2016 86 -3.4% 96 -1.0%
Feb-2016 82 -10.9% 94 -9.6%
Mar-2016 90 -2.2% 88 -6.4%
12-Month Avg 84 -0.2% 94 -3.6%
Historical Housing Affordability Index by Month
Current as of April 18, 2016. All data from MLS Property Information Network, Inc. Provided by the Greater Boston Association of REALTORS® and the Massachusetts Association of REALTORS®. Report © 2016 ShowingTime 10K. | 6
This index measures housing affordability for the region. An index of 120 means the median household income is 120% of what is necessary to
qualify for the median-priced home under prevailing interest rates. A higher number means greater affordability.
85
9492 94
90 88
Single-Family Condominium
March
40
60
80
100
120
140
1-2003 1-2004 1-2005 1-2006 1-2007 1-2008 1-2009 1-2010 1-2011 1-2012 1-2013 1-2014 1-2015 1-2016
Single-Family Condominium
88
97
90
97
86
92
Single-Family Condominium
Year to Date
2014 2015 2016
- 6.4%0.0%- 2.2%+ 8.2% 0.0%- 4.4%+ 2.3% - 5.2%
2014 2015 2016 2014 2015 2016 2014 2015 2016
- 17.5% - 14.6% - 14.9%- 11.3%
Inventory of Homes for Sale
Homes for Sale Single-Family
Year-Over-Year
Change Condominium
Year-Over-Year
Change
Apr-2015 3,020 -3.5% 1,760 -5.1%
May-2015 3,567 -3.0% 1,969 -2.7%
Jun-2015 3,729 -1.2% 1,961 -1.3%
Jul-2015 3,733 +0.9% 1,921 +0.4%
Aug-2015 3,612 +1.7% 1,834 +4.7%
Sep-2015 3,921 +1.4% 2,127 +10.6%
Oct-2015 3,765 +0.5% 2,066 +5.6%
Nov-2015 3,131 +1.8% 1,821 +11.3%
Dec-2015 2,349 -3.0% 1,387 +9.0%
Jan-2016 2,252 -1.5% 1,360 +4.8%
Feb-2016 2,211 +6.2% 1,326 +6.2%
Mar-2016 2,618 +14.8% 1,478 +5.6%
12-Month Avg 3,159 +0.8% 1,751 +3.7%
Historical Inventory of Homes for Sale by Month
Current as of April 18, 2016. All data from MLS Property Information Network, Inc. Provided by the Greater Boston Association of REALTORS® and the Massachusetts Association of REALTORS®. Report © 2016 ShowingTime 10K. | 7
The number of properties available for sale in active status at the end of a given month.
2,639
1,664
2,280
1,399
2,618
1,478
Single-Family Condominium
March
0
2,000
4,000
6,000
8,000
10,000
1-2003 1-2004 1-2005 1-2006 1-2007 1-2008 1-2009 1-2010 1-2011 1-2012 1-2013 1-2014 1-2015 1-2016
Single-Family Condominium
2014 2015 2016
+ 5.6%- 15.9%+ 14.8%- 13.6%
2014 2015 2016
- 5.9% - 13.2%
Months Supply of Inventory
Months Supply Single-Family
Year-Over-Year
Change Condominium
Year-Over-Year
Change
Apr-2015 2.8 0.0% 2.1 +5.0%
May-2015 3.3 0.0% 2.3 +4.5%
Jun-2015 3.4 0.0% 2.3 +9.5%
Jul-2015 3.4 +3.0% 2.2 +4.8%
Aug-2015 3.2 -3.0% 2.1 +5.0%
Sep-2015 3.5 -2.8% 2.4 +9.1%
Oct-2015 3.3 -5.7% 2.4 +9.1%
Nov-2015 2.7 -6.9% 2.1 +16.7%
Dec-2015 2.0 -9.1% 1.6 +14.3%
Jan-2016 1.9 -9.5% 1.5 0.0%
Feb-2016 1.9 0.0% 1.5 +7.1%
Mar-2016 2.2 +4.8% 1.6 0.0%
12-Month Avg* 2.8 -1.8% 2.0 +7.1%
Historical Months Supply of Inventory by Month
* Months Supply for all properties from April 2015 through March 2016. This is not the average of
the individual figures above.
Current as of April 18, 2016. All data from MLS Property Information Network, Inc. Provided by the Greater Boston Association of REALTORS® and the Massachusetts Association of REALTORS®. Report © 2016 ShowingTime 10K. | 8
The inventory of homes for sale at the end of a given month, divided by the average monthly closed sales from the last 12 months.
2.3
1.8
2.1
1.6
2.2
1.6
Single-Family Condominium
March
0.0
2.0
4.0
6.0
8.0
10.0
1-2003 1-2004 1-2005 1-2006 1-2007 1-2008 1-2009 1-2010 1-2011 1-2012 1-2013 1-2014 1-2015 1-2016
Single-Family Condominium
2014 2015 2016
0.0%- 11.1%+ 4.8%- 8.7%
2014 2015 2016
- 11.5% - 18.2%
Days on Market Until Sale
Days on Market Single-Family
Year-Over-Year
Change Condominium
Year-Over-Year
Change
Apr-2015 78 +9.9% 59 +1.7%
May-2015 58 +7.4% 45 -10.0%
Jun-2015 52 +4.0% 39 -13.3%
Jul-2015 49 -2.0% 40 -18.4%
Aug-2015 54 +5.9% 45 -10.0%
Sep-2015 57 -6.6% 50 -2.0%
Oct-2015 64 +4.9% 50 0.0%
Nov-2015 61 -7.6% 55 +3.8%
Dec-2015 70 +1.4% 52 -5.5%
Jan-2016 73 -13.1% 58 -1.7%
Feb-2016 91 -3.2% 64 -13.5%
Mar-2016 80 -13.0% 60 -9.1%
12-Month Avg* 66 -0.8% 51 -7.6%
Historical Days on Market Until Sale by Month
* Days on Market for all properties from April 2015 through March 2016. This is not the average of
the individual figures above.
Current as of April 18, 2016. All data from MLS Property Information Network, Inc. Provided by the Greater Boston Association of REALTORS® and the Massachusetts Association of REALTORS®. Report © 2016 ShowingTime 10K. | 9
Average number of days between when a property is listed and when an offer is accepted in a given month.
75
63
92
66
80
60
Single-Family Condominium
March
20
40
60
80
100
120
140
1-2003 1-2004 1-2005 1-2006 1-2007 1-2008 1-2009 1-2010 1-2011 1-2012 1-2013 1-2014 1-2015 1-2016
Single-Family Condominium
76
65
90
66
80
60
Single-Family Condominium
Year to Date
2014 2015 2016
- 9.1%+ 4.8%- 13.0%+ 22.7% + 1.5%- 11.1%+ 18.4% - 9.1%
2014 2015 2016 2014 2015 2016 2014 2015 2016
- 21.9% - 22.4% - 17.7%- 7.4%
Percent of Original List Price Received
Pct. of Orig. List
Price Received Single-Family
Year-Over-Year
Change Condominium
Year-Over-Year
Change
Apr-2015 97.4% -0.6% 100.6% +1.1%
May-2015 99.1% +0.4% 100.8% +0.1%
Jun-2015 99.7% +0.5% 101.6% +1.0%
Jul-2015 99.5% +0.9% 101.2% +1.3%
Aug-2015 98.5% +0.3% 100.6% +0.6%
Sep-2015 97.7% +0.8% 99.5% +0.5%
Oct-2015 96.7% 0.0% 99.7% +1.2%
Nov-2015 97.4% +0.8% 99.4% +1.3%
Dec-2015 96.1% +0.5% 98.4% +0.5%
Jan-2016 95.8% -0.1% 97.9% +0.1%
Feb-2016 95.7% +0.6% 98.1% -0.1%
Mar-2016 97.6% +1.1% 99.7% +1.0%
12-Month Avg* 97.6% +0.4% 99.8% +0.7%
Historical Percent of Original List Price Received by Month
* Pct. of Orig. List Price Received for all properties from April 2015 through March 2016. This is
not the average of the individual figures above.
Current as of April 18, 2016. All data from MLS Property Information Network, Inc. Provided by the Greater Boston Association of REALTORS® and the Massachusetts Association of REALTORS®. Report © 2016 ShowingTime 10K. | 10
Percentage found when dividing a property’s sales price by its original list price, then taking the average for all properties sold
in a given month, not accounting for seller concessions.
96.9% 98.6%96.5% 98.7%97.6% 99.7%
Single-Family Condominium
March
87.5%
90.0%
92.5%
95.0%
97.5%
100.0%
102.5%
1-2003 1-2004 1-2005 1-2006 1-2007 1-2008 1-2009 1-2010 1-2011 1-2012 1-2013 1-2014 1-2015 1-2016
Single-Family Condominium
96.3% 98.0%95.9% 98.3%96.4% 98.7%
Single-Family Condominium
Year to Date
2014 2015 2016
+ 1.0%+ 0.1%+ 1.1%- 0.4% + 0.3%+ 0.5%- 0.4% + 0.4%
2014 2015 2016 2014 2015 2016 2014 2015 2016
+ 1.9% + 1.9% + 1.3%+ 1.2%
Pending Sales
Pending Sales Single-Family
Year-Over-Year
Change Condominium
Year-Over-Year
Change
Apr-2015 1,554 +5.5% 1,276 +1.3%
May-2015 1,773 +10.1% 1,300 +11.2%
Jun-2015 1,793 +15.5% 1,383 +17.6%
Jul-2015 1,292 +9.1% 967 +2.1%
Aug-2015 1,127 +15.5% 821 +12.3%
Sep-2015 1,215 +17.2% 864 +0.3%
Oct-2015 1,264 +8.5% 958 +14.6%
Nov-2015 956 +6.2% 728 +10.5%
Dec-2015 666 +12.7% 522 +12.7%
Jan-2016 695 -2.1% 664 +21.2%
Feb-2016 920 +44.0% 842 +48.8%
Mar-2016 1,519 +35.9% 1,174 +18.0%
12-Month Avg 1,231 +14.0% 958 +12.6%
Historical Pending Sales by Month
A count of the properties in UAG status between the first and last day in a given month, regardless of current status (based on Off Market Date).
Current as of April 18, 2016. All data from MLS Property Information Network, Inc. Provided by the Greater Boston Association of REALTORS® and the Massachusetts Association of REALTORS®. Report © 2016 ShowingTime 10K. | 11
1,213
1,069
1,118
995
1,519
1,174
Single-Family Condominium
March
250
500
750
1,000
1,250
1,500
1,750
2,000
1-2003 1-2004 1-2005 1-2006 1-2007 1-2008 1-2009 1-2010 1-2011 1-2012 1-2013 1-2014 1-2015 1-2016
Single-Family Condominium
2,589
2,4872,467
2,109
3,134
2,680
Single-Family Condominium
Year to Date
2014 2015 2016
+ 18.0%- 6.9%+ 35.9%- 7.8% - 15.2%+ 27.0%- 4.7% + 27.1%
2014 2015 2016 2014 2015 2016 2014 2015 2016
- 12.4% - 13.0% - 6.9%- 12.6%
New Listings
New Listings Single-Family
Year-Over-Year
Change Condominium
Year-Over-Year
Change
Apr-2015 2,482 +13.2% 1,742 +9.2%
May-2015 2,548 +5.1% 1,662 +9.6%
Jun-2015 2,277 +13.3% 1,563 +15.3%
Jul-2015 1,634 +12.7% 1,119 +3.4%
Aug-2015 1,335 +11.5% 937 +17.9%
Sep-2015 1,957 +8.1% 1,440 +12.1%
Oct-2015 1,526 +3.0% 1,161 +4.0%
Nov-2015 884 +18.5% 766 +26.8%
Dec-2015 558 +10.5% 469 +17.0%
Jan-2016 905 +7.1% 810 +14.1%
Feb-2016 1,127 +74.2% 942 +50.2%
Mar-2016 2,196 +45.8% 1,530 +21.0%
12-Month Avg 1,619 +15.5% 1,178 +14.5%
Historical New Listings by Month
Current as of April 18, 2016. All data from MLS Property Information Network, Inc. Provided by the Greater Boston Association of REALTORS® and the Massachusetts Association of REALTORS®. Report © 2016 ShowingTime 10K. | 12
A count of the properties that have been newly listed on the market in a given month.
1,695
1,308
1,506
1,264
2,196
1,530
Single-Family Condominium
March
0
1,000
2,000
3,000
4,000
1-2003 1-2004 1-2005 1-2006 1-2007 1-2008 1-2009 1-2010 1-2011 1-2012 1-2013 1-2014 1-2015 1-2016
Single-Family Condominium
3,618
3,0832,998
2,601
4,228
3,282
Single-Family Condominium
Year to Date
2014 2015 2016
+ 21.0%- 3.4%+ 45.8%- 11.2% - 15.6%+ 41.0%- 17.1% + 26.2%
2014 2015 2016 2014 2015 2016 2014 2015 2016
+ 6.5% - 4.4% - 9.0%- 8.0%
City of Boston - Market Overview
Historical Sparkbars 3-2015 3-2016
Percent
Change YTD 2015 YTD 2016
Percent
Change
Key market metrics for the current month and year-to-date figures for the City of Boston.
Closed Sales 298 347 + 16.4%
Key Metrics
879 + 15.4%
Median Sales Price $487,000 $548,000 + 12.5% $489,000 $529,000 + 8.2%
762
Housing Affordability Index 97 85 - 12.4% 97 88 - 9.3%
----
Months Supply of Inventory 1.6 1.7 + 6.3% --
Inventory of Homes for Sale 684 774 + 13.2% --
64 58
-- --
+ 13.1% 1,068
- 9.4%
Pct. of Orig. List Price Received 97.6% 99.0% + 1.4% 97.0% 98.0% + 1.0%
Days on Market Until Sale 64 58 - 9.4%
Current as of April 18, 2016. All data from MLS Property Information Network, Inc. Provided by the Greater Boston Association of REALTORS® and the Massachusetts Association of REALTORS®. Report © 2016 ShowingTime 10K. | 13
+ 19.0%
1,601 + 22.5%
1,271
New Listings 620 761 + 22.7% 1,307
Pending Sales 482 545
Mar 2014 Sep 2014 Mar 2015 Sep 2015 Mar 2016
Regional Map
Central Middlesex Region Metro West Region
Acton Ashland
Bedford Dover
Boxboro Framingham
Concord Holliston
Hudson Hopkinton
Lexington Medfield
Lincoln Medway
Maynard Millis
Stow Natick
Sudbury Needham
Wayland Sherborn
Weston Wellesley
Eastern Middlesex Region Southern Norfolk Region
Burlington Avon
Malden Bellingham
Medford Canton
Melrose Foxboro
North Reading Franklin
Reading Mansfield
Stoneham Norfolk
Wakefield Norwood
Wilmington Randolph
Winchester Sharon
Woburn Stoughton
Walpole
Metro Boston Region Westwood
Arlington Wrentham
Belmont
Boston
Brookline
Cambridge
Chelsea
Dedham
Everett
Milton
Newton
Revere
Somerville
Waltham
Watertown
Winthrop
A map of the the 64 areas and 5 regions that make up "Greater Boston."
Greater Boston Association of REALTORS® Regional Map
Communities by Region
Current as of April 18, 2016. All data from MLS Property Information Network, Inc. Provided by the Greater Boston Association of REALTORS® and the Massachusetts Association of REALTORS®. Report © 2016 ShowingTime 10K. | 14

More Related Content

More from Unit Realty Group

January 2015′s Monthly Multi-family Housing Activity Report
January 2015′s Monthly Multi-family Housing Activity ReportJanuary 2015′s Monthly Multi-family Housing Activity Report
January 2015′s Monthly Multi-family Housing Activity Report
Unit Realty Group
 
November 2014 Multi-family Housing Activity Report – Boston, MA Real Estate
November 2014 Multi-family Housing Activity Report – Boston, MA Real EstateNovember 2014 Multi-family Housing Activity Report – Boston, MA Real Estate
November 2014 Multi-family Housing Activity Report – Boston, MA Real Estate
Unit Realty Group
 

More from Unit Realty Group (20)

September 2015 Greater Boston Real Estate Market Trends Report
September 2015 Greater Boston Real Estate Market Trends ReportSeptember 2015 Greater Boston Real Estate Market Trends Report
September 2015 Greater Boston Real Estate Market Trends Report
 
August 2015 Greater Boston Real Estate Market Trends Report
August 2015 Greater Boston Real Estate Market Trends ReportAugust 2015 Greater Boston Real Estate Market Trends Report
August 2015 Greater Boston Real Estate Market Trends Report
 
January 2015′s Monthly Multi-family Housing Activity Report
January 2015′s Monthly Multi-family Housing Activity ReportJanuary 2015′s Monthly Multi-family Housing Activity Report
January 2015′s Monthly Multi-family Housing Activity Report
 
January 2015 Greater Boston Real Estate Market Trends Report
January 2015 Greater Boston Real Estate Market Trends ReportJanuary 2015 Greater Boston Real Estate Market Trends Report
January 2015 Greater Boston Real Estate Market Trends Report
 
December 2014 Greater Boston Real Estate Market Trends Report
December 2014 Greater Boston Real Estate Market Trends ReportDecember 2014 Greater Boston Real Estate Market Trends Report
December 2014 Greater Boston Real Estate Market Trends Report
 
November 2014 Greater Boston Real Estate Market Trends Report
November 2014 Greater Boston Real Estate Market Trends ReportNovember 2014 Greater Boston Real Estate Market Trends Report
November 2014 Greater Boston Real Estate Market Trends Report
 
November 2014 Multi-family Housing Activity Report – Boston, MA Real Estate
November 2014 Multi-family Housing Activity Report – Boston, MA Real EstateNovember 2014 Multi-family Housing Activity Report – Boston, MA Real Estate
November 2014 Multi-family Housing Activity Report – Boston, MA Real Estate
 
September 2014 Multi-family Housing Activity Report – Boston, MA Real Estate
September 2014 Multi-family Housing Activity Report – Boston, MA Real EstateSeptember 2014 Multi-family Housing Activity Report – Boston, MA Real Estate
September 2014 Multi-family Housing Activity Report – Boston, MA Real Estate
 
Boston By The Numbers - Boston Housing Stock (Report)
Boston By The Numbers - Boston Housing Stock (Report)Boston By The Numbers - Boston Housing Stock (Report)
Boston By The Numbers - Boston Housing Stock (Report)
 
May 2014 Multi-family Housing Activity Report – Boston, MA Real Estate
May 2014 Multi-family Housing Activity Report – Boston, MA Real EstateMay 2014 Multi-family Housing Activity Report – Boston, MA Real Estate
May 2014 Multi-family Housing Activity Report – Boston, MA Real Estate
 
January 2014 Greater Boston Real Estate Market Trends Report
January 2014 Greater Boston Real Estate Market Trends ReportJanuary 2014 Greater Boston Real Estate Market Trends Report
January 2014 Greater Boston Real Estate Market Trends Report
 
September 2013 Multifamily Housing Activity Report – Boston, MA Real Estate
September 2013 Multifamily Housing Activity Report – Boston, MA Real EstateSeptember 2013 Multifamily Housing Activity Report – Boston, MA Real Estate
September 2013 Multifamily Housing Activity Report – Boston, MA Real Estate
 
August 2013 Multifamily Housing Activity Report – Boston, MA Real Estate
August 2013 Multifamily Housing Activity Report – Boston, MA Real EstateAugust 2013 Multifamily Housing Activity Report – Boston, MA Real Estate
August 2013 Multifamily Housing Activity Report – Boston, MA Real Estate
 
July 2013 Multifamily Housing Activity Report – Boston, MA Real Estate
July 2013 Multifamily Housing Activity Report – Boston, MA Real EstateJuly 2013 Multifamily Housing Activity Report – Boston, MA Real Estate
July 2013 Multifamily Housing Activity Report – Boston, MA Real Estate
 
July 2013's Monthly Indicators report - Boston Real Estate Market Trends
July 2013's Monthly Indicators report - Boston Real Estate Market TrendsJuly 2013's Monthly Indicators report - Boston Real Estate Market Trends
July 2013's Monthly Indicators report - Boston Real Estate Market Trends
 
June 2013 Multifamily Housing Activity Report – Boston, MA Real Estate
June 2013 Multifamily Housing Activity Report – Boston, MA Real EstateJune 2013 Multifamily Housing Activity Report – Boston, MA Real Estate
June 2013 Multifamily Housing Activity Report – Boston, MA Real Estate
 
June 2013's Monthly Indicators report - Boston Real Estate Market Trends
June 2013's Monthly Indicators report - Boston Real Estate Market TrendsJune 2013's Monthly Indicators report - Boston Real Estate Market Trends
June 2013's Monthly Indicators report - Boston Real Estate Market Trends
 
May 2013's Monthly Indicators report - Boston Real Estate Market Trends
May 2013's Monthly Indicators report - Boston Real Estate Market Trends May 2013's Monthly Indicators report - Boston Real Estate Market Trends
May 2013's Monthly Indicators report - Boston Real Estate Market Trends
 
April 2013 Monthly Multi-family Housing Activity Report – Boston Real Estate
April 2013 Monthly Multi-family Housing Activity Report – Boston Real Estate April 2013 Monthly Multi-family Housing Activity Report – Boston Real Estate
April 2013 Monthly Multi-family Housing Activity Report – Boston Real Estate
 
March 2013 Monthly Multi-family Housing Activity Report - Boston Real Estate
March 2013 Monthly Multi-family Housing Activity Report - Boston Real Estate March 2013 Monthly Multi-family Housing Activity Report - Boston Real Estate
March 2013 Monthly Multi-family Housing Activity Report - Boston Real Estate
 

Recently uploaded

9990771857 Call Girls in Dwarka Sector 07 Delhi (Call Girls) Delhi
9990771857 Call Girls in Dwarka Sector 07 Delhi (Call Girls) Delhi9990771857 Call Girls in Dwarka Sector 07 Delhi (Call Girls) Delhi
9990771857 Call Girls in Dwarka Sector 07 Delhi (Call Girls) Delhi
delhimodel235
 
Cheap Rate ✨➥9711108085▻✨Call Girls In Malviya Nagar(Delhi)
Cheap Rate ✨➥9711108085▻✨Call Girls In Malviya Nagar(Delhi)Cheap Rate ✨➥9711108085▻✨Call Girls In Malviya Nagar(Delhi)
Cheap Rate ✨➥9711108085▻✨Call Girls In Malviya Nagar(Delhi)
delhi24hrs1
 
Call Girls In Majnu Ka Tilla (Delhi) ꧁8447779280}@꧂ Escorts Service Delhi
Call Girls In Majnu Ka Tilla (Delhi) ꧁8447779280}@꧂ Escorts Service DelhiCall Girls In Majnu Ka Tilla (Delhi) ꧁8447779280}@꧂ Escorts Service Delhi
Call Girls In Majnu Ka Tilla (Delhi) ꧁8447779280}@꧂ Escorts Service Delhi
asmaqueen5
 
Cheap Rate ✨➥9711108085▻✨Call Girls In Chandni Chowk (Delhi)
Cheap Rate ✨➥9711108085▻✨Call Girls In Chandni Chowk (Delhi)Cheap Rate ✨➥9711108085▻✨Call Girls In Chandni Chowk (Delhi)
Cheap Rate ✨➥9711108085▻✨Call Girls In Chandni Chowk (Delhi)
delhi24hrs1
 
Low Rate Call girls in Sant Nagar{Delhi }8447779280} Service Escorts In South...
Low Rate Call girls in Sant Nagar{Delhi }8447779280} Service Escorts In South...Low Rate Call girls in Sant Nagar{Delhi }8447779280} Service Escorts In South...
Low Rate Call girls in Sant Nagar{Delhi }8447779280} Service Escorts In South...
asmaqueen5
 
Call Girls In Seelampur Delhi ↬8447779280}Seelampur Escorts Service In Delhi...
Call Girls In Seelampur  Delhi ↬8447779280}Seelampur Escorts Service In Delhi...Call Girls In Seelampur  Delhi ↬8447779280}Seelampur Escorts Service In Delhi...
Call Girls In Seelampur Delhi ↬8447779280}Seelampur Escorts Service In Delhi...
asmaqueen5
 
9990771857 Call Girls in Dwarka Sector 10 Delhi (Call Girls) Delhi
9990771857 Call Girls in Dwarka Sector 10 Delhi (Call Girls) Delhi9990771857 Call Girls in Dwarka Sector 10 Delhi (Call Girls) Delhi
9990771857 Call Girls in Dwarka Sector 10 Delhi (Call Girls) Delhi
delhimodel235
 
9990771857 Call Girls in Dwarka Sector 3 Delhi (Call Girls) Delhi
9990771857 Call Girls in Dwarka Sector 3 Delhi (Call Girls) Delhi9990771857 Call Girls in Dwarka Sector 3 Delhi (Call Girls) Delhi
9990771857 Call Girls in Dwarka Sector 3 Delhi (Call Girls) Delhi
delhimodel235
 
Bptp The Amaario Launch Luxury Project Sector 37D Gurgaon Dwarka Expressway...
Bptp The Amaario Launch  Luxury Project  Sector 37D Gurgaon Dwarka Expressway...Bptp The Amaario Launch  Luxury Project  Sector 37D Gurgaon Dwarka Expressway...
Bptp The Amaario Launch Luxury Project Sector 37D Gurgaon Dwarka Expressway...
ApartmentWala1
 
Goa Call Girls 8617370543 Call Girls In Goa By Russian Call Girl in goa
Goa Call Girls 8617370543 Call Girls In Goa By Russian Call Girl in goaGoa Call Girls 8617370543 Call Girls In Goa By Russian Call Girl in goa
Goa Call Girls 8617370543 Call Girls In Goa By Russian Call Girl in goa
Nitya salvi
 
9990771857 Call Girls in Dwarka Sector 1 Delhi (Call Girls) Delhi
9990771857 Call Girls in Dwarka Sector 1 Delhi (Call Girls) Delhi9990771857 Call Girls in Dwarka Sector 1 Delhi (Call Girls) Delhi
9990771857 Call Girls in Dwarka Sector 1 Delhi (Call Girls) Delhi
delhimodel235
 
9990771857 Call Girls Dwarka Sector 8 Delhi (Call Girls ) Delhi
9990771857 Call Girls  Dwarka Sector 8 Delhi (Call Girls ) Delhi9990771857 Call Girls  Dwarka Sector 8 Delhi (Call Girls ) Delhi
9990771857 Call Girls Dwarka Sector 8 Delhi (Call Girls ) Delhi
delhimodel235
 

Recently uploaded (20)

Kohinoor Hinjewadi Phase 2 Pune E-Brochure.pdf
Kohinoor Hinjewadi Phase 2 Pune  E-Brochure.pdfKohinoor Hinjewadi Phase 2 Pune  E-Brochure.pdf
Kohinoor Hinjewadi Phase 2 Pune E-Brochure.pdf
 
9990771857 Call Girls in Dwarka Sector 07 Delhi (Call Girls) Delhi
9990771857 Call Girls in Dwarka Sector 07 Delhi (Call Girls) Delhi9990771857 Call Girls in Dwarka Sector 07 Delhi (Call Girls) Delhi
9990771857 Call Girls in Dwarka Sector 07 Delhi (Call Girls) Delhi
 
Rohan Harita Tathawade Pune Brochure.pdf
Rohan Harita Tathawade Pune Brochure.pdfRohan Harita Tathawade Pune Brochure.pdf
Rohan Harita Tathawade Pune Brochure.pdf
 
Eldeco Dwarka Project In Delhi-brochure.pdf.pdf
Eldeco Dwarka Project In Delhi-brochure.pdf.pdfEldeco Dwarka Project In Delhi-brochure.pdf.pdf
Eldeco Dwarka Project In Delhi-brochure.pdf.pdf
 
Cheap Rate ✨➥9711108085▻✨Call Girls In Malviya Nagar(Delhi)
Cheap Rate ✨➥9711108085▻✨Call Girls In Malviya Nagar(Delhi)Cheap Rate ✨➥9711108085▻✨Call Girls In Malviya Nagar(Delhi)
Cheap Rate ✨➥9711108085▻✨Call Girls In Malviya Nagar(Delhi)
 
Call Girls In Majnu Ka Tilla (Delhi) ꧁8447779280}@꧂ Escorts Service Delhi
Call Girls In Majnu Ka Tilla (Delhi) ꧁8447779280}@꧂ Escorts Service DelhiCall Girls In Majnu Ka Tilla (Delhi) ꧁8447779280}@꧂ Escorts Service Delhi
Call Girls In Majnu Ka Tilla (Delhi) ꧁8447779280}@꧂ Escorts Service Delhi
 
Cheap Rate ✨➥9711108085▻✨Call Girls In Chandni Chowk (Delhi)
Cheap Rate ✨➥9711108085▻✨Call Girls In Chandni Chowk (Delhi)Cheap Rate ✨➥9711108085▻✨Call Girls In Chandni Chowk (Delhi)
Cheap Rate ✨➥9711108085▻✨Call Girls In Chandni Chowk (Delhi)
 
Low Rate Call girls in Sant Nagar{Delhi }8447779280} Service Escorts In South...
Low Rate Call girls in Sant Nagar{Delhi }8447779280} Service Escorts In South...Low Rate Call girls in Sant Nagar{Delhi }8447779280} Service Escorts In South...
Low Rate Call girls in Sant Nagar{Delhi }8447779280} Service Escorts In South...
 
Enjoy Night ≽ 8448380779 ≼ Call Girls In Huda City Centre (Gurgaon)
Enjoy Night ≽ 8448380779 ≼ Call Girls In Huda City Centre (Gurgaon)Enjoy Night ≽ 8448380779 ≼ Call Girls In Huda City Centre (Gurgaon)
Enjoy Night ≽ 8448380779 ≼ Call Girls In Huda City Centre (Gurgaon)
 
Enjoy Night ≽ 8448380779 ≼ Call Girls In Iffco Chowk (Gurgaon)
Enjoy Night ≽ 8448380779 ≼ Call Girls In Iffco Chowk (Gurgaon)Enjoy Night ≽ 8448380779 ≼ Call Girls In Iffco Chowk (Gurgaon)
Enjoy Night ≽ 8448380779 ≼ Call Girls In Iffco Chowk (Gurgaon)
 
Yedi Mavi TOBB Zeytinburnu - Listing Turkey
Yedi Mavi TOBB Zeytinburnu - Listing TurkeyYedi Mavi TOBB Zeytinburnu - Listing Turkey
Yedi Mavi TOBB Zeytinburnu - Listing Turkey
 
Kolte Patil Kharadi Pune E Brochure.pdf
Kolte Patil Kharadi Pune E  Brochure.pdfKolte Patil Kharadi Pune E  Brochure.pdf
Kolte Patil Kharadi Pune E Brochure.pdf
 
Call Girls In Seelampur Delhi ↬8447779280}Seelampur Escorts Service In Delhi...
Call Girls In Seelampur  Delhi ↬8447779280}Seelampur Escorts Service In Delhi...Call Girls In Seelampur  Delhi ↬8447779280}Seelampur Escorts Service In Delhi...
Call Girls In Seelampur Delhi ↬8447779280}Seelampur Escorts Service In Delhi...
 
9990771857 Call Girls in Dwarka Sector 10 Delhi (Call Girls) Delhi
9990771857 Call Girls in Dwarka Sector 10 Delhi (Call Girls) Delhi9990771857 Call Girls in Dwarka Sector 10 Delhi (Call Girls) Delhi
9990771857 Call Girls in Dwarka Sector 10 Delhi (Call Girls) Delhi
 
9990771857 Call Girls in Dwarka Sector 3 Delhi (Call Girls) Delhi
9990771857 Call Girls in Dwarka Sector 3 Delhi (Call Girls) Delhi9990771857 Call Girls in Dwarka Sector 3 Delhi (Call Girls) Delhi
9990771857 Call Girls in Dwarka Sector 3 Delhi (Call Girls) Delhi
 
Bptp The Amaario Launch Luxury Project Sector 37D Gurgaon Dwarka Expressway...
Bptp The Amaario Launch  Luxury Project  Sector 37D Gurgaon Dwarka Expressway...Bptp The Amaario Launch  Luxury Project  Sector 37D Gurgaon Dwarka Expressway...
Bptp The Amaario Launch Luxury Project Sector 37D Gurgaon Dwarka Expressway...
 
Goa Call Girls 8617370543 Call Girls In Goa By Russian Call Girl in goa
Goa Call Girls 8617370543 Call Girls In Goa By Russian Call Girl in goaGoa Call Girls 8617370543 Call Girls In Goa By Russian Call Girl in goa
Goa Call Girls 8617370543 Call Girls In Goa By Russian Call Girl in goa
 
9990771857 Call Girls in Dwarka Sector 1 Delhi (Call Girls) Delhi
9990771857 Call Girls in Dwarka Sector 1 Delhi (Call Girls) Delhi9990771857 Call Girls in Dwarka Sector 1 Delhi (Call Girls) Delhi
9990771857 Call Girls in Dwarka Sector 1 Delhi (Call Girls) Delhi
 
Real Estate Finance and Investments (2019).pdf
Real Estate Finance and Investments (2019).pdfReal Estate Finance and Investments (2019).pdf
Real Estate Finance and Investments (2019).pdf
 
9990771857 Call Girls Dwarka Sector 8 Delhi (Call Girls ) Delhi
9990771857 Call Girls  Dwarka Sector 8 Delhi (Call Girls ) Delhi9990771857 Call Girls  Dwarka Sector 8 Delhi (Call Girls ) Delhi
9990771857 Call Girls Dwarka Sector 8 Delhi (Call Girls ) Delhi
 

March 2016 Greater Boston Real Estate Market Trends Report

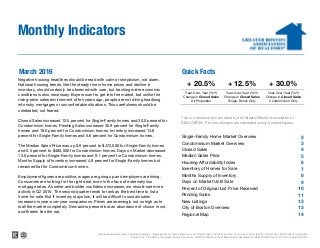
  • 1. March 2016 Quick Facts 2 3 4 5 6 7 8 9 10 11 12 13 14 City of Boston Overview Regional Map Median Sales Price Housing Affordability Index Inventory of Homes for Sale Months Supply of Inventory Days on Market Until Sale Percent of Original List Price Received Monthly Indicators Negative housing headlines should be read with calm or skepticism, not alarm. National housing trends, like the steady rise in home prices and decline in inventory, should certainly be observed with care, but tracking wider economic conditions is also necessary. Buyers want to get into the market, but unlike the rising-price sales environment of ten years ago, people are not diving headlong into risky mortgages or uncomfortable situations. This carefulness should be celebrated, not feared. Closed Sales increased 12.5 percent for Single-Family homes and 30.0 percent for Condominium homes. Pending Sales increased 35.9 percent for Single-Family homes and 18.0 percent for Condominium homes. Inventory increased 14.8 percent for Single-Family homes and 5.6 percent for Condominium homes. The Median Sales Price was up 0.6 percent to $472,000 for Single-Family homes and 5.5 percent to $480,000 for Condominium homes. Days on Market decreased 13.0 percent for Single-Family homes and 9.1 percent for Condominium homes. Months Supply of Inventory increased 4.8 percent for Single-Family homes but remained flat for Condominium homes. Employment figures are positive, wages are going up and employers are hiring. Consumers are holding for the right deal, even in the face of extremely low mortgage rates. As seller and builder confidence increases, we should see more activity in Q2 2016. The second quarter tends to rank as the best time to list a home for sale. But if inventory stays low, it will be difficult to sustain sales increases in year-over-year comparisons. Prices are seemingly not so high as to stall the market completely. Demand is present but an abundance of choice is not, and therein lies the rub. Data is refreshed regularly to capture changes in market activity so figures shown may be different than previously reported. Current as of April 18, 2016. All data from MLS Property Information Network, Inc. Provided by the Greater Boston Association of REALTORS® and the Massachusetts Association of REALTORS®. Report © 2016 ShowingTime 10K. Single-Family Home Market Overview + 20.5% + 12.5% + 30.0% This is a research tool provided by the Greater Boston Association of REALTORS®. Percent changes are calculated using rounded figures. Condominium Market Overview Year-Over-Year (YoY) Change in Closed Sales All Properties Year-Over-Year (YoY) Change in Closed Sales Single-Family Only Year-Over-Year (YoY) Change in Closed Sales Condominium Only Closed Sales Pending Sales New Listings
  • 2. Single-Family Home Market Overview Historical Sparkbars 3-2015 3-2016 Percent Change YTD 2015 YTD 2016 Percent Change + 41.0%1,506 2,196 + 45.8% 2,998 4,228 Current as of April 18, 2016. All data from MLS Property Information Network, Inc. Provided by the Greater Boston Association of REALTORS® and the Massachusetts Association of REALTORS®. Report © 2016 ShowingTime 10K. | 2 + 0.5% Pending Sales 1,118 1,519 + 35.9% 2,467 3,134 + 27.0% Pct. of Orig. List Price Received 96.5% 97.6% + 1.1% 95.9% 96.4% New Listings -- Days on Market Until Sale 92 80 - 13.0% 90 80 - 11.1% Months Supply of Inventory 2.1 2.2 + 4.8% -- -- - 4.4% Inventory of Homes for Sale 2,280 2,618 + 14.8% -- -- -- Housing Affordability Index 92 90 - 2.2% 90 86 2,208 + 13.9% Median Sales Price $469,000 $472,000 + 0.6% $475,000 $490,000 + 3.2% 1,938 Key market metrics for the current month and year-to-date figures for Single-Family Homes Only. Closed Sales 687 773 + 12.5% Key Metrics Mar 2014 Sep 2014 Mar 2015 Sep 2015 Mar 2016 Mar 2014 Sep 2014 Mar 2015 Sep 2015 Mar 2016 Mar 2014 Sep 2014 Mar 2015 Sep 2015 Mar 2016 Mar 2014 Sep 2014 Mar 2015 Sep 2015 Mar 2016 Mar 2014 Sep 2014 Mar 2015 Sep 2015 Mar 2016 Mar 2014 Sep 2014 Mar 2015 Sep 2015 Mar 2016 Mar 2014 Sep 2014 Mar 2015 Sep 2015 Mar 2016 Mar 2014 Sep 2014 Mar 2015 Sep 2015 Mar 2016 Mar 2014 Sep 2014 Mar 2015 Sep 2015 Mar 2016
  • 3. Condominium Market Overview Historical Sparkbars 3-2015 3-2016 Percent Change YTD 2015 YTD 2016 Percent Change Key market metrics for the current month and year-to-date figures for Condominium Properties Only. Closed Sales 577 750 Median Sales Price $455,000 $480,000 Inventory of Homes for Sale 1,399 1,478 Days on Market Until Sale 66 60 Housing Affordability Index 94 + 30.0% Key Metrics 1,827 + 20.6%1,515 88 - 6.4% 97 92 - 5.2% + 5.5% $443,500 $460,000 + 3.7% -- -- -- + 5.6% -- -- Months Supply of Inventory 1.6 1.6 0.0% -- - 9.1% 66 + 26.2% Pct. of Orig. List Price Received 98.7% 99.7% + 1.0% 98.3% - 9.1% 98.7% + 0.4% 60 Current as of April 18, 2016. All data from MLS Property Information Network, Inc. Provided by the Greater Boston Association of REALTORS® and the Massachusetts Association of REALTORS®. Report © 2016 ShowingTime 10K. | 3 + 27.1%Pending Sales 995 1,174 + 18.0% 2,109 2,680 New Listings 1,264 1,530 + 21.0% 2,601 3,282 Mar 2014 Sep 2014 Mar 2015 Sep 2015 Mar 2016 Mar 2014 Sep 2014 Mar 2015 Sep 2015 Mar 2016 Mar 2014 Sep 2014 Mar 2015 Sep 2015 Mar 2016 Mar 2014 Sep 2014 Mar 2015 Sep 2015 Mar 2016 Mar 2014 Sep 2014 Mar 2015 Sep 2015 Mar 2016 Mar 2014 Sep 2014 Mar 2015 Sep 2015 Mar 2016 Mar 2014 Sep 2014 Mar 2015 Sep 2015 Mar 2016 Mar 2014 Sep 2014 Mar 2015 Sep 2015 Mar 2016 Mar 2014 Sep 2014 Mar 2015 Sep 2015 Mar 2016
  • 4. Closed Sales Closed Sales Single-Family Year-Over-Year Change Condominium Year-Over-Year Change Apr-2015 767 -6.0% 691 -23.8% May-2015 1,063 -10.1% 956 -9.6% Jun-2015 1,873 +11.1% 1,390 +5.8% Jul-2015 1,908 +8.8% 1,374 +13.2% Aug-2015 1,711 +11.5% 1,252 +7.7% Sep-2015 1,221 +17.5% 943 +7.0% Oct-2015 1,121 +8.3% 832 -4.7% Nov-2015 1,011 +7.8% 773 +16.4% Dec-2015 1,252 +11.3% 912 +8.1% Jan-2016 845 +17.9% 607 +24.9% Feb-2016 590 +10.5% 470 +4.0% Mar-2016 773 +12.5% 750 +30.0% 12-Month Avg 1,178 +8.3% 913 +5.0% Historical Closed Sales by Month Current as of April 18, 2016. All data from MLS Property Information Network, Inc. Provided by the Greater Boston Association of REALTORS® and the Massachusetts Association of REALTORS®. Report © 2016 ShowingTime 10K. | 4 A count of the actual sales that closed in a given month. 666 704687 577 773 750 Single-Family Condominium March 250 500 750 1,000 1,250 1,500 1,750 2,000 1-2003 1-2004 1-2005 1-2006 1-2007 1-2008 1-2009 1-2010 1-2011 1-2012 1-2013 1-2014 1-2015 1-2016 Single-Family Condominium 1,856 1,728 1,938 1,515 2,208 1,827 Single-Family Condominium Year to Date 2014 2015 2016 + 30.0%- 18.0%+ 12.5%+ 3.2% - 12.3%+ 13.9%+ 4.4% + 20.6% 2014 2015 2016 2014 2015 2016 2014 2015 2016 - 11.9% - 6.8% + 3.7%+ 5.5%
  • 5. Median Sales Price Median Sales Price Single-Family Year-Over-Year Change Condominium Year-Over-Year Change Apr-2015 $510,000 +5.2% $436,000 +9.0% May-2015 $520,000 +5.7% $462,000 +10.5% Jun-2015 $560,000 +4.7% $460,000 +7.0% Jul-2015 $550,000 +5.8% $460,000 +10.0% Aug-2015 $529,500 +2.8% $455,000 +8.9% Sep-2015 $492,000 +7.2% $425,900 +3.5% Oct-2015 $475,000 +0.8% $455,000 +15.2% Nov-2015 $518,000 +6.6% $450,000 +7.1% Dec-2015 $500,501 +5.4% $445,000 +5.4% Jan-2016 $490,000 +0.9% $442,000 -1.1% Feb-2016 $518,750 +10.1% $449,500 +7.2% Mar-2016 $472,000 +0.6% $480,000 +5.5% 12-Month Avg* $511,313 +4.3% $451,700 +7.4% Historical Median Sales Price by Month * Median Sales Price for all properties from April 2015 through March 2016. This is not the average of the individual figures above. Current as of April 18, 2016. All data from MLS Property Information Network, Inc. Provided by the Greater Boston Association of REALTORS® and the Massachusetts Association of REALTORS®. Report © 2016 ShowingTime 10K. | 5 Point at which half of the sales sold for more and half sold for less, not accounting for seller concessions, in a given month. $465,000 $417,308 $469,000 $455,000 $472,000 $480,000 Single-Family Condominium March $200,000 $300,000 $400,000 $500,000 $600,000 1-2003 1-2004 1-2005 1-2006 1-2007 1-2008 1-2009 1-2010 1-2011 1-2012 1-2013 1-2014 1-2015 1-2016 Single-Family Condominium $450,000 $407,000 $475,000 $443,500 $490,000 $460,000 Single-Family Condominium Year to Date 2014 2015 2016 + 5.5%+ 9.0%+ 0.6%+ 0.9% + 9.0%+ 3.2%+ 5.6% + 3.7% 2014 2015 2016 2014 2015 2016 2014 2015 2016 + 14.8% + 11.1% + 11.5%+ 6.3%
  • 6. Housing Affordability Index Affordability Index Single-Family Year-Over-Year Change Condominium Year-Over-Year Change Apr-2015 85 +4.9% 99 +1.0% May-2015 84 +2.4% 94 -2.1% Jun-2015 76 +1.3% 93 -1.1% Jul-2015 76 -1.3% 91 -5.2% Aug-2015 80 +2.6% 93 -4.1% Sep-2015 87 0.0% 101 +4.1% Oct-2015 90 +4.7% 94 -8.7% Nov-2015 82 -2.4% 94 -3.1% Dec-2015 85 -2.3% 96 -1.0% Jan-2016 86 -3.4% 96 -1.0% Feb-2016 82 -10.9% 94 -9.6% Mar-2016 90 -2.2% 88 -6.4% 12-Month Avg 84 -0.2% 94 -3.6% Historical Housing Affordability Index by Month Current as of April 18, 2016. All data from MLS Property Information Network, Inc. Provided by the Greater Boston Association of REALTORS® and the Massachusetts Association of REALTORS®. Report © 2016 ShowingTime 10K. | 6 This index measures housing affordability for the region. An index of 120 means the median household income is 120% of what is necessary to qualify for the median-priced home under prevailing interest rates. A higher number means greater affordability. 85 9492 94 90 88 Single-Family Condominium March 40 60 80 100 120 140 1-2003 1-2004 1-2005 1-2006 1-2007 1-2008 1-2009 1-2010 1-2011 1-2012 1-2013 1-2014 1-2015 1-2016 Single-Family Condominium 88 97 90 97 86 92 Single-Family Condominium Year to Date 2014 2015 2016 - 6.4%0.0%- 2.2%+ 8.2% 0.0%- 4.4%+ 2.3% - 5.2% 2014 2015 2016 2014 2015 2016 2014 2015 2016 - 17.5% - 14.6% - 14.9%- 11.3%
  • 7. Inventory of Homes for Sale Homes for Sale Single-Family Year-Over-Year Change Condominium Year-Over-Year Change Apr-2015 3,020 -3.5% 1,760 -5.1% May-2015 3,567 -3.0% 1,969 -2.7% Jun-2015 3,729 -1.2% 1,961 -1.3% Jul-2015 3,733 +0.9% 1,921 +0.4% Aug-2015 3,612 +1.7% 1,834 +4.7% Sep-2015 3,921 +1.4% 2,127 +10.6% Oct-2015 3,765 +0.5% 2,066 +5.6% Nov-2015 3,131 +1.8% 1,821 +11.3% Dec-2015 2,349 -3.0% 1,387 +9.0% Jan-2016 2,252 -1.5% 1,360 +4.8% Feb-2016 2,211 +6.2% 1,326 +6.2% Mar-2016 2,618 +14.8% 1,478 +5.6% 12-Month Avg 3,159 +0.8% 1,751 +3.7% Historical Inventory of Homes for Sale by Month Current as of April 18, 2016. All data from MLS Property Information Network, Inc. Provided by the Greater Boston Association of REALTORS® and the Massachusetts Association of REALTORS®. Report © 2016 ShowingTime 10K. | 7 The number of properties available for sale in active status at the end of a given month. 2,639 1,664 2,280 1,399 2,618 1,478 Single-Family Condominium March 0 2,000 4,000 6,000 8,000 10,000 1-2003 1-2004 1-2005 1-2006 1-2007 1-2008 1-2009 1-2010 1-2011 1-2012 1-2013 1-2014 1-2015 1-2016 Single-Family Condominium 2014 2015 2016 + 5.6%- 15.9%+ 14.8%- 13.6% 2014 2015 2016 - 5.9% - 13.2%
  • 8. Months Supply of Inventory Months Supply Single-Family Year-Over-Year Change Condominium Year-Over-Year Change Apr-2015 2.8 0.0% 2.1 +5.0% May-2015 3.3 0.0% 2.3 +4.5% Jun-2015 3.4 0.0% 2.3 +9.5% Jul-2015 3.4 +3.0% 2.2 +4.8% Aug-2015 3.2 -3.0% 2.1 +5.0% Sep-2015 3.5 -2.8% 2.4 +9.1% Oct-2015 3.3 -5.7% 2.4 +9.1% Nov-2015 2.7 -6.9% 2.1 +16.7% Dec-2015 2.0 -9.1% 1.6 +14.3% Jan-2016 1.9 -9.5% 1.5 0.0% Feb-2016 1.9 0.0% 1.5 +7.1% Mar-2016 2.2 +4.8% 1.6 0.0% 12-Month Avg* 2.8 -1.8% 2.0 +7.1% Historical Months Supply of Inventory by Month * Months Supply for all properties from April 2015 through March 2016. This is not the average of the individual figures above. Current as of April 18, 2016. All data from MLS Property Information Network, Inc. Provided by the Greater Boston Association of REALTORS® and the Massachusetts Association of REALTORS®. Report © 2016 ShowingTime 10K. | 8 The inventory of homes for sale at the end of a given month, divided by the average monthly closed sales from the last 12 months. 2.3 1.8 2.1 1.6 2.2 1.6 Single-Family Condominium March 0.0 2.0 4.0 6.0 8.0 10.0 1-2003 1-2004 1-2005 1-2006 1-2007 1-2008 1-2009 1-2010 1-2011 1-2012 1-2013 1-2014 1-2015 1-2016 Single-Family Condominium 2014 2015 2016 0.0%- 11.1%+ 4.8%- 8.7% 2014 2015 2016 - 11.5% - 18.2%
  • 9. Days on Market Until Sale Days on Market Single-Family Year-Over-Year Change Condominium Year-Over-Year Change Apr-2015 78 +9.9% 59 +1.7% May-2015 58 +7.4% 45 -10.0% Jun-2015 52 +4.0% 39 -13.3% Jul-2015 49 -2.0% 40 -18.4% Aug-2015 54 +5.9% 45 -10.0% Sep-2015 57 -6.6% 50 -2.0% Oct-2015 64 +4.9% 50 0.0% Nov-2015 61 -7.6% 55 +3.8% Dec-2015 70 +1.4% 52 -5.5% Jan-2016 73 -13.1% 58 -1.7% Feb-2016 91 -3.2% 64 -13.5% Mar-2016 80 -13.0% 60 -9.1% 12-Month Avg* 66 -0.8% 51 -7.6% Historical Days on Market Until Sale by Month * Days on Market for all properties from April 2015 through March 2016. This is not the average of the individual figures above. Current as of April 18, 2016. All data from MLS Property Information Network, Inc. Provided by the Greater Boston Association of REALTORS® and the Massachusetts Association of REALTORS®. Report © 2016 ShowingTime 10K. | 9 Average number of days between when a property is listed and when an offer is accepted in a given month. 75 63 92 66 80 60 Single-Family Condominium March 20 40 60 80 100 120 140 1-2003 1-2004 1-2005 1-2006 1-2007 1-2008 1-2009 1-2010 1-2011 1-2012 1-2013 1-2014 1-2015 1-2016 Single-Family Condominium 76 65 90 66 80 60 Single-Family Condominium Year to Date 2014 2015 2016 - 9.1%+ 4.8%- 13.0%+ 22.7% + 1.5%- 11.1%+ 18.4% - 9.1% 2014 2015 2016 2014 2015 2016 2014 2015 2016 - 21.9% - 22.4% - 17.7%- 7.4%
  • 10. Percent of Original List Price Received Pct. of Orig. List Price Received Single-Family Year-Over-Year Change Condominium Year-Over-Year Change Apr-2015 97.4% -0.6% 100.6% +1.1% May-2015 99.1% +0.4% 100.8% +0.1% Jun-2015 99.7% +0.5% 101.6% +1.0% Jul-2015 99.5% +0.9% 101.2% +1.3% Aug-2015 98.5% +0.3% 100.6% +0.6% Sep-2015 97.7% +0.8% 99.5% +0.5% Oct-2015 96.7% 0.0% 99.7% +1.2% Nov-2015 97.4% +0.8% 99.4% +1.3% Dec-2015 96.1% +0.5% 98.4% +0.5% Jan-2016 95.8% -0.1% 97.9% +0.1% Feb-2016 95.7% +0.6% 98.1% -0.1% Mar-2016 97.6% +1.1% 99.7% +1.0% 12-Month Avg* 97.6% +0.4% 99.8% +0.7% Historical Percent of Original List Price Received by Month * Pct. of Orig. List Price Received for all properties from April 2015 through March 2016. This is not the average of the individual figures above. Current as of April 18, 2016. All data from MLS Property Information Network, Inc. Provided by the Greater Boston Association of REALTORS® and the Massachusetts Association of REALTORS®. Report © 2016 ShowingTime 10K. | 10 Percentage found when dividing a property’s sales price by its original list price, then taking the average for all properties sold in a given month, not accounting for seller concessions. 96.9% 98.6%96.5% 98.7%97.6% 99.7% Single-Family Condominium March 87.5% 90.0% 92.5% 95.0% 97.5% 100.0% 102.5% 1-2003 1-2004 1-2005 1-2006 1-2007 1-2008 1-2009 1-2010 1-2011 1-2012 1-2013 1-2014 1-2015 1-2016 Single-Family Condominium 96.3% 98.0%95.9% 98.3%96.4% 98.7% Single-Family Condominium Year to Date 2014 2015 2016 + 1.0%+ 0.1%+ 1.1%- 0.4% + 0.3%+ 0.5%- 0.4% + 0.4% 2014 2015 2016 2014 2015 2016 2014 2015 2016 + 1.9% + 1.9% + 1.3%+ 1.2%
  • 11. Pending Sales Pending Sales Single-Family Year-Over-Year Change Condominium Year-Over-Year Change Apr-2015 1,554 +5.5% 1,276 +1.3% May-2015 1,773 +10.1% 1,300 +11.2% Jun-2015 1,793 +15.5% 1,383 +17.6% Jul-2015 1,292 +9.1% 967 +2.1% Aug-2015 1,127 +15.5% 821 +12.3% Sep-2015 1,215 +17.2% 864 +0.3% Oct-2015 1,264 +8.5% 958 +14.6% Nov-2015 956 +6.2% 728 +10.5% Dec-2015 666 +12.7% 522 +12.7% Jan-2016 695 -2.1% 664 +21.2% Feb-2016 920 +44.0% 842 +48.8% Mar-2016 1,519 +35.9% 1,174 +18.0% 12-Month Avg 1,231 +14.0% 958 +12.6% Historical Pending Sales by Month A count of the properties in UAG status between the first and last day in a given month, regardless of current status (based on Off Market Date). Current as of April 18, 2016. All data from MLS Property Information Network, Inc. Provided by the Greater Boston Association of REALTORS® and the Massachusetts Association of REALTORS®. Report © 2016 ShowingTime 10K. | 11 1,213 1,069 1,118 995 1,519 1,174 Single-Family Condominium March 250 500 750 1,000 1,250 1,500 1,750 2,000 1-2003 1-2004 1-2005 1-2006 1-2007 1-2008 1-2009 1-2010 1-2011 1-2012 1-2013 1-2014 1-2015 1-2016 Single-Family Condominium 2,589 2,4872,467 2,109 3,134 2,680 Single-Family Condominium Year to Date 2014 2015 2016 + 18.0%- 6.9%+ 35.9%- 7.8% - 15.2%+ 27.0%- 4.7% + 27.1% 2014 2015 2016 2014 2015 2016 2014 2015 2016 - 12.4% - 13.0% - 6.9%- 12.6%
  • 12. New Listings New Listings Single-Family Year-Over-Year Change Condominium Year-Over-Year Change Apr-2015 2,482 +13.2% 1,742 +9.2% May-2015 2,548 +5.1% 1,662 +9.6% Jun-2015 2,277 +13.3% 1,563 +15.3% Jul-2015 1,634 +12.7% 1,119 +3.4% Aug-2015 1,335 +11.5% 937 +17.9% Sep-2015 1,957 +8.1% 1,440 +12.1% Oct-2015 1,526 +3.0% 1,161 +4.0% Nov-2015 884 +18.5% 766 +26.8% Dec-2015 558 +10.5% 469 +17.0% Jan-2016 905 +7.1% 810 +14.1% Feb-2016 1,127 +74.2% 942 +50.2% Mar-2016 2,196 +45.8% 1,530 +21.0% 12-Month Avg 1,619 +15.5% 1,178 +14.5% Historical New Listings by Month Current as of April 18, 2016. All data from MLS Property Information Network, Inc. Provided by the Greater Boston Association of REALTORS® and the Massachusetts Association of REALTORS®. Report © 2016 ShowingTime 10K. | 12 A count of the properties that have been newly listed on the market in a given month. 1,695 1,308 1,506 1,264 2,196 1,530 Single-Family Condominium March 0 1,000 2,000 3,000 4,000 1-2003 1-2004 1-2005 1-2006 1-2007 1-2008 1-2009 1-2010 1-2011 1-2012 1-2013 1-2014 1-2015 1-2016 Single-Family Condominium 3,618 3,0832,998 2,601 4,228 3,282 Single-Family Condominium Year to Date 2014 2015 2016 + 21.0%- 3.4%+ 45.8%- 11.2% - 15.6%+ 41.0%- 17.1% + 26.2% 2014 2015 2016 2014 2015 2016 2014 2015 2016 + 6.5% - 4.4% - 9.0%- 8.0%
  • 13. City of Boston - Market Overview Historical Sparkbars 3-2015 3-2016 Percent Change YTD 2015 YTD 2016 Percent Change Key market metrics for the current month and year-to-date figures for the City of Boston. Closed Sales 298 347 + 16.4% Key Metrics 879 + 15.4% Median Sales Price $487,000 $548,000 + 12.5% $489,000 $529,000 + 8.2% 762 Housing Affordability Index 97 85 - 12.4% 97 88 - 9.3% ---- Months Supply of Inventory 1.6 1.7 + 6.3% -- Inventory of Homes for Sale 684 774 + 13.2% -- 64 58 -- -- + 13.1% 1,068 - 9.4% Pct. of Orig. List Price Received 97.6% 99.0% + 1.4% 97.0% 98.0% + 1.0% Days on Market Until Sale 64 58 - 9.4% Current as of April 18, 2016. All data from MLS Property Information Network, Inc. Provided by the Greater Boston Association of REALTORS® and the Massachusetts Association of REALTORS®. Report © 2016 ShowingTime 10K. | 13 + 19.0% 1,601 + 22.5% 1,271 New Listings 620 761 + 22.7% 1,307 Pending Sales 482 545 Mar 2014 Sep 2014 Mar 2015 Sep 2015 Mar 2016 Mar 2014 Sep 2014 Mar 2015 Sep 2015 Mar 2016 Mar 2014 Sep 2014 Mar 2015 Sep 2015 Mar 2016 Mar 2014 Sep 2014 Mar 2015 Sep 2015 Mar 2016 Mar 2014 Sep 2014 Mar 2015 Sep 2015 Mar 2016 Mar 2014 Sep 2014 Mar 2015 Sep 2015 Mar 2016 Mar 2014 Sep 2014 Mar 2015 Sep 2015 Mar 2016 Mar 2014 Sep 2014 Mar 2015 Sep 2015 Mar 2016 Mar 2014 Sep 2014 Mar 2015 Sep 2015 Mar 2016
  • 14. Regional Map Central Middlesex Region Metro West Region Acton Ashland Bedford Dover Boxboro Framingham Concord Holliston Hudson Hopkinton Lexington Medfield Lincoln Medway Maynard Millis Stow Natick Sudbury Needham Wayland Sherborn Weston Wellesley Eastern Middlesex Region Southern Norfolk Region Burlington Avon Malden Bellingham Medford Canton Melrose Foxboro North Reading Franklin Reading Mansfield Stoneham Norfolk Wakefield Norwood Wilmington Randolph Winchester Sharon Woburn Stoughton Walpole Metro Boston Region Westwood Arlington Wrentham Belmont Boston Brookline Cambridge Chelsea Dedham Everett Milton Newton Revere Somerville Waltham Watertown Winthrop A map of the the 64 areas and 5 regions that make up "Greater Boston." Greater Boston Association of REALTORS® Regional Map Communities by Region Current as of April 18, 2016. All data from MLS Property Information Network, Inc. Provided by the Greater Boston Association of REALTORS® and the Massachusetts Association of REALTORS®. Report © 2016 ShowingTime 10K. | 14