April 2015 Multi Family Housing Activity Report – Boston, MA Real Estate
•
0 likes•310 views

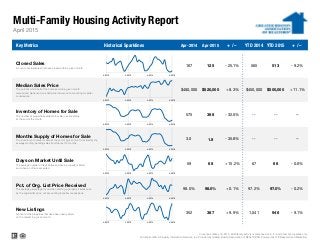
Here’s April 2015′s Monthly Multi-family Housing Activity Report from the Greater Boston Association of Realtors®. (Multi-family housing activity comparing April 2015 to April 2014) • Closed sales were DOWN -25.1% to 125 • Median prices were UP +8.3% ($520,000) • Inventory of homes for sale were DOWN -32.5% (388) • Months supply of home for sale were DOWN -35.8% (1.9) • Days on market until sale were UP +15.2% (68) • Percentage of original list price received were UP +0.1% (98.0%) • New Listings were UP +9.9% (387)

Recommended
Recommended
More Related Content
More from Unit Realty Group
More from Unit Realty Group (20)
Recently uploaded
Recently uploaded (20)
April 2015 Multi Family Housing Activity Report – Boston, MA Real Estate
- 1. Multi-Family Housing Activity Report Key Metrics Historical Sparklines Apr-2014 Apr-2015 + / – YTD 2014 YTD 2015 + / – 513 - 9.2% Median Sales Price The point at which half of the homes sold in a given month were priced higher and one half priced lower, not accounting for seller concessions. $480,000 565 April 2015 Closed Sales A count of actual sales that have closed within a given month. 167 125 - 25.1% -- $520,000 + 8.3% $450,000 $500,000 + 11.1% -- -- --- 35.8% Inventory of Homes for Sale The number of properties available for sale in active status at the end of the month. 575 388 - 32.5% -- Days on Market Until Sale The average number of days between when a property is listed and when an offer is accepted. 59 68 + 15.2% 67 66 97.0% Current as of May 16, 2015. Multi-family activity is comprised of 2-, 3- and 4-family properties only. All data from MLS Property Information Network, Inc. Provided by Greater Boston Association of REALTORS®. Powered by 10K Research and Marketing. -- - 0.2% New Listings A count of the properties that have been newly listed on the market in a given month. 352 387 + 9.9% 1,041 946 - 9.1% - 0.6% Months Supply of Homes for Sale The inventory of homes for sale at the end of a given month, divided by the average monthly pending sales from the last 12 months. 3.0 1.9 Pct. of Org. List Price Received The average percentage found when dividing a property's sales price by the original list price, not accounting for seller concessions. 98.0% 98.0% + 0.1% 97.2% 4-2012 4-2013 4-2014 4-2015 4-2012 4-2013 4-2014 4-2015 4-2012 4-2013 4-2014 4-2015 4-2012 4-2013 4-2014 4-2015 4-2012 4-2013 4-2014 4-2015 4-2012 4-2013 4-2014 4-2015 4-2012 4-2013 4-2014 4-2015
- 2. Multi-Family Housing Activity Report – 2-Family Properties 4-2014 4-2015 + / – 4-2014 4-2015 + / – 4-2014 4-2015 + / – 4-2014 4-2015 + / – Acton 0 0 -- $0 $0 -- 0 0 -- 1 0 - 100.0% Arlington 1 4 + 300.0% $630,000 $768,000 + 21.9% 4 9 + 125.0% 4 1 - 75.0% Ashland 0 0 -- $0 $0 -- 0 0 -- 1 2 + 100.0% Attleboro 6 0 - 100.0% $190,450 $0 - 100.0% 46 0 - 100.0% 16 11 - 31.3% Avon 0 0 -- $0 $0 -- 0 0 -- 1 0 - 100.0% Bedford 1 0 - 100.0% $344,500 $0 - 100.0% 38 0 - 100.0% 0 0 -- Bellingham 0 1 -- $0 $224,000 -- 0 149 -- 2 1 - 50.0% Belmont 5 0 - 100.0% $680,000 $0 - 100.0% 34 0 - 100.0% 2 1 - 50.0% Boston 25 25 0.0% $407,000 $445,000 + 9.3% 45 53 + 18.2% 79 51 - 35.4% Boxborough 0 0 -- $0 $0 -- 0 0 -- 0 0 -- Brookline 0 1 -- $0 $1,500,000 -- 0 8 -- 1 2 + 100.0% Burlington 0 0 -- $0 $0 -- 0 0 -- 0 1 -- Cambridge 1 0 - 100.0% $1,459,000 $0 - 100.0% 8 0 - 100.0% 10 5 - 50.0% Canton 1 1 0.0% $373,000 $445,000 + 19.3% 31 75 + 141.9% 2 3 + 50.0% Carlisle 0 0 -- $0 $0 -- 0 0 -- 0 0 -- Chelsea 2 3 + 50.0% $277,500 $340,000 + 22.5% 144 51 - 64.5% 7 6 - 14.3% Concord 0 1 -- $0 $505,000 -- 0 16 -- 0 0 -- Dedham 0 1 -- $0 $325,000 -- 0 119 -- 0 3 -- Dover 0 0 -- $0 $0 -- 0 0 -- 0 0 -- Everett 6 2 - 66.7% $320,000 $360,000 + 12.5% 60 41 - 31.9% 22 12 - 45.5% Foxborough 0 0 -- $0 $0 -- 0 0 -- 2 2 0.0% Framingham 1 1 0.0% $321,000 $281,000 - 12.5% 98 182 + 85.7% 9 0 - 100.0% Franklin 0 0 -- $0 $0 -- 0 0 -- 2 1 - 50.0% Holliston 0 0 -- $0 $0 -- 0 0 -- 0 1 -- Hopkinton 0 0 -- $0 $0 -- 0 0 -- 0 0 -- Hudson 1 0 - 100.0% $118,000 $0 - 100.0% 35 0 - 100.0% 5 1 - 80.0% Lexington 0 0 -- $0 $0 -- 0 0 -- 1 1 0.0% Lincoln 0 0 -- $0 $0 -- 0 0 -- 0 0 -- Malden 8 1 - 87.5% $465,000 $300,000 - 35.5% 27 52 + 96.2% 18 11 - 38.9% Mansfield 0 0 -- $0 $0 -- 0 0 -- 1 1 0.0% Marlborough 1 1 0.0% $240,000 $223,000 - 7.1% 244 126 - 48.4% 5 1 - 80.0% Maynard 2 0 - 100.0% $255,000 $0 - 100.0% 79 0 - 100.0% 3 2 - 33.3% Medfield 2 0 - 100.0% $478,250 $0 - 100.0% 548 0 - 100.0% 0 0 -- Medford 5 4 - 20.0% $590,000 $542,000 - 8.1% 24 114 + 365.2% 12 4 - 66.7% Medway 0 0 -- $0 $0 -- 0 0 -- 2 1 - 50.0% Milford 1 1 0.0% $270,000 $252,000 - 6.7% 47 188 + 300.0% 5 5 0.0% Millis 0 1 -- $0 $235,000 -- 0 184 -- 0 0 -- Milton 0 1 -- $0 $550,000 -- 0 322 -- 2 1 - 50.0% Natick 0 0 -- $0 $0 -- 0 0 -- 3 2 - 33.3% Needham 0 0 -- $0 $0 -- 0 0 -- 0 1 -- April 2015 InventoryClosed Sales Days on MarketMedian Sales Price All data from MLS Property Information Network, Inc. Provided by Greater Boston Association of REALTORS®. Powered by 10K Research and Marketing.
- 3. Multi-Family Housing Activity Report – 2-Family Properties (cont.) 4-2014 4-2015 + / – 4-2014 4-2015 + / – 4-2014 4-2015 + / – 4-2014 4-2015 + / – Newton 5 4 - 20.0% $650,000 $724,000 + 11.4% 29 58 + 96.9% 16 5 - 68.8% Norfolk 0 0 -- $0 $0 -- 0 0 -- 3 1 - 66.7% North Attleboro 1 0 - 100.0% $240,000 $0 - 100.0% 6 0 - 100.0% 9 2 - 77.8% Norwood 0 1 -- $0 $325,000 -- 0 25 -- 7 3 - 57.1% Plainville 0 0 -- $0 $0 -- 0 0 -- 1 2 + 100.0% Quincy 5 7 + 40.0% $541,000 $520,000 - 3.9% 67 92 + 38.6% 21 19 - 9.5% Randolph 1 0 - 100.0% $342,000 $0 - 100.0% 0 0 -- 6 3 - 50.0% Revere 6 7 + 16.7% $377,500 $450,000 + 19.2% 43 73 + 68.8% 32 13 - 59.4% Saugus 1 1 0.0% $358,900 $410,000 + 14.2% 10 245 + 2350.0% 1 1 0.0% Sharon 0 0 -- $0 $0 -- 0 0 -- 0 1 -- Sherborn 0 0 -- $0 $0 -- 0 0 -- 0 0 -- Somerville 5 2 - 60.0% $606,000 $630,000 + 4.0% 23 56 + 145.6% 17 14 - 17.6% Southborough 0 0 -- $0 $0 -- 0 0 -- 1 1 0.0% Stoughton 2 0 - 100.0% $309,000 $0 - 100.0% 22 0 - 100.0% 4 2 - 50.0% Stow 0 0 -- $0 $0 -- 0 0 -- 0 0 -- Sudbury 0 0 -- $0 $0 -- 0 0 -- 0 0 -- Walpole 0 0 -- $0 $0 -- 0 0 -- 3 2 - 33.3% Waltham 4 2 - 50.0% $542,500 $440,000 - 18.9% 23 7 - 72.0% 7 5 - 28.6% Watertown 4 3 - 25.0% $552,550 $580,000 + 5.0% 17 26 + 54.9% 7 4 - 42.9% Wayland 0 0 -- $0 $0 -- 0 0 -- 0 0 -- Wellesley 0 1 -- $0 $1,200,000 -- 0 7 -- 0 0 -- Weston 0 0 -- $0 $0 -- 0 0 -- 0 1 -- Westwood 0 0 -- $0 $0 -- 0 0 -- 0 0 -- Winchester 1 1 0.0% $639,000 $700,000 + 9.5% 1 82 + 8100.0% 2 0 - 100.0% Winthrop 1 4 + 300.0% $270,000 $441,000 + 63.3% 74 96 + 29.4% 7 6 - 14.3% Woburn 2 1 - 50.0% $392,500 $347,000 - 11.6% 64 105 + 65.4% 7 4 - 42.9% Wrentham 0 0 -- $0 $0 -- 0 0 -- 0 1 -- Greater Boston 107 83 -22.4% $440,000 $470,000 +6.8% 53 71 +35.3% 369 224 -39.3% Note: The "Greater Boston" figures are not a compilation or total of the individual areas. Days on Market Inventory April 2015 Closed Sales Median Sales Price All data from MLS Property Information Network, Inc. Provided by Greater Boston Association of REALTORS®. Powered by 10K Research and Marketing.
- 4. Multi-Family Housing Activity Report – 3-Family Properties 4-2014 4-2015 + / – 4-2014 4-2015 + / – 4-2014 4-2015 + / – 4-2014 4-2015 + / – Acton 0 0 -- $0 $0 -- 0 0 -- 0 0 -- Arlington 0 1 -- $0 $825,000 -- 0 9 -- 1 1 0.0% Ashland 0 0 -- $0 $0 -- 0 0 -- 0 0 -- Attleboro 3 0 - 100.0% $200,000 $0 - 100.0% 102 0 - 100.0% 5 7 + 40.0% Avon 0 0 -- $0 $0 -- 0 0 -- 0 0 -- Bedford 1 0 - 100.0% $355,000 $0 - 100.0% 35 0 - 100.0% 0 0 -- Bellingham 0 0 -- $0 $0 -- 0 0 -- 1 0 - 100.0% Belmont 1 0 - 100.0% $920,000 $0 - 100.0% 6 0 - 100.0% 0 0 -- Boston 24 20 - 16.7% $493,950 $670,000 + 35.6% 55 44 - 19.6% 81 63 - 22.2% Boxborough 0 0 -- $0 $0 -- 0 0 -- 0 0 -- Brookline 0 1 -- $0 $1,710,000 -- 0 42 -- 1 0 - 100.0% Burlington 0 0 -- $0 $0 -- 0 0 -- 0 0 -- Cambridge 4 1 - 75.0% $1,300,000 $2,880,000 + 121.5% 23 20 - 13.0% 3 4 + 33.3% Canton 0 0 -- $0 $0 -- 0 0 -- 1 2 + 100.0% Carlisle 0 0 -- $0 $0 -- 0 0 -- 0 0 -- Chelsea 2 0 - 100.0% $371,500 $0 - 100.0% 12 0 - 100.0% 9 6 - 33.3% Concord 0 0 -- $0 $0 -- 0 0 -- 0 0 -- Dedham 0 0 -- $0 $0 -- 0 0 -- 1 1 0.0% Dover 0 0 -- $0 $0 -- 0 0 -- 0 0 -- Everett 2 2 0.0% $489,000 $495,000 + 1.2% 58 66 + 13.8% 9 11 + 22.2% Foxborough 0 0 -- $0 $0 -- 0 0 -- 1 1 0.0% Framingham 0 1 -- $0 $420,000 -- 0 91 -- 2 0 - 100.0% Franklin 0 0 -- $0 $0 -- 0 0 -- 1 1 0.0% Holliston 0 0 -- $0 $0 -- 0 0 -- 0 0 -- Hopkinton 0 0 -- $0 $0 -- 0 0 -- 0 0 -- Hudson 0 0 -- $0 $0 -- 0 0 -- 1 3 + 200.0% Lexington 0 0 -- $0 $0 -- 0 0 -- 0 0 -- Lincoln 0 0 -- $0 $0 -- 0 0 -- 0 0 -- Malden 1 3 + 200.0% $598,888 $509,900 - 14.9% 7 169 + 2,314.3% 9 2 - 77.8% Mansfield 1 0 - 100.0% $251,250 $0 - 100.0% 362 0 - 100.0% 0 1 -- Marlborough 4 0 - 100.0% $310,000 $0 - 100.0% 196 0 - 100.0% 3 1 - 66.7% Maynard 0 0 -- $0 $0 -- 0 0 -- 0 0 -- Medfield 0 0 -- $0 $0 -- 0 0 -- 0 0 -- Medford 2 1 - 50.0% $611,000 $875,000 + 43.2% 19 21 + 10.5% 3 2 - 33.3% Medway 0 0 -- $0 $0 -- 0 0 -- 1 0 - 100.0% Milford 0 2 -- $0 $245,000 -- 0 32 -- 3 2 - 33.3% Millis 0 0 -- $0 $0 -- 0 0 -- 0 0 -- Milton 0 0 -- $0 $0 -- 0 0 -- 0 1 -- Natick 0 0 -- $0 $0 -- 0 0 -- 0 0 -- Needham 0 0 -- $0 $0 -- 0 0 -- 0 0 -- April 2015 Closed Sales Median Sales Price Days on Market Inventory All data from MLS Property Information Network, Inc. Provided by Greater Boston Association of REALTORS®. Powered by 10K Research and Marketing.
- 5. Multi-Family Housing Activity Report – 3-Family Properties (cont.) 4-2014 4-2015 + / – 4-2014 4-2015 + / – 4-2014 4-2015 + / – 4-2014 4-2015 + / – Newton 0 0 -- $0 $0 -- 0 0 -- 1 0 - 100.0% Norfolk 0 0 -- $0 $0 -- 0 0 -- 1 0 - 100.0% North Attleboro 1 0 - 100.0% $332,500 $0 - 100.0% 68 0 - 100.0% 13 3 - 76.9% Norwood 2 1 - 50.0% $486,750 $505,000 + 3.7% 23 299 + 1200.0% 0 0 -- Plainville 0 0 -- $0 $0 -- 0 0 -- 0 0 -- Quincy 0 0 -- $0 $0 -- 0 0 -- 3 4 + 33.3% Randolph 0 0 -- $0 $0 -- 0 0 -- 0 0 -- Revere 0 2 -- $0 $377,500 -- 0 55 -- 3 4 + 33.3% Saugus 0 0 -- $0 $0 -- 0 0 -- 0 0 -- Sharon 0 0 -- $0 $0 -- 0 0 -- 0 0 -- Sherborn 0 0 -- $0 $0 -- 0 0 -- 0 0 -- Somerville 0 3 -- $0 $950,000 -- 0 63 -- 7 6 - 14.3% Southborough 0 0 -- $0 $0 -- 0 0 -- 0 0 -- Stoughton 1 0 - 100.0% $395,000 $0 - 100.0% 13 0 - 100.0% 1 1 0.0% Stow 0 0 -- $0 $0 -- 0 0 -- 0 0 -- Sudbury 0 0 -- $0 $0 -- 0 0 -- 0 0 -- Walpole 0 0 -- $0 $0 -- 0 0 -- 0 1 -- Waltham 0 0 -- $0 $0 -- 0 0 -- 1 0 - 100.0% Watertown 0 1 -- $0 $675,000 -- 0 12 -- 1 0 - 100.0% Wayland 0 0 -- $0 $0 -- 0 0 -- 0 0 -- Wellesley 0 0 -- $0 $0 -- 0 0 -- 0 0 -- Weston 0 0 -- $0 $0 -- 0 0 -- 0 0 -- Westwood 0 0 -- $0 $0 -- 0 0 -- 1 0 - 100.0% Winchester 0 0 -- $0 $0 -- 0 0 -- 0 0 -- Winthrop 2 0 - 100.0% $500,000 $0 - 100.0% 130 0 - 100.0% 1 1 0.0% Woburn 0 0 -- $0 $0 -- 0 0 -- 0 0 -- Wrentham 0 0 -- $0 $0 -- 0 0 -- 0 0 -- Greater Boston 51 39 -23.5% $487,500 $620,000 +27.2% 68 61 -10.4% 169 129 -23.7% Note: The "Greater Boston" figures are not a compilation or total of the individual areas. Closed Sales Median Sales Price Days on Market Inventory April 2015 All data from MLS Property Information Network, Inc. Provided by Greater Boston Association of REALTORS®. Powered by 10K Research and Marketing.
- 6. Multi-Family Housing Activity Report – 4-Family Properties 4-2014 4-2015 + / – 4-2014 4-2015 + / – 4-2014 4-2015 + / – 4-2014 4-2015 + / – Acton 0 0 -- $0 $0 -- 0 0 -- 1 0 - 100.0% Arlington 0 0 -- $0 $0 -- 0 0 -- 0 0 -- Ashland 0 0 -- $0 $0 -- 0 0 -- 0 0 -- Attleboro 0 0 -- $0 $0 -- 0 0 -- 4 0 - 100.0% Avon 0 0 -- $0 $0 -- 0 0 -- 0 0 -- Bedford 0 0 -- $0 $0 -- 0 0 -- 0 0 -- Bellingham 0 0 -- $0 $0 -- 0 0 -- 0 0 -- Belmont 0 0 -- $0 $0 -- 0 0 -- 0 0 -- Boston 5 2 - 60.0% $1,600,000 $1,737,500 + 8.6% 86 46 - 47.3% 6 11 + 83.3% Boxborough 0 0 -- $0 $0 -- 0 0 -- 0 0 -- Brookline 0 0 -- $0 $0 -- 0 0 -- 1 1 0.0% Burlington 0 0 -- $0 $0 -- 0 0 -- 0 0 -- Cambridge 0 0 -- $0 $0 -- 0 0 -- 2 3 + 50.0% Canton 0 0 -- $0 $0 -- 0 0 -- 0 0 -- Carlisle 0 0 -- $0 $0 -- 0 0 -- 0 0 -- Chelsea 0 1 -- $0 $529,000 -- 0 85 -- 2 0 - 100.0% Concord 0 0 -- $0 $0 -- 0 0 -- 0 0 -- Dedham 0 0 -- $0 $0 -- 0 0 -- 0 0 -- Dover 0 0 -- $0 $0 -- 0 0 -- 0 0 -- Everett 0 0 -- $0 $0 -- 0 0 -- 1 0 - 100.0% Foxborough 0 0 -- $0 $0 -- 0 0 -- 0 0 -- Framingham 1 0 - 100.0% $410,000 $0 - 100.0% 6 0 - 100.0% 0 4 -- Franklin 0 0 -- $0 $0 -- 0 0 -- 1 0 - 100.0% Holliston 0 0 -- $0 $0 -- 0 0 -- 1 0 - 100.0% Hopkinton 0 0 -- $0 $0 -- 0 0 -- 0 0 -- Hudson 0 0 -- $0 $0 -- 0 0 -- 0 0 -- Lexington 0 0 -- $0 $0 -- 0 0 -- 0 0 -- Lincoln 0 0 -- $0 $0 -- 0 0 -- 0 0 -- Malden 0 0 -- $0 $0 -- 0 0 -- 1 1 0.0% Mansfield 0 0 -- $0 $0 -- 0 0 -- 0 0 -- Marlborough 0 0 -- $0 $0 -- 0 0 -- 1 0 - 100.0% Maynard 0 0 -- $0 $0 -- 0 0 -- 0 0 -- Medfield 0 0 -- $0 $0 -- 0 0 -- 1 0 - 100.0% Medford 0 0 -- $0 $0 -- 0 0 -- 2 2 0.0% Medway 0 0 -- $0 $0 -- 0 0 -- 0 0 -- Milford 0 0 -- $0 $0 -- 0 0 -- 1 0 - 100.0% Millis 0 0 -- $0 $0 -- 0 0 -- 0 0 -- Milton 0 0 -- $0 $0 -- 0 0 -- 0 0 -- Natick 0 0 -- $0 $0 -- 0 0 -- 0 0 -- Needham 0 0 -- $0 $0 -- 0 0 -- 0 0 -- April 2015 Closed Sales Median Sales Price Days on Market Inventory All data from MLS Property Information Network, Inc. Provided by Greater Boston Association of REALTORS®. Powered by 10K Research and Marketing.
- 7. Multi-Family Housing Activity Report – 4-Family Properties (cont.) 4-2014 4-2015 + / – 4-2014 4-2015 + / – 4-2014 4-2015 + / – 4-2014 4-2015 + / – Newton 1 0 - 100.0% $2,000,000 $0 - 100.0% 23 0 - 100.0% 0 0 -- Norfolk 0 0 -- $0 $0 -- 0 0 -- 0 0 -- North Attleboro 0 0 -- $0 $0 -- 0 0 -- 3 0 - 100.0% Norwood 0 0 -- $0 $0 -- 0 0 -- 1 1 0.0% Plainville 0 0 -- $0 $0 -- 0 0 -- 0 0 -- Quincy 1 0 - 100.0% $650,000 $0 - 100.0% 10 0 - 100.0% 2 2 0.0% Randolph 0 0 -- $0 $0 -- 0 0 -- 1 0 - 100.0% Revere 0 0 -- $0 $0 -- 0 0 -- 1 0 - 100.0% Saugus 0 0 -- $0 $0 -- 0 0 -- 0 0 -- Sharon 0 0 -- $0 $0 -- 0 0 -- 0 0 -- Sherborn 0 0 -- $0 $0 -- 0 0 -- 0 0 -- Somerville 0 0 -- $0 $0 -- 0 0 -- 1 4 + 300.0% Southborough 0 0 -- $0 $0 -- 0 0 -- 0 0 -- Stoughton 0 0 -- $0 $0 -- 0 0 -- 0 0 -- Stow 0 0 -- $0 $0 -- 0 0 -- 0 0 -- Sudbury 0 0 -- $0 $0 -- 0 0 -- 0 0 -- Walpole 0 0 -- $0 $0 -- 0 0 -- 0 0 -- Waltham 1 0 - 100.0% $625,000 $0 - 100.0% 39 0 - 100.0% 1 4 + 300.0% Watertown 0 0 -- $0 $0 -- 0 0 -- 1 0 - 100.0% Wayland 0 0 -- $0 $0 -- 0 0 -- 0 0 -- Wellesley 0 0 -- $0 $0 -- 0 0 -- 0 0 -- Weston 0 0 -- $0 $0 -- 0 0 -- 0 0 -- Westwood 0 0 -- $0 $0 -- 0 0 -- 0 0 -- Winchester 0 0 -- $0 $0 -- 0 0 -- 0 0 -- Winthrop 0 0 -- $0 $0 -- 0 0 -- 0 2 -- Woburn 0 0 -- $0 $0 -- 0 0 -- 1 0 - 100.0% Wrentham 0 0 -- $0 $0 -- 0 0 -- 0 0 -- Greater Boston 9 3 -66.7% $650,000 $975,000 +50.0% 57 59 +3.5% 37 35 -5.4% Note: The "Greater Boston" figures are not a compilation or total of the individual areas. Closed Sales Median Sales Price Days on Market Inventory April 2015 All data from MLS Property Information Network, Inc. Provided by Greater Boston Association of REALTORS®. Powered by 10K Research and Marketing.