SlideShare a Scribd company logo
1 of 13
Download to read offline
Monthly IndicatorsA RESEARCH TOOL PROVIDED BY THE GREATER BOSTON ASSOCIATION OF REALTORS®
April 2014 Quick Facts
2
3
4
5
6
7
8
9
10
11
12
13
Housing Affordability Index
Inventory of Homes for Sale
Click on desired metric to jump to that page.
Months Supply of Inventory
Days On Market Until Sale
Percent of Original List Price Received
City of Boston Overview
Pending Sales
New Listings
Data is refreshed regularly to capture changes in market activity so figures shown may be different than previously reported. Current as of May 16, 2014. All data from MLS Property
Information Network, Inc. Provided by Greater Boston Association of REALTORS® and the Massachusetts Association of REALTORS®. Powered by 10K Research and Marketing.
- 12.4%
Year-Over-Year
(YoY) Change in
Closed Sales
Single-Family Only
The public has finally grown used to talk of a real estate market in recovery.
With prices going up, people are starting to wonder if a new bubble is forming.
Most metropolitan markets are somewhere between recovery and
normalization. Supply is still tight but improving in some areas. What housing
really needs is further job and wage growth to support healthy demand levels
fueled by new household formations.
New Listings in the Greater Boston region were down 5.7 percent for detached
homes and 10.8 percent for condominiums. Closed Sales decreased 12.4
percent for detached homes but increased 0.1 percent for condominiums.
The Median Sales Price was up 9.4 percent to $525,000 for single-family
properties and 8.4 percent to $419,950 for condominiums. Months Supply of
Inventory remained flat for single-family units but was down 26.7 percent for
condo units.
April's job growth was above expectations. Growth is likely to accelerate
through the year, but the types of jobs being created is also important. We're
producing more low-wage jobs as opposed to high-wage jobs. That's not
conducive to increasing the number of potential buyers. It also means less
disposable income sloshing around. Even so, some local markets may pause
but are unlikely to falter thanks to suppressed supply levels and an improving
sales mix. Don't confuse temporarily weak demand indicators for stagnation.
+ 0.1%
Year-Over-Year
(YoY) Change in
Closed Sales
Condominium Only
- 6.0%
Year-Over-Year
(YoY) Change in
Closed Sales
All Properties
Single-Family Market Overview
Condominium Market Overview
Closed Sales
Median Sales Price
Single-Family Market Overview
Key market metrics for the current month and year-to-date figures for Single-Family Homes Only.
Key Metrics Historical Sparklines Apr-2013 Apr-2014 + / – YTD 2013 YTD 2014 + / –
2,195 - 8.7%
All data from MLS Property Information Network, Inc. Provided by the Greater Boston Association of REALTORS® and the Massachusetts Association of REALTORS®. Powered by 10K Research and Marketing. | Click for Cover Page | 2
New Listings 1,995 1,882 - 5.7% 5,191 5,002 - 3.6%
Closed Sales 767 672 - 12.4% 2,405
$499,900 + 13.6%
93
100 82
82
-- -- --
2,771 2,429
3.6 + 0.0%
$525,000 + 9.4% $440,000
104
Housing Affordability Index
Inventory of Homes for Sale
Months Supply of Inventory 3.6
$480,000
Pending Sales
Median Sales Price
- 7.7%3,5711,380 1,313 - 4.9% 3,868
- 12.3% -- --
- 18.4% 109 86 - 21.4%
--
95.2% 96.8%
- 20.6%
+ 1.8%
Percent of Original
List Price Received
Days on Market Until Sale
96.7%
- 12.7%
+ 1.4%
81
98.1%
4-2011 4-2012 4-2013 4-2014
4-2011 4-2012 4-2013 4-2014
4-2011 4-2012 4-2013 4-2014
4-2011 4-2012 4-2013 4-2014
4-2011 4-2012 4-2013 4-2014
4-2011 4-2012 4-2013 4-2014
4-2011 4-2012 4-2013 4-2014
4-2011 4-2012 4-2013 4-2014
4-2011 4-2012 4-2013 4-2014
Condominium Market Overview
Key market metrics for the current month and year-to-date figures for Condominium Properties Only.
Key Metrics Historical Sparklines Apr-2013 Apr-2014 + / – YTD 2013 YTD 2014 + / –
- 11.2%
All data from MLS Property Information Network, Inc. Provided by the Greater Boston Association of REALTORS® and the Massachusetts Association of REALTORS®. Powered by 10K Research and Marketing. | Click for Cover Page | 3
New Listings 1,661 1,482 - 10.8% 4,856 4,313
+ 1.3%
Pending Sales 1,269 1,207 - 4.9% 3,799 3,543 - 6.7%
Percent of Original
List Price Received
98.8% 99.7% + 0.9% 97.4% 98.7%
--
Days on Market Until Sale 63 56 - 11.8% 77 64 - 16.7%
Months Supply of Inventory 2.5 1.8 - 26.7% -- --
- 19.2%
Inventory of Homes for Sale 1,979 1,452 - 26.6% -- -- --
Housing Affordability Index 124 102 - 17.6% 127 102
+ 0.6%
Median Sales Price $387,500 $419,950 + 8.4% $380,000 $420,000 + 10.5%
Closed Sales 805 806 + 0.1% 2,382 2,397
4-2011 4-2012 4-2013 4-2014
4-2011 4-2012 4-2013 4-2014
4-2011 4-2012 4-2013 4-2014
4-2011 4-2012 4-2013 4-2014
4-2011 4-2012 4-2013 4-2014
4-2011 4-2012 4-2013 4-2014
4-2011 4-2012 4-2013 4-2014
4-2011 4-2012 4-2013 4-2014
4-2011 4-2012 4-2013 4-2014
Closed Sales
A count of the actual sales that have closed in a given month.
Single-Family
YoY
Change
Condominium
YoY
Change
May-2013 1,096 + 10.0% 1,068 + 6.3%
Jun-2013 1,481 - 1.1% 1,246 - 1.0%
Jul-2013 1,488 + 18.0% 1,252 + 20.7%
Aug-2013 1,429 + 11.6% 1,277 + 6.2%
Sep-2013 919 + 22.4% 887 + 18.7%
Oct-2013 855 + 10.5% 764 + 7.5%
Nov-2013 791 - 11.4% 711 - 5.8%
Dec-2013 900 + 10.6% 789 + 3.0%
Jan-2014 569 - 4.7% 526 + 2.3%
Feb-2014 408 - 4.0% 421 - 3.2%
Mar-2014 546 - 11.4% 644 + 2.5%
Apr-2014 672 - 12.4% 806 + 0.1%
Total 11,154 + 4.5% 10,391 + 5.3%
All data from MLS Property Information Network, Inc. Provided by the Greater Boston Association of REALTORS® and the Massachusetts Association of REALTORS®. Powered by 10K Research and Marketing. | Click for Cover Page | 4
735 756767
805
672
806
Single-Family Condominium
April
200
400
600
800
1,000
1,200
1,400
1,600
1,800
Jan-2003 Jan-2004 Jan-2005 Jan-2006 Jan-2007 Jan-2008 Jan-2009 Jan-2010 Jan-2011 Jan-2012 Jan-2013 Jan-2014
Historical Closed Sales Activity Single-Family Condominium
+0.1%+6.5%+4.4%
20142013 20142013
2,355
2,156
2,405 2,382
2,195
2,397
Single-Family Condominium
Year to Date
+0.6%+10.5%+2.1%
20142013 20142013
-12.4% -8.7%
2012 2012 2012 2012
Median Sales Price
Median price point for all closed sales, not accounting for seller concessions, in a given month.
Single-Family
YoY
Change
Condominium
YoY
Change
May-2013 $500,000 + 7.2% $410,000 + 7.6%
Jun-2013 $545,000 + 8.1% $420,000 + 5.0%
Jul-2013 $533,000 + 4.1% $400,500 + 3.5%
Aug-2013 $520,000 + 5.3% $416,000 + 9.5%
Sep-2013 $502,500 + 15.5% $410,000 + 9.3%
Oct-2013 $474,000 + 9.0% $416,750 + 13.8%
Nov-2013 $480,000 + 6.7% $410,500 + 8.0%
Dec-2013 $500,000 + 6.4% $420,800 + 10.6%
Jan-2014 $486,575 + 13.2% $420,500 + 13.9%
Feb-2014 $476,950 + 10.9% $400,000 + 14.3%
Mar-2014 $499,950 + 16.2% $436,500 + 7.8%
Apr-2014 $525,000 + 9.4% $419,950 + 8.4%
Median $510,000 + 8.5% $415,000 + 8.4%
All data from MLS Property Information Network, Inc. Provided by the Greater Boston Association of REALTORS® and the Massachusetts Association of REALTORS®. Powered by 10K Research and Marketing. | Click for Cover Page | 5
$420,000
$371,500
$480,000
$387,500
$525,000
$419,950
Single-Family Condominium
April
$250,000
$300,000
$350,000
$400,000
$450,000
$500,000
$550,000
Jan-2003 Jan-2004 Jan-2005 Jan-2006 Jan-2007 Jan-2008 Jan-2009 Jan-2010 Jan-2011 Jan-2012 Jan-2013 Jan-2014
Historical Median Sales Price Single-Family Condominium
+8.4%+4.3%+14.3%
20142013 20142013
$411,000
$359,900
$440,000
$380,000
$499,900
$420,000
Single-Family Condominium
Year to Date
+10.5%+5.6%+7.1%
20142013 20142013
+9.4% +13.6%
2012 2012 2012 2012
Housing Affordability Index
Single-Family
YoY
Change
Condominium
YoY
Change
May-2013 93 - 5.3% 113 - 5.6%
Jun-2013 81 - 11.7% 105 - 9.1%
Jul-2013 83 - 8.8% 110 - 8.3%
Aug-2013 84 - 10.6% 105 - 14.0%
Sep-2013 88 - 18.8% 108 - 14.2%
Oct-2013 94 - 13.4% 106 - 17.0%
Nov-2013 98 - 6.9% 114 - 8.1%
Dec-2013 90 - 11.6% 106 - 14.9%
Jan-2014 87 - 22.6% 101 - 23.1%
Feb-2014 90 - 18.1% 108 - 20.5%
Mar-2014 86 - 21.5% 99 - 15.3%
Apr-2014 82 - 18.4% 102 - 17.6%
Average 88 -14.0% 107 -14.0%
This index measures housing affordability for the region. An index of 120 means the median household income was 120% of what is necessary
to qualify for the median-priced home under prevailing interest rates. A higher number means greater affordability.
All data from MLS Property Information Network, Inc. Provided by the Greater Boston Association of REALTORS® and the Massachusetts Association of REALTORS®. Powered by 10K Research and Marketing. | Click for Cover Page | 6
108
122
100
124
82
102
Single-Family Condominium
April
60
70
80
90
100
110
120
130
140
Jan-2004 Jan-2005 Jan-2006 Jan-2007 Jan-2008 Jan-2009 Jan-2010 Jan-2011 Jan-2012 Jan-2013 Jan-2014
Historical Housing Affordability Index Single-Family Condominium
-17.6%+2.0%-6.9%
110
126
109
127
86
102
Single-Family Condominium
Year to Date
-19.2%+0.8%-0.6%
20142013 20142013 20142013 20142013
-18.4% -21.4%
2012 2012 2012 2012
Inventory of Homes for Sale
The number of properties available for sale in active status at the end of a given month.
Single-Family
YoY
Change
Condominium
YoY
Change
May-2013 3,042 - 30.6% 2,078 - 34.8%
Jun-2013 3,035 - 26.6% 2,035 - 31.5%
Jul-2013 2,868 - 24.9% 1,872 - 31.7%
Aug-2013 2,760 - 23.4% 1,756 - 27.6%
Sep-2013 3,003 - 20.2% 1,975 - 21.9%
Oct-2013 2,889 - 16.9% 1,906 - 18.0%
Nov-2013 2,436 - 18.4% 1,599 - 20.3%
Dec-2013 1,871 - 18.5% 1,277 - 16.3%
Jan-2014 1,843 - 19.7% 1,261 - 20.4%
Feb-2014 1,955 - 18.6% 1,320 - 22.4%
Mar-2014 2,102 - 11.6% 1,361 - 21.6%
Apr-2014 2,429 - 12.3% 1,452 - 26.6%
Average 2,519 - 21.1% 1,658 - 25.5%
All data from MLS Property Information Network, Inc. Provided by the Greater Boston Association of REALTORS® and the Massachusetts Association of REALTORS®. Powered by 10K Research and Marketing. | Click for Cover Page | 7
4,251
3,297
2,771
1,979
2,429
1,452
Single-Family Condominium
April
1,000
2,000
3,000
4,000
5,000
6,000
7,000
8,000
9,000
Jan-2003 Jan-2004 Jan-2005 Jan-2006 Jan-2007 Jan-2008 Jan-2009 Jan-2010 Jan-2011 Jan-2012 Jan-2013 Jan-2014
Historical Inventory of Homes for Sale Single-Family Condominium
-26.6%-40.0%-34.8%
20142013 20142013
-12.3%
2012 2012
Months Supply of Inventory
The inventory of homes for sale at the end of a given month, divided by the average monthly pending sales from the last 12 months.
Single-Family
YoY
Change
Condominium
YoY
Change
May-2013 2.8 - 37.0% 1.9 - 38.6%
Jun-2013 2.0 - 25.8% 1.6 - 30.8%
Jul-2013 1.9 - 36.3% 1.5 - 43.4%
Aug-2013 1.9 - 31.4% 1.4 - 31.8%
Sep-2013 3.3 - 34.8% 2.2 - 34.2%
Oct-2013 3.4 - 24.8% 2.5 - 23.6%
Nov-2013 3.1 - 7.9% 2.2 - 15.4%
Dec-2013 2.1 - 26.3% 1.6 - 18.7%
Jan-2014 3.2 - 15.7% 2.4 - 22.2%
Feb-2014 4.8 - 15.2% 3.1 - 19.8%
Mar-2014 3.8 - 0.2% 2.1 - 23.5%
Apr-2014 3.6 + 0.0% 1.8 - 26.7%
Average 2.7 - 27.9% 1.9 - 33.4%
All data from MLS Property Information Network, Inc. Provided by the Greater Boston Association of REALTORS® and the Massachusetts Association of REALTORS®. Powered by 10K Research and Marketing. | Click for Cover Page | 8
5.8
4.4
3.6
2.5
3.6
1.8
Single-Family Condominium
April
0
2
4
6
8
10
12
14
16
Jan-2004 Jan-2005 Jan-2006 Jan-2007 Jan-2008 Jan-2009 Jan-2010 Jan-2011 Jan-2012 Jan-2013 Jan-2014
Historical Months Supply of Inventory Single-Family Condominium
-26.7%-43.6%-37.5%
20142013 20142013
+0.0%
2012 2012
Days on Market Until Sale
Average number of days between when a property is listed and when an offer is accepted in a given month.
Single-Family
YoY
Change
Condominium
YoY
Change
May-2013 75 - 22.3% 51 - 40.3%
Jun-2013 56 - 37.8% 43 - 42.4%
Jul-2013 47 - 41.6% 38 - 46.2%
Aug-2013 48 - 45.0% 40 - 47.1%
Sep-2013 57 - 36.1% 49 - 42.0%
Oct-2013 59 - 33.7% 47 - 43.9%
Nov-2013 65 - 27.2% 51 - 33.6%
Dec-2013 70 - 28.0% 55 - 34.1%
Jan-2014 79 - 27.5% 63 - 28.9%
Feb-2014 89 - 19.8% 78 - 17.9%
Mar-2014 82 - 23.1% 65 - 8.4%
Apr-2014 81 - 12.7% 56 - 11.8%
Total 63 - 32.1% 48 - 34.2%
All data from MLS Property Information Network, Inc. Provided by the Greater Boston Association of REALTORS® and the Massachusetts Association of REALTORS®. Powered by 10K Research and Marketing. | Click for Cover Page | 9
120
98
93
63
81
56
Single-Family Condominium
April
30
50
70
90
110
130
150
Jan-2003 Jan-2004 Jan-2005 Jan-2006 Jan-2007 Jan-2008 Jan-2009 Jan-2010 Jan-2011 Jan-2012 Jan-2013 Jan-2014
Historical Days on Market Until Sale Single-Family Condominium
-11.8%-35.1%-22.8%
128
113
104
77
82
64
Single-Family Condominium
Year to Date
-16.7%-32.0%-18.9%
20142013 20142013 20142013 20142013
-12.7% -20.6%
2012 2012 2012 2012
Percent of Original List Price Received
Single-Family
YoY
Change
Condominium
YoY
Change
May-2013 97.8% + 2.6% 99.5% + 3.5%
Jun-2013 98.4% + 3.3% 99.7% + 3.5%
Jul-2013 98.1% + 2.4% 99.9% + 3.5%
Aug-2013 97.9% + 3.3% 99.7% + 3.5%
Sep-2013 97.3% + 3.0% 99.0% + 2.6%
Oct-2013 97.2% + 3.0% 98.8% + 3.1%
Nov-2013 96.3% + 1.7% 98.9% + 2.8%
Dec-2013 95.9% + 1.8% 98.0% + 1.9%
Jan-2014 95.8% + 2.0% 97.4% + 1.6%
Feb-2014 96.1% + 2.0% 98.1% + 1.5%
Mar-2014 97.0% + 1.9% 98.9% + 1.3%
Apr-2014 98.1% + 1.4% 99.7% + 0.9%
Average 97.4% + 2.5% 99.2% + 2.7%
All data from MLS Property Information Network, Inc. Provided by the Greater Boston Association of REALTORS® and the Massachusetts Association of REALTORS®. Powered by 10K Research and Marketing. | Click for Cover Page | 10
Percentage found when dividing a property’s sales price by its original list price, then taking the average for all properties sold in a given month,
not accounting for seller concessions.
93.5% 95.7%96.7% 98.8%98.1% 99.7%
Single-Family Condominium
April
89%
91%
93%
95%
97%
99%
101%
Jan-2003 Jan-2004 Jan-2005 Jan-2006 Jan-2007 Jan-2008 Jan-2009 Jan-2010 Jan-2011 Jan-2012 Jan-2013 Jan-2014
Historical Percent of Original List Price Received Single-Family Condominium
+0.9%+3.2%+3.5%
92.3% 94.3%95.2% 97.4%96.8% 98.7%
Single-Family Condominium
Year to Date
+1.3%+3.3%+3.1%
20142013 20142013 20142013 20142013
+1.4% +1.8%
2012 2012 2012 2012
Pending Sales
A count of the properties in UAG status between the first and last day in a given month, regardless of current status (based on Off Market Date).
Single-Family
YoY
Change
Condominium
YoY
Change
May-2013 1,477 + 15.6% 1,257 + 6.7%
Jun-2013 1,282 + 9.3% 1,088 + 9.8%
Jul-2013 975 + 4.5% 949 + 19.5%
Aug-2013 887 + 15.2% 756 + 3.7%
Sep-2013 834 - 2.1% 782 + 6.8%
Oct-2013 939 + 8.2% 814 + 3.0%
Nov-2013 695 + 2.2% 633 + 6.9%
Dec-2013 471 - 6.0% 418 - 8.9%
Jan-2014 512 - 17.7% 604 - 7.9%
Feb-2014 666 - 5.1% 720 + 1.1%
Mar-2014 1,080 - 7.2% 1,012 - 12.9%
Apr-2014 1,313 - 4.9% 1,207 - 4.9%
Total 11,131 + 1.9% 10,240 + 1.7%
All data from MLS Property Information Network, Inc. Provided by the Greater Boston Association of REALTORS® and the Massachusetts Association of REALTORS®. Powered by 10K Research and Marketing. | Click for Cover Page | 11
1,228
1,163
1,380
1,2691,313
1,207
Single-Family Condominium
April
200
400
600
800
1,000
1,200
1,400
1,600
1,800
2,000
2,200
Jan-2003 Jan-2004 Jan-2005 Jan-2006 Jan-2007 Jan-2008 Jan-2009 Jan-2010 Jan-2011 Jan-2012 Jan-2013 Jan-2014
Historical Pending Sales Activity Single-Family Condominium
-4.9%+9.1%+12.4%
3,728
3,525
3,868 3,799
3,571 3,543
Single-Family Condominium
Year to Date
-6.7%+7.8%+3.8%
20142013 20142013 20142013 20142013
-4.9% -7.7%
2012 2012 2012 2012
New Listings
A count of the properties that have been newly listed on the market in a given month.
Single-Family
YoY
Change
Condominium
YoY
Change
May-2013 1,981 + 14.4% 1,532 + 12.6%
Jun-2013 1,505 + 15.1% 1,223 + 7.9%
Jul-2013 1,114 + 12.2% 995 + 12.6%
Aug-2013 1,029 + 5.9% 868 + 11.9%
Sep-2013 1,455 + 6.3% 1,253 + 11.0%
Oct-2013 1,219 + 18.7% 1,009 + 17.2%
Nov-2013 651 + 4.5% 554 + 0.4%
Dec-2013 396 + 13.1% 362 + 17.9%
Jan-2014 731 - 16.0% 739 - 18.1%
Feb-2014 931 - 5.4% 887 - 6.6%
Mar-2014 1,458 + 8.6% 1,205 - 10.3%
Apr-2014 1,882 - 5.7% 1,482 - 10.8%
Total 14,352 + 5.8% 12,109 + 2.1%
All data from MLS Property Information Network, Inc. Provided by the Greater Boston Association of REALTORS® and the Massachusetts Association of REALTORS®. Powered by 10K Research and Marketing. | Click for Cover Page | 12
1,740
1,464
1,995
1,661
1,882
1,482
Single-Family Condominium
April
0
250
500
750
1,000
1,250
1,500
1,750
2,000
2,250
2,500
2,750
Jan-2003 Jan-2004 Jan-2005 Jan-2006 Jan-2007 Jan-2008 Jan-2009 Jan-2010 Jan-2011 Jan-2012 Jan-2013 Jan-2014
Historical New Listing Activity Single-Family Condominium
-10.8%+13.5%+14.7%
5,867
5,2025,191
4,8565,002
4,313
Single-Family Condominium
Year to Date
-11.2%-6.7%-11.5%
20142013 20142013 20142013 20142013
-5.7% -3.6%
2012 2012 2012 2012
City of Boston – Market Overview
Key market metrics for the current month and year-to-date figures for the City of Boston.
Key Metrics Historical Sparklines Apr-2013 Apr-2014 + / – YTD 2013 YTD 2014 + / –
- 10.5%
All data from MLS Property Information Network, Inc. Provided by the Greater Boston Association of REALTORS® and the Massachusetts Association of REALTORS®. Powered by 10K Research and Marketing. | Click for Cover Page | 13
New Listings 929 881 - 5.2% 2,684 2,402
+ 1.3%
Pending Sales 708 672 - 5.1% 2,078 1,911 - 8.0%
Percent of Original
List Price Received
98.4% 99.8% + 1.3% 97.4% 98.7%
--
Days on Market Until Sale 55 47 - 13.9% 67 60 - 11.4%
Months Supply of Inventory 2.4 2.0 - 18.6% -- --
- 21.4%
Inventory of Homes for Sale 973 806 - 17.2% -- -- --
Housing Affordability Index 100 82 - 18.4% 109 86
+ 2.7%
Median Sales Price $413,000 $461,450 + 11.7% $410,000 $475,000 + 15.9%
Closed Sales 405 412 + 1.7% 1,254 1,288
4-2011 4-2012 4-2013 4-2014
4-2011 4-2012 4-2013 4-2014
4-2011 4-2012 4-2013 4-2014
4-2011 4-2012 4-2013 4-2014
4-2011 4-2012 4-2013 4-2014
4-2011 4-2012 4-2013 4-2014
4-2011 4-2012 4-2013 4-2014
4-2011 4-2012 4-2013 4-2014
4-2011 4-2012 4-2013 4-2014

More Related Content

More from Unit Realty Group

December 2015 multi family housing activity report – boston, ma real estate
December 2015 multi family housing activity report – boston, ma real estateDecember 2015 multi family housing activity report – boston, ma real estate
December 2015 multi family housing activity report – boston, ma real estateUnit Realty Group
 
October 2015 Greater Boston Real Estate Market Trends Report
October 2015 Greater Boston Real Estate Market Trends ReportOctober 2015 Greater Boston Real Estate Market Trends Report
October 2015 Greater Boston Real Estate Market Trends ReportUnit Realty Group
 
September 2015 Greater Boston Real Estate Market Trends Report
September 2015 Greater Boston Real Estate Market Trends ReportSeptember 2015 Greater Boston Real Estate Market Trends Report
September 2015 Greater Boston Real Estate Market Trends ReportUnit Realty Group
 
August 2015 Greater Boston Real Estate Market Trends Report
August 2015 Greater Boston Real Estate Market Trends ReportAugust 2015 Greater Boston Real Estate Market Trends Report
August 2015 Greater Boston Real Estate Market Trends ReportUnit Realty Group
 
February 2015 Greater Boston Real Estate Market Trends Report
February 2015 Greater Boston Real Estate Market Trends ReportFebruary 2015 Greater Boston Real Estate Market Trends Report
February 2015 Greater Boston Real Estate Market Trends ReportUnit Realty Group
 
January 2015 Greater Boston Real Estate Market Trends Report
January 2015 Greater Boston Real Estate Market Trends ReportJanuary 2015 Greater Boston Real Estate Market Trends Report
January 2015 Greater Boston Real Estate Market Trends ReportUnit Realty Group
 
December 2014 Greater Boston Real Estate Market Trends Report
December 2014 Greater Boston Real Estate Market Trends ReportDecember 2014 Greater Boston Real Estate Market Trends Report
December 2014 Greater Boston Real Estate Market Trends ReportUnit Realty Group
 
November 2014 Greater Boston Real Estate Market Trends Report
November 2014 Greater Boston Real Estate Market Trends ReportNovember 2014 Greater Boston Real Estate Market Trends Report
November 2014 Greater Boston Real Estate Market Trends ReportUnit Realty Group
 
October 2014 Greater Boston Real Estate Market Trends Report
October 2014 Greater Boston Real Estate Market Trends ReportOctober 2014 Greater Boston Real Estate Market Trends Report
October 2014 Greater Boston Real Estate Market Trends ReportUnit Realty Group
 
September 2014 Multi-family Housing Activity Report – Boston, MA Real Estate
September 2014 Multi-family Housing Activity Report – Boston, MA Real EstateSeptember 2014 Multi-family Housing Activity Report – Boston, MA Real Estate
September 2014 Multi-family Housing Activity Report – Boston, MA Real EstateUnit Realty Group
 
Boston By The Numbers - Boston Housing Stock (Report)
Boston By The Numbers - Boston Housing Stock (Report)Boston By The Numbers - Boston Housing Stock (Report)
Boston By The Numbers - Boston Housing Stock (Report)Unit Realty Group
 
January 2014 Greater Boston Real Estate Market Trends Report
January 2014 Greater Boston Real Estate Market Trends ReportJanuary 2014 Greater Boston Real Estate Market Trends Report
January 2014 Greater Boston Real Estate Market Trends ReportUnit Realty Group
 
November 2013 Multi-family Housing Activity Report – Boston, MA Real Estate
November 2013 Multi-family Housing Activity Report – Boston, MA Real EstateNovember 2013 Multi-family Housing Activity Report – Boston, MA Real Estate
November 2013 Multi-family Housing Activity Report – Boston, MA Real EstateUnit Realty Group
 
October 2013 Multi-family Housing Activity Report – Boston, MA Real Estate
October 2013 Multi-family Housing Activity Report – Boston, MA Real EstateOctober 2013 Multi-family Housing Activity Report – Boston, MA Real Estate
October 2013 Multi-family Housing Activity Report – Boston, MA Real EstateUnit Realty Group
 
September 2013 Multifamily Housing Activity Report – Boston, MA Real Estate
September 2013 Multifamily Housing Activity Report – Boston, MA Real EstateSeptember 2013 Multifamily Housing Activity Report – Boston, MA Real Estate
September 2013 Multifamily Housing Activity Report – Boston, MA Real EstateUnit Realty Group
 
August 2013 Multifamily Housing Activity Report – Boston, MA Real Estate
August 2013 Multifamily Housing Activity Report – Boston, MA Real EstateAugust 2013 Multifamily Housing Activity Report – Boston, MA Real Estate
August 2013 Multifamily Housing Activity Report – Boston, MA Real EstateUnit Realty Group
 
June 2013 Multifamily Housing Activity Report – Boston, MA Real Estate
June 2013 Multifamily Housing Activity Report – Boston, MA Real EstateJune 2013 Multifamily Housing Activity Report – Boston, MA Real Estate
June 2013 Multifamily Housing Activity Report – Boston, MA Real EstateUnit Realty Group
 
June 2013's Monthly Indicators report - Boston Real Estate Market Trends
June 2013's Monthly Indicators report - Boston Real Estate Market TrendsJune 2013's Monthly Indicators report - Boston Real Estate Market Trends
June 2013's Monthly Indicators report - Boston Real Estate Market TrendsUnit Realty Group
 
April 2013 Monthly Multi-family Housing Activity Report – Boston Real Estate
April 2013 Monthly Multi-family Housing Activity Report – Boston Real Estate April 2013 Monthly Multi-family Housing Activity Report – Boston Real Estate
April 2013 Monthly Multi-family Housing Activity Report – Boston Real Estate Unit Realty Group
 
April 2013's Monthly Indicators report - Boston Real Estate Market Trends
April 2013's Monthly Indicators report - Boston Real Estate Market TrendsApril 2013's Monthly Indicators report - Boston Real Estate Market Trends
April 2013's Monthly Indicators report - Boston Real Estate Market TrendsUnit Realty Group
 

More from Unit Realty Group (20)

December 2015 multi family housing activity report – boston, ma real estate
December 2015 multi family housing activity report – boston, ma real estateDecember 2015 multi family housing activity report – boston, ma real estate
December 2015 multi family housing activity report – boston, ma real estate
 
October 2015 Greater Boston Real Estate Market Trends Report
October 2015 Greater Boston Real Estate Market Trends ReportOctober 2015 Greater Boston Real Estate Market Trends Report
October 2015 Greater Boston Real Estate Market Trends Report
 
September 2015 Greater Boston Real Estate Market Trends Report
September 2015 Greater Boston Real Estate Market Trends ReportSeptember 2015 Greater Boston Real Estate Market Trends Report
September 2015 Greater Boston Real Estate Market Trends Report
 
August 2015 Greater Boston Real Estate Market Trends Report
August 2015 Greater Boston Real Estate Market Trends ReportAugust 2015 Greater Boston Real Estate Market Trends Report
August 2015 Greater Boston Real Estate Market Trends Report
 
February 2015 Greater Boston Real Estate Market Trends Report
February 2015 Greater Boston Real Estate Market Trends ReportFebruary 2015 Greater Boston Real Estate Market Trends Report
February 2015 Greater Boston Real Estate Market Trends Report
 
January 2015 Greater Boston Real Estate Market Trends Report
January 2015 Greater Boston Real Estate Market Trends ReportJanuary 2015 Greater Boston Real Estate Market Trends Report
January 2015 Greater Boston Real Estate Market Trends Report
 
December 2014 Greater Boston Real Estate Market Trends Report
December 2014 Greater Boston Real Estate Market Trends ReportDecember 2014 Greater Boston Real Estate Market Trends Report
December 2014 Greater Boston Real Estate Market Trends Report
 
November 2014 Greater Boston Real Estate Market Trends Report
November 2014 Greater Boston Real Estate Market Trends ReportNovember 2014 Greater Boston Real Estate Market Trends Report
November 2014 Greater Boston Real Estate Market Trends Report
 
October 2014 Greater Boston Real Estate Market Trends Report
October 2014 Greater Boston Real Estate Market Trends ReportOctober 2014 Greater Boston Real Estate Market Trends Report
October 2014 Greater Boston Real Estate Market Trends Report
 
September 2014 Multi-family Housing Activity Report – Boston, MA Real Estate
September 2014 Multi-family Housing Activity Report – Boston, MA Real EstateSeptember 2014 Multi-family Housing Activity Report – Boston, MA Real Estate
September 2014 Multi-family Housing Activity Report – Boston, MA Real Estate
 
Boston By The Numbers - Boston Housing Stock (Report)
Boston By The Numbers - Boston Housing Stock (Report)Boston By The Numbers - Boston Housing Stock (Report)
Boston By The Numbers - Boston Housing Stock (Report)
 
January 2014 Greater Boston Real Estate Market Trends Report
January 2014 Greater Boston Real Estate Market Trends ReportJanuary 2014 Greater Boston Real Estate Market Trends Report
January 2014 Greater Boston Real Estate Market Trends Report
 
November 2013 Multi-family Housing Activity Report – Boston, MA Real Estate
November 2013 Multi-family Housing Activity Report – Boston, MA Real EstateNovember 2013 Multi-family Housing Activity Report – Boston, MA Real Estate
November 2013 Multi-family Housing Activity Report – Boston, MA Real Estate
 
October 2013 Multi-family Housing Activity Report – Boston, MA Real Estate
October 2013 Multi-family Housing Activity Report – Boston, MA Real EstateOctober 2013 Multi-family Housing Activity Report – Boston, MA Real Estate
October 2013 Multi-family Housing Activity Report – Boston, MA Real Estate
 
September 2013 Multifamily Housing Activity Report – Boston, MA Real Estate
September 2013 Multifamily Housing Activity Report – Boston, MA Real EstateSeptember 2013 Multifamily Housing Activity Report – Boston, MA Real Estate
September 2013 Multifamily Housing Activity Report – Boston, MA Real Estate
 
August 2013 Multifamily Housing Activity Report – Boston, MA Real Estate
August 2013 Multifamily Housing Activity Report – Boston, MA Real EstateAugust 2013 Multifamily Housing Activity Report – Boston, MA Real Estate
August 2013 Multifamily Housing Activity Report – Boston, MA Real Estate
 
June 2013 Multifamily Housing Activity Report – Boston, MA Real Estate
June 2013 Multifamily Housing Activity Report – Boston, MA Real EstateJune 2013 Multifamily Housing Activity Report – Boston, MA Real Estate
June 2013 Multifamily Housing Activity Report – Boston, MA Real Estate
 
June 2013's Monthly Indicators report - Boston Real Estate Market Trends
June 2013's Monthly Indicators report - Boston Real Estate Market TrendsJune 2013's Monthly Indicators report - Boston Real Estate Market Trends
June 2013's Monthly Indicators report - Boston Real Estate Market Trends
 
April 2013 Monthly Multi-family Housing Activity Report – Boston Real Estate
April 2013 Monthly Multi-family Housing Activity Report – Boston Real Estate April 2013 Monthly Multi-family Housing Activity Report – Boston Real Estate
April 2013 Monthly Multi-family Housing Activity Report – Boston Real Estate
 
April 2013's Monthly Indicators report - Boston Real Estate Market Trends
April 2013's Monthly Indicators report - Boston Real Estate Market TrendsApril 2013's Monthly Indicators report - Boston Real Estate Market Trends
April 2013's Monthly Indicators report - Boston Real Estate Market Trends
 

Recently uploaded

BDSM⚡Call Girls in Sector 57 Noida Escorts >༒8448380779 Escort Service
BDSM⚡Call Girls in Sector 57 Noida Escorts >༒8448380779 Escort ServiceBDSM⚡Call Girls in Sector 57 Noida Escorts >༒8448380779 Escort Service
BDSM⚡Call Girls in Sector 57 Noida Escorts >༒8448380779 Escort ServiceDelhi Call girls
 
Call Girls in Karkardooma Delhi +91 84487779280}Woman Seeking Man in Delhi NCR
Call Girls in Karkardooma Delhi +91 84487779280}Woman Seeking Man in Delhi NCRCall Girls in Karkardooma Delhi +91 84487779280}Woman Seeking Man in Delhi NCR
Call Girls in Karkardooma Delhi +91 84487779280}Woman Seeking Man in Delhi NCRasmaqueen5
 
9990771857 Call Girls in Dwarka Sector 08 Delhi (Call Girls) Delhi
9990771857 Call Girls in Dwarka Sector 08 Delhi (Call Girls) Delhi9990771857 Call Girls in Dwarka Sector 08 Delhi (Call Girls) Delhi
9990771857 Call Girls in Dwarka Sector 08 Delhi (Call Girls) Delhidelhimodel235
 
Purva Soukhyam in Guduvancheri Chennai.pdf
Purva Soukhyam in Guduvancheri Chennai.pdfPurva Soukhyam in Guduvancheri Chennai.pdf
Purva Soukhyam in Guduvancheri Chennai.pdfpritika141199
 
M3M The Line Brochure - Premium Investment Opportunity for Commercial Ventures
M3M The Line Brochure - Premium Investment Opportunity for Commercial VenturesM3M The Line Brochure - Premium Investment Opportunity for Commercial Ventures
M3M The Line Brochure - Premium Investment Opportunity for Commercial Venturessheltercareglobal
 
Magarpatta Nova Elegance Mundhwa Pune E-Brochure.pdf
Magarpatta Nova Elegance Mundhwa Pune  E-Brochure.pdfMagarpatta Nova Elegance Mundhwa Pune  E-Brochure.pdf
Magarpatta Nova Elegance Mundhwa Pune E-Brochure.pdfManishSaxena95
 
Premium Villa Projects in Sarjapur Road Bengaluru
Premium Villa Projects in Sarjapur Road BengaluruPremium Villa Projects in Sarjapur Road Bengaluru
Premium Villa Projects in Sarjapur Road BengaluruShivaSeo3
 
Enjoy Night ≽ 8448380779 ≼ Call Girls In Iffco Chowk (Gurgaon)
Enjoy Night ≽ 8448380779 ≼ Call Girls In Iffco Chowk (Gurgaon)Enjoy Night ≽ 8448380779 ≼ Call Girls In Iffco Chowk (Gurgaon)
Enjoy Night ≽ 8448380779 ≼ Call Girls In Iffco Chowk (Gurgaon)Delhi Call girls
 
9990771857 Call Girls in Dwarka Sector 1 Delhi (Call Girls) Delhi
9990771857 Call Girls in Dwarka Sector 1 Delhi (Call Girls) Delhi9990771857 Call Girls in Dwarka Sector 1 Delhi (Call Girls) Delhi
9990771857 Call Girls in Dwarka Sector 1 Delhi (Call Girls) Delhidelhimodel235
 
Best Deal Virtual Space in Satya The Hive Tata Zudio 750 Sqft 1.89 Cr All inc...
Best Deal Virtual Space in Satya The Hive Tata Zudio 750 Sqft 1.89 Cr All inc...Best Deal Virtual Space in Satya The Hive Tata Zudio 750 Sqft 1.89 Cr All inc...
Best Deal Virtual Space in Satya The Hive Tata Zudio 750 Sqft 1.89 Cr All inc...ApartmentWala1
 
Call Girls In Vasant Vihar Delhi 💯Call Us 🔝8264348440🔝
Call Girls In Vasant Vihar Delhi 💯Call Us 🔝8264348440🔝Call Girls In Vasant Vihar Delhi 💯Call Us 🔝8264348440🔝
Call Girls In Vasant Vihar Delhi 💯Call Us 🔝8264348440🔝soniya singh
 
M3M 129 E Brochure Noida Expressway, Sector 129, Noida
M3M 129 E Brochure Noida Expressway, Sector 129, NoidaM3M 129 E Brochure Noida Expressway, Sector 129, Noida
M3M 129 E Brochure Noida Expressway, Sector 129, Noidasarak0han45400
 
9990771857 Call Girls in Dwarka Sector 137 Noida (Call Girls) Delhi
9990771857 Call Girls in Dwarka Sector 137 Noida (Call Girls) Delhi9990771857 Call Girls in Dwarka Sector 137 Noida (Call Girls) Delhi
9990771857 Call Girls in Dwarka Sector 137 Noida (Call Girls) Delhidelhimodel235
 
BPTP THE AMAARIO For The Royals Of Tomorrow in Sector 37D Gurgaon Dwarka Expr...
BPTP THE AMAARIO For The Royals Of Tomorrow in Sector 37D Gurgaon Dwarka Expr...BPTP THE AMAARIO For The Royals Of Tomorrow in Sector 37D Gurgaon Dwarka Expr...
BPTP THE AMAARIO For The Royals Of Tomorrow in Sector 37D Gurgaon Dwarka Expr...ApartmentWala1
 
2k Shots ≽ 9205541914 ≼ Call Girls In Sainik Farm (Delhi)
2k Shots ≽ 9205541914 ≼ Call Girls In Sainik Farm (Delhi)2k Shots ≽ 9205541914 ≼ Call Girls In Sainik Farm (Delhi)
2k Shots ≽ 9205541914 ≼ Call Girls In Sainik Farm (Delhi)Delhi Call girls
 
9990771857 Call Girls in Dwarka Sector 6 Delhi (Call Girls) Delhi
9990771857 Call Girls in Dwarka Sector 6 Delhi (Call Girls) Delhi9990771857 Call Girls in Dwarka Sector 6 Delhi (Call Girls) Delhi
9990771857 Call Girls in Dwarka Sector 6 Delhi (Call Girls) Delhidelhimodel235
 
Enjoy Night ≽ 8448380779 ≼ Call Girls In Huda City Centre (Gurgaon)
Enjoy Night ≽ 8448380779 ≼ Call Girls In Huda City Centre (Gurgaon)Enjoy Night ≽ 8448380779 ≼ Call Girls In Huda City Centre (Gurgaon)
Enjoy Night ≽ 8448380779 ≼ Call Girls In Huda City Centre (Gurgaon)Delhi Call girls
 
BDSM⚡Call Girls in Sector 55 Noida Escorts >༒8448380779 Escort Service
BDSM⚡Call Girls in Sector 55 Noida Escorts >༒8448380779 Escort ServiceBDSM⚡Call Girls in Sector 55 Noida Escorts >༒8448380779 Escort Service
BDSM⚡Call Girls in Sector 55 Noida Escorts >༒8448380779 Escort ServiceDelhi Call girls
 
9990771857 Call Girls in Dwarka Sector 3 Delhi (Call Girls) Delhi
9990771857 Call Girls in Dwarka Sector 3 Delhi (Call Girls) Delhi9990771857 Call Girls in Dwarka Sector 3 Delhi (Call Girls) Delhi
9990771857 Call Girls in Dwarka Sector 3 Delhi (Call Girls) Delhidelhimodel235
 
Kohinoor Hinjewadi Phase 2 Pune E-Brochure.pdf
Kohinoor Hinjewadi Phase 2 Pune  E-Brochure.pdfKohinoor Hinjewadi Phase 2 Pune  E-Brochure.pdf
Kohinoor Hinjewadi Phase 2 Pune E-Brochure.pdfManishSaxena95
 

Recently uploaded (20)

BDSM⚡Call Girls in Sector 57 Noida Escorts >༒8448380779 Escort Service
BDSM⚡Call Girls in Sector 57 Noida Escorts >༒8448380779 Escort ServiceBDSM⚡Call Girls in Sector 57 Noida Escorts >༒8448380779 Escort Service
BDSM⚡Call Girls in Sector 57 Noida Escorts >༒8448380779 Escort Service
 
Call Girls in Karkardooma Delhi +91 84487779280}Woman Seeking Man in Delhi NCR
Call Girls in Karkardooma Delhi +91 84487779280}Woman Seeking Man in Delhi NCRCall Girls in Karkardooma Delhi +91 84487779280}Woman Seeking Man in Delhi NCR
Call Girls in Karkardooma Delhi +91 84487779280}Woman Seeking Man in Delhi NCR
 
9990771857 Call Girls in Dwarka Sector 08 Delhi (Call Girls) Delhi
9990771857 Call Girls in Dwarka Sector 08 Delhi (Call Girls) Delhi9990771857 Call Girls in Dwarka Sector 08 Delhi (Call Girls) Delhi
9990771857 Call Girls in Dwarka Sector 08 Delhi (Call Girls) Delhi
 
Purva Soukhyam in Guduvancheri Chennai.pdf
Purva Soukhyam in Guduvancheri Chennai.pdfPurva Soukhyam in Guduvancheri Chennai.pdf
Purva Soukhyam in Guduvancheri Chennai.pdf
 
M3M The Line Brochure - Premium Investment Opportunity for Commercial Ventures
M3M The Line Brochure - Premium Investment Opportunity for Commercial VenturesM3M The Line Brochure - Premium Investment Opportunity for Commercial Ventures
M3M The Line Brochure - Premium Investment Opportunity for Commercial Ventures
 
Magarpatta Nova Elegance Mundhwa Pune E-Brochure.pdf
Magarpatta Nova Elegance Mundhwa Pune  E-Brochure.pdfMagarpatta Nova Elegance Mundhwa Pune  E-Brochure.pdf
Magarpatta Nova Elegance Mundhwa Pune E-Brochure.pdf
 
Premium Villa Projects in Sarjapur Road Bengaluru
Premium Villa Projects in Sarjapur Road BengaluruPremium Villa Projects in Sarjapur Road Bengaluru
Premium Villa Projects in Sarjapur Road Bengaluru
 
Enjoy Night ≽ 8448380779 ≼ Call Girls In Iffco Chowk (Gurgaon)
Enjoy Night ≽ 8448380779 ≼ Call Girls In Iffco Chowk (Gurgaon)Enjoy Night ≽ 8448380779 ≼ Call Girls In Iffco Chowk (Gurgaon)
Enjoy Night ≽ 8448380779 ≼ Call Girls In Iffco Chowk (Gurgaon)
 
9990771857 Call Girls in Dwarka Sector 1 Delhi (Call Girls) Delhi
9990771857 Call Girls in Dwarka Sector 1 Delhi (Call Girls) Delhi9990771857 Call Girls in Dwarka Sector 1 Delhi (Call Girls) Delhi
9990771857 Call Girls in Dwarka Sector 1 Delhi (Call Girls) Delhi
 
Best Deal Virtual Space in Satya The Hive Tata Zudio 750 Sqft 1.89 Cr All inc...
Best Deal Virtual Space in Satya The Hive Tata Zudio 750 Sqft 1.89 Cr All inc...Best Deal Virtual Space in Satya The Hive Tata Zudio 750 Sqft 1.89 Cr All inc...
Best Deal Virtual Space in Satya The Hive Tata Zudio 750 Sqft 1.89 Cr All inc...
 
Call Girls In Vasant Vihar Delhi 💯Call Us 🔝8264348440🔝
Call Girls In Vasant Vihar Delhi 💯Call Us 🔝8264348440🔝Call Girls In Vasant Vihar Delhi 💯Call Us 🔝8264348440🔝
Call Girls In Vasant Vihar Delhi 💯Call Us 🔝8264348440🔝
 
M3M 129 E Brochure Noida Expressway, Sector 129, Noida
M3M 129 E Brochure Noida Expressway, Sector 129, NoidaM3M 129 E Brochure Noida Expressway, Sector 129, Noida
M3M 129 E Brochure Noida Expressway, Sector 129, Noida
 
9990771857 Call Girls in Dwarka Sector 137 Noida (Call Girls) Delhi
9990771857 Call Girls in Dwarka Sector 137 Noida (Call Girls) Delhi9990771857 Call Girls in Dwarka Sector 137 Noida (Call Girls) Delhi
9990771857 Call Girls in Dwarka Sector 137 Noida (Call Girls) Delhi
 
BPTP THE AMAARIO For The Royals Of Tomorrow in Sector 37D Gurgaon Dwarka Expr...
BPTP THE AMAARIO For The Royals Of Tomorrow in Sector 37D Gurgaon Dwarka Expr...BPTP THE AMAARIO For The Royals Of Tomorrow in Sector 37D Gurgaon Dwarka Expr...
BPTP THE AMAARIO For The Royals Of Tomorrow in Sector 37D Gurgaon Dwarka Expr...
 
2k Shots ≽ 9205541914 ≼ Call Girls In Sainik Farm (Delhi)
2k Shots ≽ 9205541914 ≼ Call Girls In Sainik Farm (Delhi)2k Shots ≽ 9205541914 ≼ Call Girls In Sainik Farm (Delhi)
2k Shots ≽ 9205541914 ≼ Call Girls In Sainik Farm (Delhi)
 
9990771857 Call Girls in Dwarka Sector 6 Delhi (Call Girls) Delhi
9990771857 Call Girls in Dwarka Sector 6 Delhi (Call Girls) Delhi9990771857 Call Girls in Dwarka Sector 6 Delhi (Call Girls) Delhi
9990771857 Call Girls in Dwarka Sector 6 Delhi (Call Girls) Delhi
 
Enjoy Night ≽ 8448380779 ≼ Call Girls In Huda City Centre (Gurgaon)
Enjoy Night ≽ 8448380779 ≼ Call Girls In Huda City Centre (Gurgaon)Enjoy Night ≽ 8448380779 ≼ Call Girls In Huda City Centre (Gurgaon)
Enjoy Night ≽ 8448380779 ≼ Call Girls In Huda City Centre (Gurgaon)
 
BDSM⚡Call Girls in Sector 55 Noida Escorts >༒8448380779 Escort Service
BDSM⚡Call Girls in Sector 55 Noida Escorts >༒8448380779 Escort ServiceBDSM⚡Call Girls in Sector 55 Noida Escorts >༒8448380779 Escort Service
BDSM⚡Call Girls in Sector 55 Noida Escorts >༒8448380779 Escort Service
 
9990771857 Call Girls in Dwarka Sector 3 Delhi (Call Girls) Delhi
9990771857 Call Girls in Dwarka Sector 3 Delhi (Call Girls) Delhi9990771857 Call Girls in Dwarka Sector 3 Delhi (Call Girls) Delhi
9990771857 Call Girls in Dwarka Sector 3 Delhi (Call Girls) Delhi
 
Kohinoor Hinjewadi Phase 2 Pune E-Brochure.pdf
Kohinoor Hinjewadi Phase 2 Pune  E-Brochure.pdfKohinoor Hinjewadi Phase 2 Pune  E-Brochure.pdf
Kohinoor Hinjewadi Phase 2 Pune E-Brochure.pdf
 

April 2014 Greater Boston Real Estate Market Trends Report

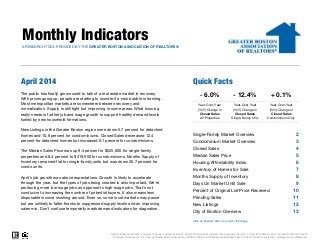
  • 1. Monthly IndicatorsA RESEARCH TOOL PROVIDED BY THE GREATER BOSTON ASSOCIATION OF REALTORS® April 2014 Quick Facts 2 3 4 5 6 7 8 9 10 11 12 13 Housing Affordability Index Inventory of Homes for Sale Click on desired metric to jump to that page. Months Supply of Inventory Days On Market Until Sale Percent of Original List Price Received City of Boston Overview Pending Sales New Listings Data is refreshed regularly to capture changes in market activity so figures shown may be different than previously reported. Current as of May 16, 2014. All data from MLS Property Information Network, Inc. Provided by Greater Boston Association of REALTORS® and the Massachusetts Association of REALTORS®. Powered by 10K Research and Marketing. - 12.4% Year-Over-Year (YoY) Change in Closed Sales Single-Family Only The public has finally grown used to talk of a real estate market in recovery. With prices going up, people are starting to wonder if a new bubble is forming. Most metropolitan markets are somewhere between recovery and normalization. Supply is still tight but improving in some areas. What housing really needs is further job and wage growth to support healthy demand levels fueled by new household formations. New Listings in the Greater Boston region were down 5.7 percent for detached homes and 10.8 percent for condominiums. Closed Sales decreased 12.4 percent for detached homes but increased 0.1 percent for condominiums. The Median Sales Price was up 9.4 percent to $525,000 for single-family properties and 8.4 percent to $419,950 for condominiums. Months Supply of Inventory remained flat for single-family units but was down 26.7 percent for condo units. April's job growth was above expectations. Growth is likely to accelerate through the year, but the types of jobs being created is also important. We're producing more low-wage jobs as opposed to high-wage jobs. That's not conducive to increasing the number of potential buyers. It also means less disposable income sloshing around. Even so, some local markets may pause but are unlikely to falter thanks to suppressed supply levels and an improving sales mix. Don't confuse temporarily weak demand indicators for stagnation. + 0.1% Year-Over-Year (YoY) Change in Closed Sales Condominium Only - 6.0% Year-Over-Year (YoY) Change in Closed Sales All Properties Single-Family Market Overview Condominium Market Overview Closed Sales Median Sales Price
  • 2. Single-Family Market Overview Key market metrics for the current month and year-to-date figures for Single-Family Homes Only. Key Metrics Historical Sparklines Apr-2013 Apr-2014 + / – YTD 2013 YTD 2014 + / – 2,195 - 8.7% All data from MLS Property Information Network, Inc. Provided by the Greater Boston Association of REALTORS® and the Massachusetts Association of REALTORS®. Powered by 10K Research and Marketing. | Click for Cover Page | 2 New Listings 1,995 1,882 - 5.7% 5,191 5,002 - 3.6% Closed Sales 767 672 - 12.4% 2,405 $499,900 + 13.6% 93 100 82 82 -- -- -- 2,771 2,429 3.6 + 0.0% $525,000 + 9.4% $440,000 104 Housing Affordability Index Inventory of Homes for Sale Months Supply of Inventory 3.6 $480,000 Pending Sales Median Sales Price - 7.7%3,5711,380 1,313 - 4.9% 3,868 - 12.3% -- -- - 18.4% 109 86 - 21.4% -- 95.2% 96.8% - 20.6% + 1.8% Percent of Original List Price Received Days on Market Until Sale 96.7% - 12.7% + 1.4% 81 98.1% 4-2011 4-2012 4-2013 4-2014 4-2011 4-2012 4-2013 4-2014 4-2011 4-2012 4-2013 4-2014 4-2011 4-2012 4-2013 4-2014 4-2011 4-2012 4-2013 4-2014 4-2011 4-2012 4-2013 4-2014 4-2011 4-2012 4-2013 4-2014 4-2011 4-2012 4-2013 4-2014 4-2011 4-2012 4-2013 4-2014
  • 3. Condominium Market Overview Key market metrics for the current month and year-to-date figures for Condominium Properties Only. Key Metrics Historical Sparklines Apr-2013 Apr-2014 + / – YTD 2013 YTD 2014 + / – - 11.2% All data from MLS Property Information Network, Inc. Provided by the Greater Boston Association of REALTORS® and the Massachusetts Association of REALTORS®. Powered by 10K Research and Marketing. | Click for Cover Page | 3 New Listings 1,661 1,482 - 10.8% 4,856 4,313 + 1.3% Pending Sales 1,269 1,207 - 4.9% 3,799 3,543 - 6.7% Percent of Original List Price Received 98.8% 99.7% + 0.9% 97.4% 98.7% -- Days on Market Until Sale 63 56 - 11.8% 77 64 - 16.7% Months Supply of Inventory 2.5 1.8 - 26.7% -- -- - 19.2% Inventory of Homes for Sale 1,979 1,452 - 26.6% -- -- -- Housing Affordability Index 124 102 - 17.6% 127 102 + 0.6% Median Sales Price $387,500 $419,950 + 8.4% $380,000 $420,000 + 10.5% Closed Sales 805 806 + 0.1% 2,382 2,397 4-2011 4-2012 4-2013 4-2014 4-2011 4-2012 4-2013 4-2014 4-2011 4-2012 4-2013 4-2014 4-2011 4-2012 4-2013 4-2014 4-2011 4-2012 4-2013 4-2014 4-2011 4-2012 4-2013 4-2014 4-2011 4-2012 4-2013 4-2014 4-2011 4-2012 4-2013 4-2014 4-2011 4-2012 4-2013 4-2014
  • 4. Closed Sales A count of the actual sales that have closed in a given month. Single-Family YoY Change Condominium YoY Change May-2013 1,096 + 10.0% 1,068 + 6.3% Jun-2013 1,481 - 1.1% 1,246 - 1.0% Jul-2013 1,488 + 18.0% 1,252 + 20.7% Aug-2013 1,429 + 11.6% 1,277 + 6.2% Sep-2013 919 + 22.4% 887 + 18.7% Oct-2013 855 + 10.5% 764 + 7.5% Nov-2013 791 - 11.4% 711 - 5.8% Dec-2013 900 + 10.6% 789 + 3.0% Jan-2014 569 - 4.7% 526 + 2.3% Feb-2014 408 - 4.0% 421 - 3.2% Mar-2014 546 - 11.4% 644 + 2.5% Apr-2014 672 - 12.4% 806 + 0.1% Total 11,154 + 4.5% 10,391 + 5.3% All data from MLS Property Information Network, Inc. Provided by the Greater Boston Association of REALTORS® and the Massachusetts Association of REALTORS®. Powered by 10K Research and Marketing. | Click for Cover Page | 4 735 756767 805 672 806 Single-Family Condominium April 200 400 600 800 1,000 1,200 1,400 1,600 1,800 Jan-2003 Jan-2004 Jan-2005 Jan-2006 Jan-2007 Jan-2008 Jan-2009 Jan-2010 Jan-2011 Jan-2012 Jan-2013 Jan-2014 Historical Closed Sales Activity Single-Family Condominium +0.1%+6.5%+4.4% 20142013 20142013 2,355 2,156 2,405 2,382 2,195 2,397 Single-Family Condominium Year to Date +0.6%+10.5%+2.1% 20142013 20142013 -12.4% -8.7% 2012 2012 2012 2012
  • 5. Median Sales Price Median price point for all closed sales, not accounting for seller concessions, in a given month. Single-Family YoY Change Condominium YoY Change May-2013 $500,000 + 7.2% $410,000 + 7.6% Jun-2013 $545,000 + 8.1% $420,000 + 5.0% Jul-2013 $533,000 + 4.1% $400,500 + 3.5% Aug-2013 $520,000 + 5.3% $416,000 + 9.5% Sep-2013 $502,500 + 15.5% $410,000 + 9.3% Oct-2013 $474,000 + 9.0% $416,750 + 13.8% Nov-2013 $480,000 + 6.7% $410,500 + 8.0% Dec-2013 $500,000 + 6.4% $420,800 + 10.6% Jan-2014 $486,575 + 13.2% $420,500 + 13.9% Feb-2014 $476,950 + 10.9% $400,000 + 14.3% Mar-2014 $499,950 + 16.2% $436,500 + 7.8% Apr-2014 $525,000 + 9.4% $419,950 + 8.4% Median $510,000 + 8.5% $415,000 + 8.4% All data from MLS Property Information Network, Inc. Provided by the Greater Boston Association of REALTORS® and the Massachusetts Association of REALTORS®. Powered by 10K Research and Marketing. | Click for Cover Page | 5 $420,000 $371,500 $480,000 $387,500 $525,000 $419,950 Single-Family Condominium April $250,000 $300,000 $350,000 $400,000 $450,000 $500,000 $550,000 Jan-2003 Jan-2004 Jan-2005 Jan-2006 Jan-2007 Jan-2008 Jan-2009 Jan-2010 Jan-2011 Jan-2012 Jan-2013 Jan-2014 Historical Median Sales Price Single-Family Condominium +8.4%+4.3%+14.3% 20142013 20142013 $411,000 $359,900 $440,000 $380,000 $499,900 $420,000 Single-Family Condominium Year to Date +10.5%+5.6%+7.1% 20142013 20142013 +9.4% +13.6% 2012 2012 2012 2012
  • 6. Housing Affordability Index Single-Family YoY Change Condominium YoY Change May-2013 93 - 5.3% 113 - 5.6% Jun-2013 81 - 11.7% 105 - 9.1% Jul-2013 83 - 8.8% 110 - 8.3% Aug-2013 84 - 10.6% 105 - 14.0% Sep-2013 88 - 18.8% 108 - 14.2% Oct-2013 94 - 13.4% 106 - 17.0% Nov-2013 98 - 6.9% 114 - 8.1% Dec-2013 90 - 11.6% 106 - 14.9% Jan-2014 87 - 22.6% 101 - 23.1% Feb-2014 90 - 18.1% 108 - 20.5% Mar-2014 86 - 21.5% 99 - 15.3% Apr-2014 82 - 18.4% 102 - 17.6% Average 88 -14.0% 107 -14.0% This index measures housing affordability for the region. An index of 120 means the median household income was 120% of what is necessary to qualify for the median-priced home under prevailing interest rates. A higher number means greater affordability. All data from MLS Property Information Network, Inc. Provided by the Greater Boston Association of REALTORS® and the Massachusetts Association of REALTORS®. Powered by 10K Research and Marketing. | Click for Cover Page | 6 108 122 100 124 82 102 Single-Family Condominium April 60 70 80 90 100 110 120 130 140 Jan-2004 Jan-2005 Jan-2006 Jan-2007 Jan-2008 Jan-2009 Jan-2010 Jan-2011 Jan-2012 Jan-2013 Jan-2014 Historical Housing Affordability Index Single-Family Condominium -17.6%+2.0%-6.9% 110 126 109 127 86 102 Single-Family Condominium Year to Date -19.2%+0.8%-0.6% 20142013 20142013 20142013 20142013 -18.4% -21.4% 2012 2012 2012 2012
  • 7. Inventory of Homes for Sale The number of properties available for sale in active status at the end of a given month. Single-Family YoY Change Condominium YoY Change May-2013 3,042 - 30.6% 2,078 - 34.8% Jun-2013 3,035 - 26.6% 2,035 - 31.5% Jul-2013 2,868 - 24.9% 1,872 - 31.7% Aug-2013 2,760 - 23.4% 1,756 - 27.6% Sep-2013 3,003 - 20.2% 1,975 - 21.9% Oct-2013 2,889 - 16.9% 1,906 - 18.0% Nov-2013 2,436 - 18.4% 1,599 - 20.3% Dec-2013 1,871 - 18.5% 1,277 - 16.3% Jan-2014 1,843 - 19.7% 1,261 - 20.4% Feb-2014 1,955 - 18.6% 1,320 - 22.4% Mar-2014 2,102 - 11.6% 1,361 - 21.6% Apr-2014 2,429 - 12.3% 1,452 - 26.6% Average 2,519 - 21.1% 1,658 - 25.5% All data from MLS Property Information Network, Inc. Provided by the Greater Boston Association of REALTORS® and the Massachusetts Association of REALTORS®. Powered by 10K Research and Marketing. | Click for Cover Page | 7 4,251 3,297 2,771 1,979 2,429 1,452 Single-Family Condominium April 1,000 2,000 3,000 4,000 5,000 6,000 7,000 8,000 9,000 Jan-2003 Jan-2004 Jan-2005 Jan-2006 Jan-2007 Jan-2008 Jan-2009 Jan-2010 Jan-2011 Jan-2012 Jan-2013 Jan-2014 Historical Inventory of Homes for Sale Single-Family Condominium -26.6%-40.0%-34.8% 20142013 20142013 -12.3% 2012 2012
  • 8. Months Supply of Inventory The inventory of homes for sale at the end of a given month, divided by the average monthly pending sales from the last 12 months. Single-Family YoY Change Condominium YoY Change May-2013 2.8 - 37.0% 1.9 - 38.6% Jun-2013 2.0 - 25.8% 1.6 - 30.8% Jul-2013 1.9 - 36.3% 1.5 - 43.4% Aug-2013 1.9 - 31.4% 1.4 - 31.8% Sep-2013 3.3 - 34.8% 2.2 - 34.2% Oct-2013 3.4 - 24.8% 2.5 - 23.6% Nov-2013 3.1 - 7.9% 2.2 - 15.4% Dec-2013 2.1 - 26.3% 1.6 - 18.7% Jan-2014 3.2 - 15.7% 2.4 - 22.2% Feb-2014 4.8 - 15.2% 3.1 - 19.8% Mar-2014 3.8 - 0.2% 2.1 - 23.5% Apr-2014 3.6 + 0.0% 1.8 - 26.7% Average 2.7 - 27.9% 1.9 - 33.4% All data from MLS Property Information Network, Inc. Provided by the Greater Boston Association of REALTORS® and the Massachusetts Association of REALTORS®. Powered by 10K Research and Marketing. | Click for Cover Page | 8 5.8 4.4 3.6 2.5 3.6 1.8 Single-Family Condominium April 0 2 4 6 8 10 12 14 16 Jan-2004 Jan-2005 Jan-2006 Jan-2007 Jan-2008 Jan-2009 Jan-2010 Jan-2011 Jan-2012 Jan-2013 Jan-2014 Historical Months Supply of Inventory Single-Family Condominium -26.7%-43.6%-37.5% 20142013 20142013 +0.0% 2012 2012
  • 9. Days on Market Until Sale Average number of days between when a property is listed and when an offer is accepted in a given month. Single-Family YoY Change Condominium YoY Change May-2013 75 - 22.3% 51 - 40.3% Jun-2013 56 - 37.8% 43 - 42.4% Jul-2013 47 - 41.6% 38 - 46.2% Aug-2013 48 - 45.0% 40 - 47.1% Sep-2013 57 - 36.1% 49 - 42.0% Oct-2013 59 - 33.7% 47 - 43.9% Nov-2013 65 - 27.2% 51 - 33.6% Dec-2013 70 - 28.0% 55 - 34.1% Jan-2014 79 - 27.5% 63 - 28.9% Feb-2014 89 - 19.8% 78 - 17.9% Mar-2014 82 - 23.1% 65 - 8.4% Apr-2014 81 - 12.7% 56 - 11.8% Total 63 - 32.1% 48 - 34.2% All data from MLS Property Information Network, Inc. Provided by the Greater Boston Association of REALTORS® and the Massachusetts Association of REALTORS®. Powered by 10K Research and Marketing. | Click for Cover Page | 9 120 98 93 63 81 56 Single-Family Condominium April 30 50 70 90 110 130 150 Jan-2003 Jan-2004 Jan-2005 Jan-2006 Jan-2007 Jan-2008 Jan-2009 Jan-2010 Jan-2011 Jan-2012 Jan-2013 Jan-2014 Historical Days on Market Until Sale Single-Family Condominium -11.8%-35.1%-22.8% 128 113 104 77 82 64 Single-Family Condominium Year to Date -16.7%-32.0%-18.9% 20142013 20142013 20142013 20142013 -12.7% -20.6% 2012 2012 2012 2012
  • 10. Percent of Original List Price Received Single-Family YoY Change Condominium YoY Change May-2013 97.8% + 2.6% 99.5% + 3.5% Jun-2013 98.4% + 3.3% 99.7% + 3.5% Jul-2013 98.1% + 2.4% 99.9% + 3.5% Aug-2013 97.9% + 3.3% 99.7% + 3.5% Sep-2013 97.3% + 3.0% 99.0% + 2.6% Oct-2013 97.2% + 3.0% 98.8% + 3.1% Nov-2013 96.3% + 1.7% 98.9% + 2.8% Dec-2013 95.9% + 1.8% 98.0% + 1.9% Jan-2014 95.8% + 2.0% 97.4% + 1.6% Feb-2014 96.1% + 2.0% 98.1% + 1.5% Mar-2014 97.0% + 1.9% 98.9% + 1.3% Apr-2014 98.1% + 1.4% 99.7% + 0.9% Average 97.4% + 2.5% 99.2% + 2.7% All data from MLS Property Information Network, Inc. Provided by the Greater Boston Association of REALTORS® and the Massachusetts Association of REALTORS®. Powered by 10K Research and Marketing. | Click for Cover Page | 10 Percentage found when dividing a property’s sales price by its original list price, then taking the average for all properties sold in a given month, not accounting for seller concessions. 93.5% 95.7%96.7% 98.8%98.1% 99.7% Single-Family Condominium April 89% 91% 93% 95% 97% 99% 101% Jan-2003 Jan-2004 Jan-2005 Jan-2006 Jan-2007 Jan-2008 Jan-2009 Jan-2010 Jan-2011 Jan-2012 Jan-2013 Jan-2014 Historical Percent of Original List Price Received Single-Family Condominium +0.9%+3.2%+3.5% 92.3% 94.3%95.2% 97.4%96.8% 98.7% Single-Family Condominium Year to Date +1.3%+3.3%+3.1% 20142013 20142013 20142013 20142013 +1.4% +1.8% 2012 2012 2012 2012
  • 11. Pending Sales A count of the properties in UAG status between the first and last day in a given month, regardless of current status (based on Off Market Date). Single-Family YoY Change Condominium YoY Change May-2013 1,477 + 15.6% 1,257 + 6.7% Jun-2013 1,282 + 9.3% 1,088 + 9.8% Jul-2013 975 + 4.5% 949 + 19.5% Aug-2013 887 + 15.2% 756 + 3.7% Sep-2013 834 - 2.1% 782 + 6.8% Oct-2013 939 + 8.2% 814 + 3.0% Nov-2013 695 + 2.2% 633 + 6.9% Dec-2013 471 - 6.0% 418 - 8.9% Jan-2014 512 - 17.7% 604 - 7.9% Feb-2014 666 - 5.1% 720 + 1.1% Mar-2014 1,080 - 7.2% 1,012 - 12.9% Apr-2014 1,313 - 4.9% 1,207 - 4.9% Total 11,131 + 1.9% 10,240 + 1.7% All data from MLS Property Information Network, Inc. Provided by the Greater Boston Association of REALTORS® and the Massachusetts Association of REALTORS®. Powered by 10K Research and Marketing. | Click for Cover Page | 11 1,228 1,163 1,380 1,2691,313 1,207 Single-Family Condominium April 200 400 600 800 1,000 1,200 1,400 1,600 1,800 2,000 2,200 Jan-2003 Jan-2004 Jan-2005 Jan-2006 Jan-2007 Jan-2008 Jan-2009 Jan-2010 Jan-2011 Jan-2012 Jan-2013 Jan-2014 Historical Pending Sales Activity Single-Family Condominium -4.9%+9.1%+12.4% 3,728 3,525 3,868 3,799 3,571 3,543 Single-Family Condominium Year to Date -6.7%+7.8%+3.8% 20142013 20142013 20142013 20142013 -4.9% -7.7% 2012 2012 2012 2012
  • 12. New Listings A count of the properties that have been newly listed on the market in a given month. Single-Family YoY Change Condominium YoY Change May-2013 1,981 + 14.4% 1,532 + 12.6% Jun-2013 1,505 + 15.1% 1,223 + 7.9% Jul-2013 1,114 + 12.2% 995 + 12.6% Aug-2013 1,029 + 5.9% 868 + 11.9% Sep-2013 1,455 + 6.3% 1,253 + 11.0% Oct-2013 1,219 + 18.7% 1,009 + 17.2% Nov-2013 651 + 4.5% 554 + 0.4% Dec-2013 396 + 13.1% 362 + 17.9% Jan-2014 731 - 16.0% 739 - 18.1% Feb-2014 931 - 5.4% 887 - 6.6% Mar-2014 1,458 + 8.6% 1,205 - 10.3% Apr-2014 1,882 - 5.7% 1,482 - 10.8% Total 14,352 + 5.8% 12,109 + 2.1% All data from MLS Property Information Network, Inc. Provided by the Greater Boston Association of REALTORS® and the Massachusetts Association of REALTORS®. Powered by 10K Research and Marketing. | Click for Cover Page | 12 1,740 1,464 1,995 1,661 1,882 1,482 Single-Family Condominium April 0 250 500 750 1,000 1,250 1,500 1,750 2,000 2,250 2,500 2,750 Jan-2003 Jan-2004 Jan-2005 Jan-2006 Jan-2007 Jan-2008 Jan-2009 Jan-2010 Jan-2011 Jan-2012 Jan-2013 Jan-2014 Historical New Listing Activity Single-Family Condominium -10.8%+13.5%+14.7% 5,867 5,2025,191 4,8565,002 4,313 Single-Family Condominium Year to Date -11.2%-6.7%-11.5% 20142013 20142013 20142013 20142013 -5.7% -3.6% 2012 2012 2012 2012
  • 13. City of Boston – Market Overview Key market metrics for the current month and year-to-date figures for the City of Boston. Key Metrics Historical Sparklines Apr-2013 Apr-2014 + / – YTD 2013 YTD 2014 + / – - 10.5% All data from MLS Property Information Network, Inc. Provided by the Greater Boston Association of REALTORS® and the Massachusetts Association of REALTORS®. Powered by 10K Research and Marketing. | Click for Cover Page | 13 New Listings 929 881 - 5.2% 2,684 2,402 + 1.3% Pending Sales 708 672 - 5.1% 2,078 1,911 - 8.0% Percent of Original List Price Received 98.4% 99.8% + 1.3% 97.4% 98.7% -- Days on Market Until Sale 55 47 - 13.9% 67 60 - 11.4% Months Supply of Inventory 2.4 2.0 - 18.6% -- -- - 21.4% Inventory of Homes for Sale 973 806 - 17.2% -- -- -- Housing Affordability Index 100 82 - 18.4% 109 86 + 2.7% Median Sales Price $413,000 $461,450 + 11.7% $410,000 $475,000 + 15.9% Closed Sales 405 412 + 1.7% 1,254 1,288 4-2011 4-2012 4-2013 4-2014 4-2011 4-2012 4-2013 4-2014 4-2011 4-2012 4-2013 4-2014 4-2011 4-2012 4-2013 4-2014 4-2011 4-2012 4-2013 4-2014 4-2011 4-2012 4-2013 4-2014 4-2011 4-2012 4-2013 4-2014 4-2011 4-2012 4-2013 4-2014 4-2011 4-2012 4-2013 4-2014