June 2015 Multi-family Housing Activity Report
•
1 like•223 views

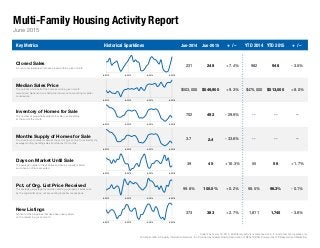
Here’s June 2015′s Monthly Multi-family Housing Activity Report from the Greater Boston Association of Realtors®. (Multi-family housing activity comparing June 2015 to June 2014) Closed sales were UP +7.4% to 248 Median prices were UP +9.3% ($549,900) Inventory of homes for sale were DOWN -29.9% (492) Months supply of home for sale were DOWN -33.6% (2.4) Days on market until sale were UP +16.3% (45) Percentage of original list price received were UP +0.2% (100.0%) New Listings were UP +2.7% (383)

Recommended
Recommended
More Related Content
More from Unit Realty Group
More from Unit Realty Group (20)
Recently uploaded
Recently uploaded (20)
June 2015 Multi-family Housing Activity Report
- 1. Multi-Family Housing Activity Report Key Metrics Historical Sparklines Jun-2014 Jun-2015 + / – YTD 2014 YTD 2015 + / – Pct. of Org. List Price Received The average percentage found when dividing a property's sales price by the original list price, not accounting for seller concessions. 99.8% 100.0% + 0.2% 98.5% 56 98.3% Current as of July 16, 2015. Multi-family activity is comprised of 2-, 3- and 4-family properties only. All data from MLS Property Information Network, Inc. Provided by Greater Boston Association of REALTORS®. Powered by 10K Research and Marketing. -- - 0.1% New Listings A count of the properties that have been newly listed on the market in a given month. 373 383 + 2.7% 1,811 1,745 - 3.6% + 1.7% Months Supply of Homes for Sale The inventory of homes for sale at the end of a given month, divided by the average monthly pending sales from the last 12 months. 3.7 2.4 Days on Market Until Sale The average number of days between when a property is listed and when an offer is accepted. 39 45 + 16.3% 55 Inventory of Homes for Sale The number of properties available for sale in active status at the end of the month. 702 492 - 29.9% -- -- $549,900 + 9.3% $475,000 $513,000 + 8.0% -- -- --- 33.6% June 2015 Closed Sales A count of actual sales that have closed within a given month. 231 248 + 7.4% 948 - 3.5% Median Sales Price The point at which half of the homes sold in a given month were priced higher and one half priced lower, not accounting for seller concessions. $503,000 982 6-2012 6-2013 6-2014 6-2015 6-2012 6-2013 6-2014 6-2015 6-2012 6-2013 6-2014 6-2015 6-2012 6-2013 6-2014 6-2015 6-2012 6-2013 6-2014 6-2015 6-2012 6-2013 6-2014 6-2015 6-2012 6-2013 6-2014 6-2015
- 2. Multi-Family Housing Activity Report – 2-Family Properties 6-2014 6-2015 + / – 6-2014 6-2015 + / – 6-2014 6-2015 + / – 6-2014 6-2015 + / – Acton 0 0 -- $0 $0 -- 0 0 -- 1 0 - 100.0% Arlington 2 9 + 350.0% $657,500 $730,000 + 11.0% 20 7 - 64.1% 7 0 - 100.0% Ashland 0 2 -- $0 $320,000 -- 0 91 -- 3 3 0.0% Attleboro 6 1 - 83.3% $226,500 $116,294 - 48.7% 45 22 - 50.9% 20 12 - 40.0% Avon 0 0 -- $0 $0 -- 0 0 -- 0 0 -- Bedford 0 0 -- $0 $0 -- 0 0 -- 2 0 - 100.0% Bellingham 0 0 -- $0 $0 -- 0 0 -- 1 3 + 200.0% Belmont 4 1 - 75.0% $800,000 $975,000 + 21.9% 13 16 + 28.0% 3 2 - 33.3% Boston 31 29 - 6.5% $475,000 $550,000 + 15.8% 42 42 + 1.4% 120 73 - 39.2% Boxborough 0 0 -- $0 $0 -- 0 0 -- 0 0 -- Brookline 1 3 + 200.0% $2,100,000 $1,700,000 - 19.0% 10 5 - 50.0% 2 4 + 100.0% Burlington 0 0 -- $0 $0 -- 0 0 -- 0 0 -- Cambridge 4 8 + 100.0% $850,000 $1,039,000 + 22.2% 18 23 + 30.7% 12 4 - 66.7% Canton 0 0 -- $0 $0 -- 0 0 -- 6 4 - 33.3% Carlisle 0 0 -- $0 $0 -- 0 0 -- 0 1 -- Chelsea 3 5 + 66.7% $369,900 $460,000 + 24.4% 57 48 - 16.6% 6 8 + 33.3% Concord 0 0 -- $0 $0 -- 0 0 -- 1 0 - 100.0% Dedham 0 1 -- $0 $405,000 -- 0 82 -- 3 5 + 66.7% Dover 0 0 -- $0 $0 -- 0 0 -- 0 0 -- Everett 11 7 - 36.4% $405,000 $438,000 + 8.1% 39 83 + 114.6% 28 11 - 60.7% Foxborough 1 2 + 100.0% $350,000 $315,000 - 10.0% 78 33 - 58.3% 5 3 - 40.0% Framingham 7 3 - 57.1% $331,000 $352,500 + 6.5% 55 16 - 70.3% 10 8 - 20.0% Franklin 0 0 -- $0 $0 -- 0 0 -- 2 2 0.0% Holliston 0 0 -- $0 $0 -- 0 0 -- 1 1 0.0% Hopkinton 1 0 - 100.0% $323,500 $0 - 100.0% 39 0 - 100.0% 0 0 -- Hudson 1 0 - 100.0% $110,005 $0 - 100.0% 14 0 - 100.0% 6 0 - 100.0% Lexington 0 1 -- $0 $706,000 -- 0 9 -- 1 0 - 100.0% Lincoln 0 0 -- $0 $0 -- 0 0 -- 0 0 -- Malden 6 9 + 50.0% $453,500 $515,000 + 13.6% 41 18 - 56.9% 27 21 - 22.2% Mansfield 0 1 -- $0 $405,000 -- 0 23 -- 2 1 - 50.0% Marlborough 1 2 + 100.0% $199,900 $265,000 + 32.6% 2 121 + 5,950.0% 6 6 0.0% Maynard 1 1 0.0% $335,000 $180,000 - 46.3% 40 1 - 97.5% 3 2 - 33.3% Medfield 0 0 -- $0 $0 -- 0 0 -- 0 0 -- Medford 16 6 - 62.5% $580,250 $605,000 + 4.3% 28 19 - 29.9% 9 8 - 11.1% Medway 0 0 -- $0 $0 -- 0 0 -- 3 2 - 33.3% Milford 0 2 -- $0 $237,500 -- 0 39 -- 4 9 + 125.0% Millis 0 0 -- $0 $0 -- 0 0 -- 0 1 -- Milton 1 0 - 100.0% $515,000 $0 - 100.0% 16 0 - 100.0% 4 3 - 25.0% Natick 2 3 + 50.0% $546,500 $365,000 - 33.2% 57 28 - 50.4% 2 2 0.0% Needham 0 0 -- $0 $0 -- 0 0 -- 1 2 + 100.0% June 2015 InventoryClosed Sales Days on MarketMedian Sales Price All data from MLS Property Information Network, Inc. Provided by Greater Boston Association of REALTORS®. Powered by 10K Research and Marketing.
- 3. Multi-Family Housing Activity Report – 2-Family Properties (cont.) 6-2014 6-2015 + / – 6-2014 6-2015 + / – 6-2014 6-2015 + / – 6-2014 6-2015 + / – Newton 10 7 - 30.0% $796,500 $845,000 + 6.1% 9 61 + 548.9% 16 15 - 6.3% Norfolk 0 1 -- $0 $356,000 -- 0 53 -- 1 1 0.0% North Attleboro 1 1 0.0% $280,000 $234,500 - 16.3% 73 5 - 93.2% 9 5 - 44.4% Norwood 2 1 - 50.0% $395,000 $388,050 - 1.8% 54 22 - 59.3% 5 6 + 20.0% Plainville 0 0 -- $0 $0 -- 0 0 -- 4 2 - 50.0% Quincy 4 15 + 275.0% $593,500 $490,000 - 17.4% 45 53 + 18.4% 32 19 - 40.6% Randolph 0 1 -- $0 $375,000 -- 0 0 -- 9 0 - 100.0% Revere 6 10 + 66.7% $402,500 $441,000 + 9.6% 38 68 + 78.4% 42 12 - 71.4% Saugus 1 2 + 100.0% $385,000 $455,500 + 18.3% 53 71 + 33.0% 1 3 + 200.0% Sharon 0 0 -- $0 $0 -- 0 0 -- 0 3 -- Sherborn 0 0 -- $0 $0 -- 0 0 -- 0 0 -- Somerville 12 11 - 8.3% $750,056 $895,500 + 19.4% 30 49 + 62.6% 16 15 - 6.3% Southborough 1 1 0.0% $399,900 $334,000 - 16.5% 15 30 + 100.0% 3 0 - 100.0% Stoughton 1 0 - 100.0% $259,900 $0 - 100.0% 96 0 - 100.0% 2 1 - 50.0% Stow 1 1 0.0% $468,000 $240,000 - 48.7% 60 44 - 26.7% 1 0 - 100.0% Sudbury 0 0 -- $0 $0 -- 0 0 -- 0 1 -- Walpole 2 1 - 50.0% $386,500 $400,000 + 3.5% 23 163 + 624.4% 1 0 - 100.0% Waltham 3 8 + 166.7% $475,000 $554,950 + 16.8% 31 23 - 25.4% 7 5 - 28.6% Watertown 9 3 - 66.7% $630,000 $810,000 + 28.6% 16 31 + 89.8% 11 6 - 45.5% Wayland 0 0 -- $0 $0 -- 0 0 -- 0 0 -- Wellesley 1 0 - 100.0% $764,000 $0 - 100.0% 17 0 - 100.0% 0 2 -- Weston 0 0 -- $0 $0 -- 0 0 -- 1 1 0.0% Westwood 0 0 -- $0 $0 -- 0 0 -- 0 0 -- Winchester 1 0 - 100.0% $679,900 $0 - 100.0% 25 0 - 100.0% 3 1 - 66.7% Winthrop 3 5 + 66.7% $450,000 $435,000 - 3.3% 47 70 + 48.9% 8 9 + 12.5% Woburn 0 6 -- $0 $496,250 -- 0 146 -- 5 3 - 40.0% Wrentham 1 0 - 100.0% $405,000 $0 - 100.0% 64 0 - 100.0% 0 2 -- Greater Boston 158 170 +7.6% $486,000 $522,500 +7.5% 35 46 +31.8% 478 313 -34.5% Note: The "Greater Boston" figures are not a compilation or total of the individual areas. Days on Market Inventory June 2015 Closed Sales Median Sales Price All data from MLS Property Information Network, Inc. Provided by Greater Boston Association of REALTORS®. Powered by 10K Research and Marketing.
- 4. Multi-Family Housing Activity Report – 3-Family Properties 6-2014 6-2015 + / – 6-2014 6-2015 + / – 6-2014 6-2015 + / – 6-2014 6-2015 + / – Acton 0 0 -- $0 $0 -- 0 0 -- 0 0 -- Arlington 1 0 - 100.0% $757,000 $0 - 100.0% 4 0 - 100.0% 1 0 - 100.0% Ashland 0 0 -- $0 $0 -- 0 0 -- 2 1 - 50.0% Attleboro 2 3 + 50.0% $137,500 $195,000 + 41.8% 92 148 + 60.5% 6 9 + 50.0% Avon 0 0 -- $0 $0 -- 0 0 -- 0 0 -- Bedford 0 0 -- $0 $0 -- 0 0 -- 0 0 -- Bellingham 0 0 -- $0 $0 -- 0 0 -- 2 1 - 50.0% Belmont 0 0 -- $0 $0 -- 0 0 -- 0 0 -- Boston 36 41 + 13.9% $499,950 $590,000 + 18.0% 59 33 - 43.4% 92 64 - 30.4% Boxborough 0 0 -- $0 $0 -- 0 0 -- 0 0 -- Brookline 1 0 - 100.0% $1,800,000 $0 - 100.0% 9 0 - 100.0% 1 2 + 100.0% Burlington 0 0 -- $0 $0 -- 0 0 -- 0 0 -- Cambridge 1 2 + 100.0% $1,700,000 $1,550,000 - 8.8% 8 17 + 106.3% 6 7 + 16.7% Canton 0 0 -- $0 $0 -- 0 0 -- 1 2 + 100.0% Carlisle 0 0 -- $0 $0 -- 0 0 -- 0 0 -- Chelsea 2 1 - 50.0% $468,000 $570,000 + 21.8% 38 32 - 15.8% 9 11 + 22.2% Concord 0 0 -- $0 $0 -- 0 0 -- 0 0 -- Dedham 0 0 -- $0 $0 -- 0 0 -- 1 0 - 100.0% Dover 0 0 -- $0 $0 -- 0 0 -- 0 0 -- Everett 2 1 - 50.0% $507,500 $421,000 - 17.0% 21 43 + 104.8% 10 8 - 20.0% Foxborough 0 0 -- $0 $0 -- 0 0 -- 1 0 - 100.0% Framingham 1 1 0.0% $390,000 $469,900 + 20.5% 6 139 + 2,216.7% 2 1 - 50.0% Franklin 0 1 -- $0 $400,000 -- 0 4 -- 2 3 + 50.0% Holliston 0 0 -- $0 $0 -- 0 0 -- 0 0 -- Hopkinton 0 0 -- $0 $0 -- 0 0 -- 0 0 -- Hudson 0 0 -- $0 $0 -- 0 0 -- 2 1 - 50.0% Lexington 0 0 -- $0 $0 -- 0 0 -- 0 0 -- Lincoln 0 0 -- $0 $0 -- 0 0 -- 0 0 -- Malden 3 1 - 66.7% $610,000 $445,000 - 27.0% 53 68 + 27.5% 7 5 - 28.6% Mansfield 0 1 -- $0 $411,000 -- 0 6 -- 0 0 -- Marlborough 0 0 -- $0 $0 -- 0 0 -- 4 1 - 75.0% Maynard 0 0 -- $0 $0 -- 0 0 -- 0 0 -- Medfield 0 0 -- $0 $0 -- 0 0 -- 0 0 -- Medford 3 1 - 66.7% $765,000 $775,000 + 1.3% 7 47 + 540.9% 3 0 - 100.0% Medway 0 0 -- $0 $0 -- 0 0 -- 0 0 -- Milford 0 2 -- $0 $258,500 -- 0 44 -- 2 0 - 100.0% Millis 0 1 -- $0 $390,000 -- 0 42 -- 0 0 -- Milton 0 0 -- $0 $0 -- 0 0 -- 0 1 -- Natick 0 0 -- $0 $0 -- 0 0 -- 0 1 -- Needham 0 0 -- $0 $0 -- 0 0 -- 0 0 -- June 2015 Closed Sales Median Sales Price Days on Market Inventory All data from MLS Property Information Network, Inc. Provided by Greater Boston Association of REALTORS®. Powered by 10K Research and Marketing.
- 5. Multi-Family Housing Activity Report – 3-Family Properties (cont.) 6-2014 6-2015 + / – 6-2014 6-2015 + / – 6-2014 6-2015 + / – 6-2014 6-2015 + / – Newton 0 1 -- $0 $1,415,000 -- 0 2 -- 0 0 -- Norfolk 0 0 -- $0 $0 -- 0 0 -- 1 1 0.0% North Attleboro 1 0 - 100.0% $385,000 $0 - 100.0% 30 0 - 100.0% 10 5 - 50.0% Norwood 1 0 - 100.0% $402,000 $0 - 100.0% 89 0 - 100.0% 2 0 - 100.0% Plainville 0 0 -- $0 $0 -- 0 0 -- 1 1 0.0% Quincy 0 0 -- $0 $0 -- 0 0 -- 5 7 + 40.0% Randolph 0 0 -- $0 $0 -- 0 0 -- 0 0 -- Revere 1 3 + 200.0% $625,000 $492,500 - 21.2% 0 60 -- 3 6 + 100.0% Saugus 0 0 -- $0 $0 -- 0 0 -- 0 2 -- Sharon 0 0 -- $0 $0 -- 0 0 -- 0 0 -- Sherborn 0 0 -- $0 $0 -- 0 0 -- 0 0 -- Somerville 4 6 + 50.0% $1,225,000 $818,500 - 33.2% 35 31 - 10.5% 10 8 - 20.0% Southborough 0 0 -- $0 $0 -- 0 0 -- 0 0 -- Stoughton 0 0 -- $0 $0 -- 0 0 -- 0 0 -- Stow 0 0 -- $0 $0 -- 0 0 -- 0 0 -- Sudbury 0 0 -- $0 $0 -- 0 0 -- 0 0 -- Walpole 0 1 -- $0 $372,000 -- 0 29 -- 0 0 -- Waltham 2 1 - 50.0% $587,500 $1,600,000 + 172.3% 5 137 + 2640.0% 2 0 - 100.0% Watertown 2 1 - 50.0% $760,000 $852,225 + 12.1% 38 10 - 73.3% 4 2 - 50.0% Wayland 1 0 - 100.0% $633,500 $0 - 100.0% 11 0 - 100.0% 0 0 -- Wellesley 0 0 -- $0 $0 -- 0 0 -- 1 0 - 100.0% Weston 0 0 -- $0 $0 -- 0 0 -- 0 0 -- Westwood 0 0 -- $0 $0 -- 0 0 -- 0 0 -- Winchester 0 0 -- $0 $0 -- 0 0 -- 0 0 -- Winthrop 0 1 -- $0 $525,000 -- 0 131 -- 2 0 - 100.0% Woburn 1 0 - 100.0% $585,000 $0 - 100.0% 63 0 - 100.0% 1 2 + 100.0% Wrentham 0 0 -- $0 $0 -- 0 0 -- 0 0 -- Greater Boston 65 70 +7.7% $555,000 $575,000 +3.6% 47 43 -8.8% 196 152 -22.4% Note: The "Greater Boston" figures are not a compilation or total of the individual areas. Closed Sales Median Sales Price Days on Market Inventory June 2015 All data from MLS Property Information Network, Inc. Provided by Greater Boston Association of REALTORS®. Powered by 10K Research and Marketing.
- 6. Multi-Family Housing Activity Report – 4-Family Properties 6-2014 6-2015 + / – 6-2014 6-2015 + / – 6-2014 6-2015 + / – 6-2014 6-2015 + / – Acton 0 0 -- $0 $0 -- 0 0 -- 0 0 -- Arlington 0 0 -- $0 $0 -- 0 0 -- 0 0 -- Ashland 0 0 -- $0 $0 -- 0 0 -- 1 0 - 100.0% Attleboro 0 0 -- $0 $0 -- 0 0 -- 3 1 - 66.7% Avon 0 0 -- $0 $0 -- 0 0 -- 0 0 -- Bedford 0 0 -- $0 $0 -- 0 0 -- 0 0 -- Bellingham 0 0 -- $0 $0 -- 0 0 -- 0 0 -- Belmont 0 0 -- $0 $0 -- 0 0 -- 0 0 -- Boston 2 2 0.0% $2,087,500 $597,500 - 71.4% 95 47 - 50.5% 4 9 + 125.0% Boxborough 0 0 -- $0 $0 -- 0 0 -- 0 0 -- Brookline 0 0 -- $0 $0 -- 0 0 -- 1 0 - 100.0% Burlington 0 0 -- $0 $0 -- 0 0 -- 0 0 -- Cambridge 0 0 -- $0 $0 -- 0 0 -- 1 1 0.0% Canton 0 0 -- $0 $0 -- 0 0 -- 0 0 -- Carlisle 0 0 -- $0 $0 -- 0 0 -- 0 0 -- Chelsea 1 0 - 100.0% $445,000 $0 - 100.0% 14 0 - 100.0% 3 2 - 33.3% Concord 0 0 -- $0 $0 -- 0 0 -- 0 0 -- Dedham 0 0 -- $0 $0 -- 0 0 -- 0 0 -- Dover 0 0 -- $0 $0 -- 0 0 -- 0 0 -- Everett 0 1 -- $0 $600,000 -- 0 9 -- 1 1 0.0% Foxborough 0 0 -- $0 $0 -- 0 0 -- 0 0 -- Framingham 0 1 -- $0 $394,000 -- 0 115 -- 0 1 -- Franklin 1 0 - 100.0% $350,500 $0 - 100.0% 72 0 - 100.0% 0 0 -- Holliston 0 0 -- $0 $0 -- 0 0 -- 0 0 -- Hopkinton 0 0 -- $0 $0 -- 0 0 -- 0 0 -- Hudson 0 0 -- $0 $0 -- 0 0 -- 0 0 -- Lexington 0 0 -- $0 $0 -- 0 0 -- 0 0 -- Lincoln 0 0 -- $0 $0 -- 0 0 -- 0 0 -- Malden 0 0 -- $0 $0 -- 0 0 -- 2 0 - 100.0% Mansfield 0 0 -- $0 $0 -- 0 0 -- 0 0 -- Marlborough 0 1 -- $0 $429,000 -- 0 3 -- 0 0 -- Maynard 0 0 -- $0 $0 -- 0 0 -- 0 0 -- Medfield 0 0 -- $0 $0 -- 0 0 -- 1 0 - 100.0% Medford 0 0 -- $0 $0 -- 0 0 -- 1 0 - 100.0% Medway 0 0 -- $0 $0 -- 0 0 -- 0 0 -- Milford 0 0 -- $0 $0 -- 0 0 -- 2 0 - 100.0% Millis 0 0 -- $0 $0 -- 0 0 -- 0 0 -- Milton 0 0 -- $0 $0 -- 0 0 -- 0 0 -- Natick 0 0 -- $0 $0 -- 0 0 -- 0 0 -- Needham 0 0 -- $0 $0 -- 0 0 -- 0 0 -- June 2015 Closed Sales Median Sales Price Days on Market Inventory All data from MLS Property Information Network, Inc. Provided by Greater Boston Association of REALTORS®. Powered by 10K Research and Marketing.
- 7. Multi-Family Housing Activity Report – 4-Family Properties (cont.) 6-2014 6-2015 + / – 6-2014 6-2015 + / – 6-2014 6-2015 + / – 6-2014 6-2015 + / – Newton 0 0 -- $0 $0 -- 0 0 -- 0 0 -- Norfolk 0 0 -- $0 $0 -- 0 0 -- 0 0 -- North Attleboro 1 0 - 100.0% $408,000 $0 - 100.0% 54 0 - 100.0% 1 1 0.0% Norwood 0 0 -- $0 $0 -- 0 0 -- 0 0 -- Plainville 0 0 -- $0 $0 -- 0 0 -- 0 0 -- Quincy 0 2 -- $0 $717,500 -- 0 25 -- 2 3 + 50.0% Randolph 1 0 - 100.0% $462,000 $0 - 100.0% 0 0 -- 0 1 -- Revere 0 1 -- $0 $406,400 -- 0 183 -- 1 0 - 100.0% Saugus 0 0 -- $0 $0 -- 0 0 -- 0 0 -- Sharon 0 0 -- $0 $0 -- 0 0 -- 0 0 -- Sherborn 0 0 -- $0 $0 -- 0 0 -- 0 0 -- Somerville 0 0 -- $0 $0 -- 0 0 -- 2 1 - 50.0% Southborough 0 0 -- $0 $0 -- 0 0 -- 0 0 -- Stoughton 1 0 - 100.0% $458,500 $0 - 100.0% 85 0 - 100.0% 0 1 -- Stow 0 0 -- $0 $0 -- 0 0 -- 0 0 -- Sudbury 0 0 -- $0 $0 -- 0 0 -- 0 0 -- Walpole 0 0 -- $0 $0 -- 0 0 -- 0 0 -- Waltham 0 0 -- $0 $0 -- 0 0 -- 1 1 0.0% Watertown 0 0 -- $0 $0 -- 0 0 -- 1 0 - 100.0% Wayland 0 0 -- $0 $0 -- 0 0 -- 0 0 -- Wellesley 0 0 -- $0 $0 -- 0 0 -- 0 0 -- Weston 0 0 -- $0 $0 -- 0 0 -- 0 0 -- Westwood 0 0 -- $0 $0 -- 0 0 -- 0 0 -- Winchester 0 0 -- $0 $0 -- 0 0 -- 0 0 -- Winthrop 0 0 -- $0 $0 -- 0 0 -- 0 3 -- Woburn 1 0 - 100.0% $530,000 $0 - 100.0% 3 0 - 100.0% 0 1 -- Wrentham 0 0 -- $0 $0 -- 0 0 -- 0 0 -- Greater Boston 8 8 0.0% $460,250 $514,500 +11.8% 60 57 -5.2% 28 27 -3.6% Note: The "Greater Boston" figures are not a compilation or total of the individual areas. Closed Sales Median Sales Price Days on Market Inventory June 2015 All data from MLS Property Information Network, Inc. Provided by Greater Boston Association of REALTORS®. Powered by 10K Research and Marketing.