Beginners Guide to TikTok for Search - Rachel Pearson - We are Tilt __ Bright...
OpsReportingNewsletter Pigging Dashboard
1. Issue 72 – January 2015 Monthly Newsletter Printable Version
Links
• Wh
at is Ops
Reporting?
• Wo
rkflow Portal
• Fiel
d Data
Management
• Op
erations
Excellence
• Us
age Metrics
• FD
M Help
Numbers
The FDM Operations Reporting team’s monthly communication provides you with summary news, upcoming activities, work in
progress and continuous improvements.
Safety Moment: “Body Care at Work” -- Did you know that sitting has joined smoking and obesity as an important risk factor for chronic
disease? Take a safety moment to review workplace safety for your body – posture, ergonomics and exercises that can protect you from
injury and sedentary disease.
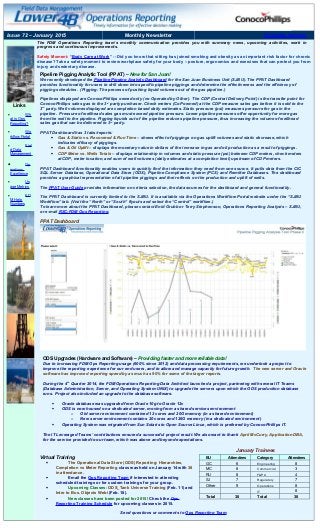
Pipeline Pigging Analytic Tool (PPAT) – New for San Juan!
We recently developed the Pipeline Pigging Analytic Dashboard for the San Juan Business Unit (SJBU). The PPAT Dashboard
provides functionality for users to drill down into specific pipeline piggings and determine the effectiveness and the efficiency of
pigging schedules. (Pigging: The process of pushing liquid volumes out of the gas pipeline.)
Pipelines displayed are ConocoPhillips owned only (no Operated by Other). The CDP (Central Delivery Point) is the transfer point for
ConocoPhillips sales gas to the 3rd
party purchaser. Check meters (CoP owned) at the CDP measure sales gas before it is sold to the
3rd
party. Well volumes displayed are completion based daily estimates. Static pressure (psi) measures pressure for gas in the
pipeline. Pressure of wellhead sales gas must exceed pipeline pressure. Lower pipeline pressures offer opportunity for more gas
from the well to the pipeline. Pigging liquids out of the pipeline reduces pipeline pressure, thus increasing the volume of wellhead
sales gas that can be delivered to 3rd
party.
PPAT Dashboard has 3 tabs/reports:
• Gas & Static vs. Recovered & Run Time – shows effect of piggings on gas uplift volumes and static decrease, which
indicates efficacy of piggings.
• Gas & Oil Uplift – displays the monetary value in dollars of the increase in gas and oil production as a result of piggings.
• CDP Meter vs. Wells Totals – displays relationship in volumes and static pressure (psi) between CDP meters, check meters
at CDP, meter location, and sum of well volumes (daily estimates at a completion level) upstream of CDP meters.
PPAT Dashboard functionality enables users to quickly find the information they need from one source. It pulls data from the CIC
SQL Server Database, Operational Data Store (ODS), Pipeline Compliance System (PCS) and Remitter Databases. The dashboard
provides a graphical representation of all pipeline piggings and their effects on the production and uplift of wells.
The PPAT User Guide provides information on criteria selection, the data sources for the dashboard and general functionality.
The PPAT Dashboard is currently limited to the SJBU. It is available via the Operations Workflow Portal website under the “SJBU
Workflow” tab. (Visit the “North” or “South” flyouts and select the “Control” workflow.)
To learn more about the PPAT Dashboard, please contact Enid Grubb or Terry Stephenson, Operations Reporting Analysts – SJBU,
or e-mail RSC:FDM Ops Reporting.
PPAT Dashboard
ODS Upgrades (Hardware and Software) – Providing faster and more reliable data!
Due to increasing FDM Ops Reporting usage (600% since 2012) and data processing requirements, we undertook a project to
improve the reporting experience for our end users, and to allow and manage capacity for future growth. The new server and Oracle
software has improved reporting speed by as much as 90% for some of the larger reports.
During the 4th
Quarter 2014, the FDM Operations Reporting Data Architect launched a project, partnering with several IT Teams
(Database Administration, Server, and Operating System-UNIX) to upgrade the servers upon which the ODS production database
runs. Project also included an upgrade to the database software.
• Oracle database was upgraded from Oracle 10g to Oracle 12c
• ODS is now housed on a dedicated server, moving from a shared services environment
o Old server environment contained 12 cores and 20G memory (in a shared environment)
o New server environment contains 20 cores and 126G memory (in a dedicated environment)
• Operating System was migrated from Sun Solaris to Open Source Linux, which is preferred by ConocoPhillips IT.
The IT Leveraged Teams’ contributions ensured a successful project result. We also want to thank April McCurry, Application DBA,
for the service provided to our team, which was above and beyond expectations.
January Trainees
Virtual Training
• The Operational Data Store (ODS) Reporting: Hierarchies,
Completion vs Meter Reporting class was held on January 14 with 38
in attendance.
• Email the Ops Reporting Team if interested in attending
scheduled trainings or for custom trainings for your group.
• Upcoming Classes: ODS_Tank Universe Training (Feb. 11) and
Intro to Bus. Objects Webi (Feb. 18).
• New classes have been posted for 2015! Check the Ops
Reporting Training Schedule for upcoming classes in 2015.
BU Attendees Category Attendees
GC 6 Engineering 8
MC 8 Commercial 3
RU 8 F&PA 4
SJ 7 Regulatory 7
Other 9 Operations 8
IT 8
Total 38 Total 38
Send questions or comments to Ops Reporting Team.
2. Subscribe to or Unsubscribe from the monthly e-mail distribution of this newsletter