Federal debt vs-taxes
•
0 likes•148 views

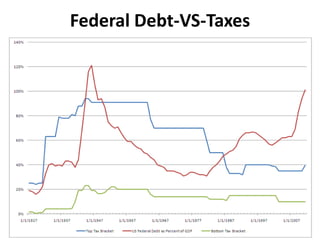
This a graph showing Federal debt, as well as top time and lower line income taxes from 1927 to 2007 as compared to GDP on the vertical graph. This is not the fanciest graph I have ever seen, but it does the best job of communicating the ebb and flow of taxes and spending over eighty years. It is great for a reference when some feels that the top two percent are being over taxed, just download and show them this graph. Note in 2007 how the debt spiked on the heels of two unbudgeted wars and tax cuts. This is not meant to be political, but factual. Enjoy!