Implementing a closed loop pricing system

Companies are facing increasing headwinds when implementing pricing strategies on a global basis. Whether you are using cost plus, competitive or value based pricing strategies, it is imperative to quantify what is happening to your price actions throughout the cash cycle. In this webinar we will track the pricing process from strategy, forecasting, transactional analysis & price realization, to using key performance indicator dashboards and then linking the results to financial and P&L statements. We propose establishing P&L pricing scenarios ahead of time, set the KPI objectives, monitor and measure the results and then make periodic course corrections as required, responding to market & competitive conditions. We will look “under the hood”, using a case history, with the objective of reducing complexity and to improve process understanding. Overall, closing the pricing loop is scalable, spreadsheet tools for smaller companies and powerful analytic pricing software with enabling technology for larger companies, where there are larger numbers of SKU's, locations and shared users.

Recommended
Recommended
More Related Content
Recently uploaded
Recently uploaded (20)
Featured
Featured (20)
Implementing a closed loop pricing system
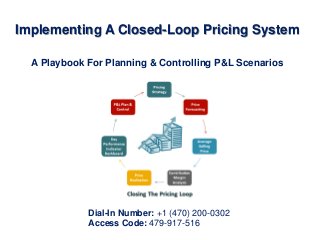
- 1. Implementing A Closed-Loop Pricing System A Playbook For Planning & Controlling P&L Scenarios Dial-In Number: +1 (470) 200-0302 Access Code: 479-917-516
- 2. Implementing A Closed-Loop Pricing System A Playbook For Planning & Controlling P&L Scenarios Dick Sobel, Managing Director The Pricing Analytic Group www.pricing-analytic.com
- 3. Before We Begin If you have any questions throughout today’s presentation, please submit them through the Questions Section of the Go-ToMeeting Control Panel. You may also email questions to, webinars@zilliant.com. Follow us @Zilliant Join the discussion on Twitter: #CLPricing 3
- 4. Today’s Speaker Richard Sobel Managing Director The Pricing Analytic Group With 17 years of direct pricing experience, Dick offers expertise in pricing analytics, optimization, realization and strategy. He has directed Stage-Gate® new-product development programs, value based and conjoint pricing engagements and has developed closed-loop pricing strategies incorporating planning and controlling P&L scenarios. Dick’s distinguished career at Emerson Process Management, a business unit of Emerson, included senior leadership positions in pricing, global marketing, S&OP facilitation, product marketing, finance and cross-functional efforts. He was an early proponent of pricing strategy within the Emerson group of companies, where he developed, presented and implemented three- to five-year pricing plans that achieved significant price realization and profit improvement. 4
- 5. Implementing A Closed-Loop Pricing System A Playbook For Planning & Controlling P&L Scenarios
- 6. Starts With Connecting Price Actions To The P&L P&L Pyramid P&L Price Impact On Operating Profit • Model P&L Scenarios • Management Information Reporting Financial Statements KPI Contribution Margin Price Realization Material Cost Changes Volume & Mix Changes Pareto Analysis Transactions Forecasting Price Actions Linking Results To Financials • Monitor Performance • Create & Update Plans Data Analysis • Quantitative & Qualitative • Pricing Tools Making Sense Of The Data • Organize & Quantify • Segmentation What Is Going On? • Pricing Strategy in Use • Price Audit 6
- 7. And Then Linking Results To How A Company Financially Accounts For Its Business • P&L Scenarios • Spreadsheet Tools • Analytic Pricing Software • Transactional Analysis • Limit Of Authority Key Performance Indicators Data Analysis Financial Statements & P&L • Financial Statements • P&L • Contribution Margin • Price Realization • Key Performance Dashboard Qurter Ending: Percent Gross June 2012 Margin Direct Distributor Percent Discount Percent Price from List Realization Percent change in List Price Price Realization Dollars ($000) +0.3% (2.0%) Subsidiary ($2) New Products 7
- 8. That Promotes Planning & Predicting P&L Scenarios Not All SKU’s Get Increases Planned Aggregate Increase Percent Realized Profit Improvement ($000) Percent OP Profit Gain 2% 1.4 % $1,450 14.5% 3% 1.9% $1,900 19.0% 4% 2.4 % $2,400 24.0% For each $100MM Sales @ 10% OP • • • Ensuring Planned Increases - Get Price Gain Linking Key Performance Indicators To Price Plan Implementing Mid-Course Corrections As Market & Competitive Conditions Change 8
- 9. And Tying Pricing Strategy To Closed-Loop Control P&L Scenarios 9
- 10. What Are The Playbook Objectives? 1. Building transactional databases and developing price forecasting models 2. Recognizing and acting upon the factors that determine average selling price 3. Performing SKU contribution margin analysis for price realization, cost reduction and changes due to volume & mix 4. Utilizing Key Performance Indicator dashboards to forecast, measure and monitor profitability drivers 5. Linking the pricing process to the P&L and closing the pricing loop 10
- 11. Start By Developing A Price Realization Forecast Price Forecasting History Inputs Forecast • Product SKU • Sales & Units • Average Discount From List • % Gross Margin • Average Selling Price • % List Price Change • Proposed Discount From List • Material Cost Changes • $ Price Realization • % Price Realization • Cost Reduction • % Gross Margin • Volume Building Transactional Databases And Developing Price Forecasting Models 11
- 12. Then Maximizing The Average Selling Price Price Setting List Price Management Pricing Leaks Transactional Discounting Waterfall Pricing Tools Average Selling Price Market Segmentation Product - Feature Mix Average Selling Price Pareto Analysis Contribution Margin Price Realization Limit of Authority Channel Mix Recognizing And Acting Upon The Factors That Determine Average Selling Price 12
- 13. Limiting Uncontrolled Discounting Limit of Authority Transactional Discounting [Average Discount From List] 45 100% 40 30 60% 25 20 40% 15 50% 45% 40% 35% 30% 25% 20% 10% 5 0 10 0 Cumulative % 80% 35 20% 0% % Discount from List 13 Recognizing And Acting Upon The Factors That Determine Average Selling Price
- 14. Ensuring Pricing Leaks Are Plugged Transactional Discounting Waterfall Source: McKinsey & Company Recognizing And Acting Upon The Factors That Determine Average Selling Price 14
- 15. Optimizing Market Segments With Pricing Bands ASP = 100 130 120 110 100 90 80 70 60 Sales Market Segmentation $30M $20M $10M $0M ASP Price Band Heavy Industry Light Industry • • • • Academic Projects Government OEM Institutional ASP Varies By Segment Versioning To Markets Market Segmentation Impacts Margin Tightening Price Band 15
- 16. Case History Industrial Automation Manufacturer Pruning Legacy Products With List Price Increases Of From 3- 7% • • Segment By Sales Channel Consolidate & Tabulate SKUs For A Comparable Time Frame • Prioritize & Rank • Check For Price Sensitivity & Elasticity 16
- 17. Case History Continued Contribution Margin Analysis – Product Pruning Products A B C D E F G H I J Totals • • Previous Year $GM ($000) Price Material Cost Volume Mix Current Year $GM $705 $424 $315 $356 $797 $463 $510 $94 $275 $26 $141 $57 $55 $36 $63 -$17 $49 $81 $5 -$2 $1 $3 $24 -$14 $8 $5 $6 $3 $1 $1 -$110 $47 -$123 $36 -$315 -$198 -$222 -$50 -$257 $9 $735 $525 $223 $442 $536 $243 $331 $123 $22 $32 $3,966 40.2% $468 $39 -$1,184 $3,211 43.1% SKU Contribution Margin Analysis Calculates Price Realization $468K Price Flows To Financial Statement 17
- 18. Case History Continued Bridging Changes In Gross Margin Overall GM % PT Impact With Sales Volume Reduction Percent Gross Profit 44 0.6% 43 42 -0.4% 1% Pt. = $98K 2.7% 41 40 39 40.2% 1% Pt. = $173K Change In Gross Margin Percentage 43.1% 38 Sales ($000) $9,860 Gross Margin ($000) $3,966 $7,454 $468 + ($1184) + $39 - = $3,211 Change in Gross Margin Dollars 18
- 19. Key Performance Indicator (KPI) Dashboard Stakeholder Measuring, Controlling & Monitoring Pricing Actions Performance v. Objective: Key Performance Indicator Dashboard • Forecast • Data Analysis Qurter Ending: Percent Gross June 2012 Margin Percent Discount Percent Price from List Realization Percent change in List Price Price Realization Dollars ($000) • Results • Financial Statements +0.3% Direct Distributor (2.0%) Subsidiary ($2) New Products Stakeholders • • • • Ensuring Planned Increases Get Price Gain Linking Key Performance Indicators To Price Plan Quantitative Improvements Flow To The P&L Implementing Course Corrections As Market & Competitive Conditions Change 19
- 20. Summary: Plan & Control Your Pricing Actions… P&L Includes A Price Entry Tied To Planning Model Qurter Ending: Percent Gross June 2012 Margin Direct Distributor Percent Discount Percent Price from List Realization Percent change in List Price Price Realization Dollars ($000) +0.3% (2.0%) Subsidiary ($2) New Products Linking Pricing Process To The P&L And Closing The Pricing Loop – Plan & Control 20
- 22. The Pricing Analytic Group The Pricing Analytic Group is led by Dick Sobel, Managing Director. He is a partner with the Strategic Pricing Management Group (SPMG) and a consultant for PricePoint Partners, providing pricing analytics, training, strategy, optimization, and realization consulting services to B2B clients achieving profitable growth. Our pricing consultants provide analytic tools and evaluate price momentum throughout the cash cycle. We improve pricing for incumbent and new products with: • Value based pricing & selling principles • Pricing audits • Developing effective pricing strategies Dick Sobel, Managing Director The Pricing Analytic Group Email: info@pricing-analytic.com Phone: 330-958-4036 22
- 23. Zilliant provides B2B companies with data-driven guidance, enabling smarter pricing and sales decisions to help businesses make their numbers. The Zilliant optimization platform uses advanced science in its price optimization applications to enable companies to overcome the massive complexity in their businesses. Our flexible SaaS model allows customers to quickly and confidently improve their financial performance by integrating into existing systems and processes. Learn more about how Zilliant helps companies price more profitably and sell more effectively at www.zilliant.com. Phone: 512.531.8503 Email: _mdr@zilliant.com Contact Us Today to Learn How We Help Companies Price More Profitably. 23