Crested Butte Real Estate Market Report YTD May 2015
•
1 like•259 views

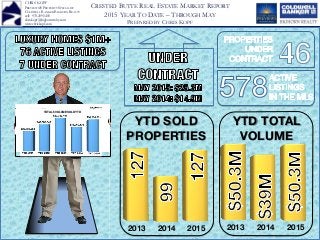
Comparing the YTD results in 2015 we see that Total Number of Properties Sold is up 28% over last year, Total Volume is up 21%. There has been a run at the low-end of the market and a huge increase in lot sales (predominantly less than ½ acre lots in developed subdivisions) – also representing the lower end of the land offerings as buyers put a stake in the ground with anticipation of building their home in the near future. The belief is that the majority of this activity is lead by locals who are seeing inventories of homes below $600,000 vanishing.

Recommended
Recommended
More Related Content
Recently uploaded
Recently uploaded (20)
Featured
Featured (20)
Crested Butte Real Estate Market Report YTD May 2015
- 1. Sales Volume numbers represent all Single Family Homes, Condos, Townhomes and Land sales in the North End of the Gunnison Valley, including Almont, CB South, Rural Crested Butte, Crested Butte, Mt. Crested Butte and Rural Mt. Crested Butte as shown in the Gunnison Country Association of Realtors MLS. Information contained herein deemed reliable, but not guaranteed. CHRIS KOPF PREVIEWS® PROPERTY SPECIALIST COLDWELL BANKER BIGHORN REALTY cell: 970.209.5405 chriskopf@bighornrealty.com www.chriskopf.com CRESTED BUTTE REAL ESTATE MARKET REPORT 2015 YEAR TO DATE – THROUGH MAY PREPARED BY CHRIS KOPF YTD SOLD PROPERTIES 2013 2014 2015 2013 2014 2015 CONDO & TOWN HOME MEDIAN SALES PRICE YTD TOTAL VOLUME TOTAL $ VOLUME SOLD YTD
- 2. Sales Volume numbers represent all Single Family Homes, Condos, Townhomes and Land sales in the North End of the Gunnison Valley, including Almont, CB South, Rural Crested Butte, Crested Butte, Mt. Crested Butte and Rural Mt. Crested Butte as shown in the Gunnison Country Association of Realtors MLS. Information contained herein deemed reliable, but not guaranteed. CHRIS KOPF PREVIEWS® PROPERTY SPECIALIST COLDWELL BANKER BIGHORN REALTY cell: 970.209.5405 chriskopf@bighornrealty.com www.chriskopf.com CRESTED BUTTE REAL ESTATE MARKET REPORT 2015 YEAR TO DATE – THROUGH MAY PREPARED BY CHRIS KOPF Crested Butte Real Estate Market Report – Year to Date through May 31, 2015 The Crested Butte Real Estate Market is Active poised for Summer As the charts and numbers show the Year to Date (YTD) trends in the Crested Butte Real Estate market up year over year and nearly identical to the results in 2013 YTD. There is a buzz in the air as many anticipate another strong Summer season for visitors in town and real estate transactions that will follow. Comparing the YTD results in 2015 we see that Total Number of Properties Sold is up 28% over last year, Total Volume is up 21%. There has been a run at the low-end of the market and a huge increase in lot sales (predominantly less than ½ acre lots in developed subdivisions) – also representing the lower end of the land offerings as buyers put a stake in the ground with anticipation of building their home in the near future. The belief is that the majority of this activity is lead by locals who are seeing inventories of homes below $600,000 vanishing. There is a lack of long-term rentals – either due to conversion to short-term rentals or more renters (nobody knows), but a good problem to have. Gone are the stories of families forced to leave the valley due to foreclosures and a lack of work. For an economy built on tourism, and real estate construction/property management – these are healthy times for the Crested Butte Community. YTD Total $ Volume of Properties Sold YTD Total Number of Properties Sold Month 2011 2012 2013 2014 2015 JAN $4,216,000 $13,923,750 $8,751,700 $5,773,686 $4,107,500 FEB $2,778,078 $4,545,898 $8,671,475 $7,026,450 $8,097,000 MAR $8,091,400 $6,600,200 $10,261,486 $3,803,000 $11,866,000 APR $9,259,925 $8,057,800 $17,126,400 $8,187,800 $9,568,000 MAY $8,391,150 $10,228,700 $8,539,400 $14,169,200 $16,698,161 Totals $32,736,553 $43,356,348 $53,350,461 $38,960,136 $50,336,661 YTD Monthly & Total $ Volume of Properties Sold
- 3. Sales Volume numbers represent all Single Family Homes, Condos, Townhomes and Land sales in the North End of the Gunnison Valley, including Almont, CB South, Rural Crested Butte, Crested Butte, Mt. Crested Butte and Rural Mt. Crested Butte as shown in the Gunnison Country Association of Realtors MLS. Information contained herein deemed reliable, but not guaranteed. CHRIS KOPF PREVIEWS® PROPERTY SPECIALIST COLDWELL BANKER BIGHORN REALTY cell: 970.209.5405 chriskopf@bighornrealty.com www.chriskopf.com CRESTED BUTTE REAL ESTATE MARKET REPORT 2015 YEAR TO DATE – THROUGH MAY PREPARED BY CHRIS KOPF Crested Butte Luxury Real Estate Market - Homes Sold for $1 Million + Year to Date - There have been 11 Single Family homes and one high-end parcel Sold for $1M or more YTD 2015, this is double the this same period in 2014, and 10 in 2013. The average sold price for these homes was $1.37M, median price of $1.125M, and Average Price per sq. ft. was $378 (well below replacement cost). The total volume of $16.4M makes up 33% of the overall market volume YTD. The distribution of these 12 homes sold was spread out – there were 4 in Crested Butte, 2 in Mt. Crested Butte, 1 in Skyland, and 6 in Rural Crested Butte. Luxury Properties For Sale in the Crested Butte Area There are a total of 13 properties Listed for over $1M. 76 Single Family Homes for sale with Asking Prices over $1M for a total Volume of $145M. There are two West Wall Ski-in Ski-out condos listed at over $1M (and another just under $1M). Floresta Ranch - $26M - Of note is phenomenal property known as the "Floresta Townsite" located on the top of Kebler Pass only 20 minutes (winter or summer) from(winter or summer) from Downtown Crested Butte. There is a 4,800 sq. ft. lodge and a 1,760 sq. ft. barn. This ranch is 1,650 scenic acres surrounded by National Forest on three sides and the 5 acre Lilly lake and terrain that supports back-country skiing on northern exposure. A price few could afford at $26M. High-end Land – There are 32 parcels of land listed for over $1M. Of these the majority are in Mt. Crested Butte in the Prospect Subdivision – offering Ski-in / Ski-out lots. There are also numerous home sites offering 2+ miles of private fishing at both The Reserve on the East River and Wilder on the Taylor. There is also a luxury home site listing in East River Ranches that has a unique riverfront home site on the East River with 1.5 Miles of fishing access and located only 4 miles from downtown Crested Butte. Year Total # Luxury Homes Sold $ Volume Luxury Homes Sold Avg. Price Per Sq. Ft YTD 2011 4 $8,170,000 $378 YTD 2012 5 $10,350,000 $378 YTD 2013 10 $14,903,000 $384 YTD 2014 6 $8,770,000 $394 YTD 2015 12 $16,445,000 $378 2015 Luxury Properties $1M+ Sold Total Sold by Category Average Sold Price Total Asking Price by Category Average Asking Price Total Original Price by Category Average Original Price % Difference Original Price vs. Sold Price % Difference Asking Price vs. Sold Price Average Price Per Sq. Foot Count of # Properties Sold Total All Sales $18,145,000 $1,395,769 $19,714,000 $1,516,462 20,629,900 $1,586,915 -12.05% -7.96% 13 Condos & Townhomes None Sold 0 Single Family Homes $16,445,000 $1,370,417 $17,964,000 $1,497,000 18,879,900 $1,573,325 -12.90% -8.46% $378 12 Mt. Crested Butte $2,570,000 $1,285,000 $2,750,000 $1,375,000 3,225,000 $1,612,500 -20.31% -6.55% $276 2 Mt. CB Single Family Homes $2,570,000 $1,285,000 $2,750,000 $1,375,000 2,995,000 $1,497,500 -14.19% -6.55% $276 2 Crested Butte Single Family Homes $5,150,000 $1,287,500 $5,515,000 $1,378,750 5,709,900 $1,427,475 -9.81% -6.62% $559 4 Skyland Single Family Homes $1,000,000 $1,000,000 $1,069,000 $1,069,000 1,035,000 $1,035,000 -3.38% -6.45% $233 1 Land/Lots $1,700,000 $1,700,000 $1,750,000 $1,750,000 $1,500,000 $1,500,000 13.33% -2.86% 1
- 4. Sales Volume numbers represent all Single Family Homes, Condos, Townhomes and Land sales in the North End of the Gunnison Valley, including Almont, CB South, Rural Crested Butte, Crested Butte, Mt. Crested Butte and Rural Mt. Crested Butte as shown in the Gunnison Country Association of Realtors MLS. Information contained herein deemed reliable, but not guaranteed. CHRIS KOPF PREVIEWS® PROPERTY SPECIALIST COLDWELL BANKER BIGHORN REALTY cell: 970.209.5405 chriskopf@bighornrealty.com www.chriskopf.com CRESTED BUTTE REAL ESTATE MARKET REPORT 2015 YEAR TO DATE – THROUGH MAY PREPARED BY CHRIS KOPF Averages(for(Single(Family(Homes((&(Condo(prices(Starting(to(Rise( Single Family (SF) homes – Comparing YTD 2013 results to prior years we see that the price per sq. ft. for Single Family homes has risen about 10% from $302 to $332 per sq. ft. Looking at the details in the tables you will see these prices per sq. ft. vary based on the area – as example Downtown Crested Butte shows $423, Mt. Crested Butte $296, and CB South $224 as averages per sq. ft. Condos and Townhomes The Average Price per sq. ft. for Condos and Townhomes was $223 compared to $253 for the same period in 2013. What Real Estate is Selling in the Crested Butte area? Given the inventory and price points of Condos and Townhomes this category represents the most transactions (58), with Single Family homes making up the second largest count (26). As the table shows the Luxury Single Family Homes Sold over $1M represents 23% of the dollar volume in our market, and Land or Lots represents only 5% of the Volume and 15% of the total transactions sold YTD. 2015 YTD - Category $ Volume of Properties Sold % of Total Count of # Properties Sold % of Total Total All Sales $50,336,661 127 Condos & Townhomes $12,204,161 24% 47 37% Single Family Homes $28,732,000 57% 36 28% Mt. Crested Butte $12,996,000 26% 40 31% Mt. CB Single Family Homes $4,382,000 9% 6 5% Crested Butte Single Family Homes $10,097,000 20% 12 9% Skyland Single Family Homes $1,535,000 3% 2 2% CB South Single Family Homes $2,597,500 5% 6 5% Almont $2,335,000 5% 2 2% Land/Lots $9,400,500 19% 44 35% SF Homes Sold > $1M $16,445,000 33% 12 9% How Long Does it Take a Property to Sell? DAYS ON MARKET COMPARISON SOLD PROPERTIES YTD AVERAGE DAYS ON MARKET (DOM) FOR SALE PROPERTIES YTD AVERAGE DAYS ON MARKET (DOM) YTD 2011 328 397 YTD 2012 428 468 YTD 2013 298 470 YTD 2014 329 504 YTD 2015 329 515 Single Family Home" Average Price Per Sq. Ft. Three things to remember about price per sq. ft. – 1) It is an interesting metric to compare “similar” homes, but it is impacted by the mix of what is sold. 2) The more transactions - the better the data. 3) A small home on a highly desirable piece of land will skew the numbers.
- 5. Sales Volume numbers represent all Single Family Homes, Condos, Townhomes and Land sales in the North End of the Gunnison Valley, including Almont, CB South, Rural Crested Butte, Crested Butte, Mt. Crested Butte and Rural Mt. Crested Butte as shown in the Gunnison Country Association of Realtors MLS. Information contained herein deemed reliable, but not guaranteed. CHRIS KOPF PREVIEWS® PROPERTY SPECIALIST COLDWELL BANKER BIGHORN REALTY cell: 970.209.5405 chriskopf@bighornrealty.com www.chriskopf.com CRESTED BUTTE REAL ESTATE MARKET REPORT 2015 YEAR TO DATE – THROUGH MAY PREPARED BY CHRIS KOPF Trends show Prices for Single Family Homes Rise and Condos & Townhomes flat Single Family (SF) homes – Comparing Year to Date (YTD) results from 2015 to prior years we see that the Median Price for Single Family homes has fallen from $572,750 to $520,000 (same as in 2013) but the Average SF Home price has risen slightly from $754,000 to $796,000. This may be a result of the sample set – as there were only 26 Single Family Homes Sold YTD in 2014 compared with a larger sample set of 46 YTD in 2015. Interesting as well in the Crested Butte area – there are new homes sold - sitting next to 30 year old homes that have not been updated. This is the reason to reach out to a quality Crested Butte Real Estate Agent for help understanding the values in the market and specific properties. Also of note is that the delta from Asking Price to Selling Price for Single Family homes has dropped from 8.75% to 6.2% in the past 3 years. Condos & Townhomes – The volume for Condos and Town homes is down 47 transactions YTD in 2015 vs. 57 & 58 in the 2 previous years). The Median Price for Condos and Townhomes has dropped when compared to the same period in 2014 ($195,000) but is the same as 2013 at $183,500. The Average Price was $223,500 compared with $254,000 in the 2014. As previously mentioned price per sq. ft. is also lower – again likely due to the mix of what sold. Crested Butte Land Sold While inventories have been dropping for finished homes – the activity in the Land/Lots category has shot up – the transactions nearly tripled from 2014. As the table shows there have been 44 parcels Sold YTD compared with 15 in 2014, and 24 in 2013. for the same period. 25 of these home sites were purchased for under $100,000. Nine home sites were sold for $495,000and up. Three parcels were 35 acres, including another primo riverfront lot at beautiful Wilder on the Taylor which sold for $1.7M. Condo Median Sales Price Single Family Home" Median Sales Price Condo Average Sales Price Single Family Home" Average Sales Price Land / Lots Sold Count % of Total 2010 3 14% 2011 11 12% 2012 29 26% 2013 24 15% 2014 15 10% 2015 44 26% Land Sold YTD " and Comparing Previous Years
- 6. Sales Volume numbers represent all Single Family Homes, Condos, Townhomes and Land sales in the North End of the Gunnison Valley, including Almont, CB South, Rural Crested Butte, Crested Butte, Mt. Crested Butte and Rural Mt. Crested Butte as shown in the Gunnison Country Association of Realtors MLS. Information contained herein deemed reliable, but not guaranteed. CHRIS KOPF PREVIEWS® PROPERTY SPECIALIST COLDWELL BANKER BIGHORN REALTY cell: 970.209.5405 chriskopf@bighornrealty.com www.chriskopf.com CRESTED BUTTE REAL ESTATE MARKET REPORT 2015 YEAR TO DATE – THROUGH MAY PREPARED BY CHRIS KOPF The detail below represents the past three years data by category. Interesting note for both Buyers and Sellers: after 3 years of price decline, most properties are priced to the Market and offer great value, evidence by % Difference Original Price vs. Sold Price and the % Difference Asking Price vs. Sold Price by Category, on average 7.39% for all property types. 2015 YTD Totals Total Sold by Category Average Sold Price Total Asking Price by Category Average Asking Price Total Original Price by Category Average Original Price % Difference Original Price vs. Sold Price % Difference Asking Price vs. Sold Price Average Price Per Sq. Foot Count of # Properties Sold Total All Sales $50,336,661 396,352 $54,352,989 427,976 56,778,100 447,072 -11.34% -7.39% 127 Condos & Townhomes $12,204,161 259,663 $12,909,889 274,678 12,973,200 276,026 -5.93% -5.47% $222 47 Single Family Homes $28,732,000 798,111 $30,851,300 856,981 32,231,700 895,325 -10.86% -6.87% $332 36 Mt. Crested Butte $12,996,000 324,900 $14,265,789 356,645 14,346,800 358,670 -9.42% -8.90% 40 Mt. CB Single Family Homes $4,382,000 730,333 $4,665,500 777,583 5,039,000 839,833 -13.04% -6.08% $296 6 Crested Butte Single Family Homes $10,097,000 841,417 $10,756,000 896,333 11,045,900 920,492 -8.59% -6.13% $423 12 Skyland Single Family Homes $1,535,000 767,500 $1,618,000 809,000 1,734,000 867,000 -11.48% -5.13% $252 2 CB South Single Family Homes $2,597,500 432,917 $2,732,900 455,483 2,767,900 461,317 -6.16% -4.95% $224 6 Almont $2,335,000 1,167,500 $2,400,000 1,200,000 2,145,000 1,072,500 8.86% -2.71% 2 Land/Lots $9,400,500 213,648 $10,591,800 240,723 9,817,300 223,120 -4.25% -11.25% 44 SF Homes Sold > $1M $16,445,000 1,370,417 $17,964,000 1,497,000 18,879,900 1,573,325 -12.90% -8.46% $378 12 2014 YTD Totals Total Sold by Category Average Sold Price Total Asking Price by Category Average Asking Price Total Original Price by Category Average Original Price % Difference Original Price vs. Sold Price % Difference Asking Price vs. Sold Price Average Price Per Sq. Foot Count of # Properties Sold Total All Sales $38,960,136 393,537 $41,596,949 420,171 43,800,975 442,434 -11.05% -6.34% 99 Condos & Townhomes $17,386,836 299,773 $18,556,349 319,937 19,156,675 330,288 -9.24% -6.30% $253 58 Single Family Homes $19,628,800 754,954 $20,925,600 804,831 21,759,400 836,900 -9.79% -6.20% $302 26 Mt. Crested Butte $18,176,550 356,403 $19,683,149 385,944 18,381,600 360,424 -1.12% -7.65% 51 Mt. CB Single Family Homes $6,181,300 686,811 $6,800,700 755,633 7,360,500 817,833 -16.02% -9.11% $228 9 Crested Butte Single Family Homes $7,222,500 1,031,786 $7,533,000 1,076,143 7,629,000 1,089,857 -5.33% -4.12% $435 7 Skyland Single Family Homes $1,925,000 1,925,000 $1,950,000 1,950,000 1,950,000 1,950,000 -1.28% -1.28% $403 1 CB South Single Family Homes $1,685,000 421,250 $1,768,000 442,000 1,797,000 449,250 -6.23% -4.69% $192 4 Almont $294,000 98,000 $374,000 124,667 848,900 282,967 -65.37% -21.39% 3 Land/Lots $1,944,500 129,633 $2,115,000 141,000 3,817,900 254,527 -49.07% -8.06% 15 SF Homes Sold > $1M $8,770,000 1,461,667 $9,369,000 1,561,500 9,614,000 1,602,333 -8.78% -6.39% $394 6 2013 YTD Totals Total Sold by Category Average Sold Price Total Asking Price by Category Average Asking Price Total Original Price by Category Average Original Price % Difference Original Price vs. Sold Price % Difference Asking Price vs. Sold Price Average Price Per Sq. Foot Count of # Properties Sold Total All Sales $53,350,461 420,082 $58,744,603 462,556 63,997,150 503,915 -16.64% -9.18% 127 Condos & Townhomes $17,296,520 293,161 $18,890,603 320,180 20,093,300 340,564 -13.92% -8.44% $214 59 Single Family Homes $31,857,955 724,044 $34,911,700 793,448 38,113,100 866,207 -16.41% -8.75% $276 44 Mt. Crested Butte $17,499,412 349,988 $19,202,100 384,042 19,679,000 393,580 -11.08% -8.87% 50 Mt. CB Single Family Homes $5,655,000 706,875 $6,178,900 772,363 7,042,400 880,300 -19.70% -8.48% $277 8 Crested Butte Single Family Homes $7,116,005 790,667 $7,506,900 834,100 7,921,400 880,156 -10.17% -5.21% $390 9 Skyland Single Family Homes $3,597,000 899,250 $3,834,000 958,500 4,564,000 1,141,000 -21.19% -6.18% $312 4 CB South Single Family Homes $647,900 323,950 $664,800 332,400 719,900 359,950 -10.00% -2.54% $150 2 Almont $105,550 105,550 $91,000 91,000 94,900 94,900 11.22% 15.99% 1 Land/Lots $4,195,986 174,833 $4,942,300 205,929 4,937,350 205,723 -15.02% -15.10% 24 SF Homes Sold > $1M $14,903,000 1,490,300 $16,719,000 1,671,900 17,649,000 1,764,900 -15.56% -10.86% $384 10
- 7. Sales Volume numbers represent all Single Family Homes, Condos, Townhomes and Land sales in the North End of the Gunnison Valley, including Almont, CB South, Rural Crested Butte, Crested Butte, Mt. Crested Butte and Rural Mt. Crested Butte as shown in the Gunnison Country Association of Realtors MLS. Information contained herein deemed reliable, but not guaranteed. CHRIS KOPF PREVIEWS® PROPERTY SPECIALIST COLDWELL BANKER BIGHORN REALTY cell: 970.209.5405 chriskopf@bighornrealty.com www.chriskopf.com CRESTED BUTTE REAL ESTATE MARKET REPORT 2015 YEAR TO DATE – THROUGH MAY PREPARED BY CHRIS KOPF ! Crested Butte Summer is here (Finally) – The snow in May made up for the dry March and snowpack got back to 100%. Spring run-off is in full force as water levels are high in the rivers and steams. Kebler & Cottonwood Passes are open, the golf course at The Club at Crested Butte is in great condition and the wildflowers are popping up everywhere. There are lots of activities and events planned again this summer and the TA (Travel & Tourism) is promoting the great beginner and advanced mountain biking available in our valley. They are touting our 750 Miles of great trails from Hartman Rocks to the epic 401. Evidently mountain bikers span many socio-demographic segments from young to old and affluent. The Enduro World Series mountain bike series stop in Crested Butte is a feather in our cap and should illuminate this marketing effort. I hope you are making plans to gather with family and friends, enjoy the cool weather, hiking, fishing, biking, golf, Alpenglow concerts, the Arts, Tour de Forks… or just relax, get an ice cream cone and sit on a bench on Elk Avenue and make a new friend. How can I help you? This Crested Butte Real Estate Market report and the level of detail is representative of what you can expect from me as your Real Estate Agent. If you are interested in finding out what your existing property is worth, or considering me to represent you as a Buyer, I would appreciate the opportunity to earn your business (or that of a friend you think I could help). To see featured properties or search the MLS – visit www.chriskopf.com. Contact me at: (970) 209-5405, or chriskopf@bighornrealty.com Thanks, Under Contract At the end of May 2015 there were 46 properties Under Contract (nearly double from 1 year ago) representing a total volume of $25.3M. Of the 46 properties Under Contract 14 are Condos/Townhomes, 15 are Single Family homes and 17 are lots (nearly triple from 1 year ago). Active Listings There are 578 properties For Sale in our market (down 75 from 1 year ago) representing $414M. Inventory has shrunk since the same period in 2013 when we had 750 properties for Sale. All Properties Under Contract Total Under Contract by Asking Price Average Under Contract by Asking Price Count of # Properties Under Contract Total All Properties Under Contract $25,362,299 $551,354 46 Condos & Townhomes $5,408,899 $386,350 14 Single Family Homes $17,059,000 $1,137,267 15 Mt. Crested Butte $6,647,499 $511,346 13 Mt. CB Single Family Homes $1,544,000 $772,000 2 Crested Butte Single Family Homes $3,665,000 $916,250 4 Skyland Single Family Homes $2,995,000 $2,995,000 1 CB South Single Family Homes $2,156,000 $539,000 4 Land/Lots $2,894,400 $170,259 17 SF Homes > $1M $12,264,000 $1,752,000 7 All Current Listings Total Current Listing Price by Category Average Listing Price Count of # Properties on the Market Total All Sales $414,138,055 $716,502 578 Condos & Townhomes $56,315,350 $360,996 156 Single Family Homes $192,393,249 $1,326,850 145 Mt. Crested Butte $149,239,599 $746,198 200 Mt. CB Single Family Homes $62,090,250 $1,592,058 39 Crested Butte Single Family Homes $19,173,600 $1,198,350 16 Skyland Single Family Homes $16,687,999 $1,390,667 12 CB South Single Family Homes $8,014,900 $616,531 13 Almont $13,252,300 $294,496 45 Land/Lots $165,429,456 $597,218 277 SF Homes > $1M $145,253,849 $1,911,235 76 35 Acre SF Homes $36,639,000 $1,744,714 21