Greater Baton Rouge New Home Sales Home Prices May 2013 vs May 2014 as of June 10 2014
•
0 likes•279 views

Greater Baton Rouge New Home Sales Home Prices May 2013 vs May 2014 as of June 10 2014. By Greater Baton Rouge, I'm referring to homes located in East Baton Rouge, West Baton Rouge, Livingston and Ascension Parishes, All new home types. GREATER BATON ROUGE REAL ESTATE DATA NOTE: Based on information from Greater Baton Rouge Association of REALTORS®\MLS for period May 2013 vs May 2014, extracted on 06/10/2014.

Recommended
Recommended
More Related Content
What's hot
What's hot (20)
Similar to Greater Baton Rouge New Home Sales Home Prices May 2013 vs May 2014 as of June 10 2014
Similar to Greater Baton Rouge New Home Sales Home Prices May 2013 vs May 2014 as of June 10 2014 (12)
More from Bill Cobb, Appraiser
More from Bill Cobb, Appraiser (20)
Recently uploaded
Recently uploaded (20)
Greater Baton Rouge New Home Sales Home Prices May 2013 vs May 2014 as of June 10 2014
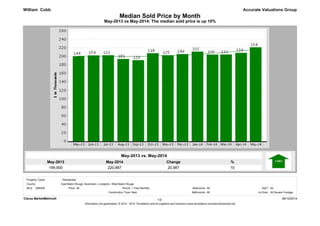
- 1. Median Sold Price by Month May-2013 vs May-2014: The median sold price is up 10% May-2014 220,887 May-2013 199,900 % 10 Change 20,987 Accurate Valuations Group May-2013 vs. May-2014 William Cobb Property Types: : Residential MLS: GBRAR Bedrooms: 1 Year Monthly All SqFt: All New Bathrooms: All Lot Size: All Square Footage All Period: Construction Type: Clarus MarketMetrics® 06/10/2014 1/2 Information not guaranteed. © 2014 - 2015 Terradatum and its suppliers and licensors (www.terradatum.com/about/licensors.td). County: East Baton Rouge, Ascension, Livingston, West Baton Rouge Price:
- 2. William Cobb Accurate Valuations Group Median Sold Price by Month May-2013 vs May-2014: The median sold price is up 10% Time Period Sold Median Price Units Avg DOM May-14 220,887 164 124 Apr-14 207,900 139 111 Mar-14 203,926 130 108 Feb-14 203,885 108 105 Jan-14 210,700 102 70 Dec-13 204,860 149 84 Nov-13 202,320 125 91 Oct-13 206,995 118 91 Sep-13 190,730 129 99 Aug-13 193,340 181 82 Jul-13 202,225 132 71 Jun-13 201,900 154 94 May-13 199,900 144 137 2/2 Clarus MarketMetrics® 06/10/2014 Information not guaranteed. © 2014 - 2015 Terradatum and its suppliers and licensors (www.terradatum.com/about/licensors.td).
- 3. Accurate Valuations Group May-2013 vs May-2014: The median price of for sale properties is up 4% and the median price of sold properties is up 10% May-2013 vs. May-2014 William Cobb May-2014 212,900 222,042 4 Median For Sale vs Median Sold May-2013 Change % 9,142 May-2013 vs. May-2014 May-2013 May-2014 Change % 199,900 220,887 20,987 10 Property Types: : Residential MLS: GBRAR Bedrooms: 1 Year Monthly All SqFt: All New Bathrooms: All Lot Size: All Square Footage All Period: Construction Type: Clarus MarketMetrics® 1/2 06/10/2014 Information not guaranteed. © 2014 - 2015 Terradatum and its suppliers and licensors (www.terradatum.com/about/licensors.td). County: East Baton Rouge, Ascension, Livingston, West Baton Rouge Price:
- 4. William Cobb Accurate Valuations Group Median For Sale vs Median Sold May-2013 vs May-2014: The median price of for sale properties is up 4% and the median price of sold properties is up 10% For Sale # Properties Sold # Properties Price Difference Time Period Median For Sale Median Sold May-14 222,042 815 220,887 164 -1,155 Apr-14 219,900 801 207,900 139 -12,000 Mar-14 216,900 822 203,926 130 -12,974 Feb-14 218,640 815 203,885 108 -14,755 Jan-14 216,900 812 210,700 102 -6,200 Dec-13 214,900 766 204,860 149 -10,040 Nov-13 214,900 787 202,320 125 -12,580 Oct-13 212,277 820 206,995 118 -5,282 Sep-13 212,950 752 190,730 129 -22,220 Aug-13 212,900 754 193,340 181 -19,560 Jul-13 209,950 734 202,225 132 -7,725 Jun-13 212,850 764 201,900 154 -10,950 May-13 212,900 798 199,900 144 -13,000 Clarus MarketMetrics® 2/2 06/10/2014 Information not guaranteed. © 2014 - 2015 Terradatum and its suppliers and licensors (www.terradatum.com/about/licensors.td).
- 5. Sold Properties by Month May-2013 vs May-2014: The number of Sold properties is up 14% May-2014 164 May-2013 144 % 14 Change 20 Accurate Valuations Group May-2013 vs. May-2014 William Cobb Property Types: : Residential MLS: GBRAR Bedrooms: 1 Year Monthly All SqFt: All New Bathrooms: All Lot Size: All Square Footage All Period: Construction Type: Clarus MarketMetrics® 1/2 06/10/2014 Information not guaranteed. © 2014 - 2015 Terradatum and its suppliers and licensors (www.terradatum.com/about/licensors.td). County: East Baton Rouge, Ascension, Livingston, West Baton Rouge Price:
- 6. William Cobb Accurate Valuations Group Sold Properties by Month May-2013 vs May-2014: The number of Sold properties is up 14% Time Period Units Median Price Avg DOM May-14 164 220,887 124 Apr-14 139 207,900 111 Mar-14 130 203,926 108 Feb-14 108 203,885 105 Jan-14 102 210,700 70 Dec-13 149 204,860 84 Nov-13 125 202,320 91 Oct-13 118 206,995 91 Sep-13 129 190,730 99 Aug-13 181 193,340 82 Jul-13 132 202,225 71 Jun-13 154 201,900 94 May-13 144 199,900 137 Clarus MarketMetrics® 2/2 06/10/2014 Information not guaranteed. © 2014 - 2015 Terradatum and its suppliers and licensors (www.terradatum.com/about/licensors.td).
- 7. Under Contract Properties by Month May-2013 vs May-2014: The number of Under Contract properties is up 67% May-2014 226 May-2013 135 % 67 Change 91 Accurate Valuations Group May-2013 vs. May-2014 William Cobb Bathrooms: All SqFt: New East Baton Rouge, Ascension, Livingston, West Baton Rouge Property Types: Clarus MarketMetrics® 1/2 06/10/2014 Information not guaranteed. © 2014 - 2015 Terradatum and its suppliers and licensors (www.terradatum.com/about/licensors.td). : Residential GBRAR Period: 1 Year Monthly Construction Type: Lot Size: All Square Footage Price: MLS: All All All Bedrooms: County:
- 8. William Cobb Accurate Valuations Group Under Contract Properties by Month May-2013 vs May-2014: The number of Under Contract properties is up 67% Time Period Units Median Price Avg DOM May-14 226 209,025 104 Apr-14 165 208,300 125 Mar-14 167 207,000 83 Feb-14 136 209,900 104 Jan-14 135 209,900 123 Dec-13 95 204,900 89 Nov-13 116 211,900 99 Oct-13 134 204,900 93 Sep-13 110 199,400 102 Aug-13 144 204,900 88 Jul-13 103 204,450 86 Jun-13 126 211,850 93 May-13 135 197,900 82 Clarus MarketMetrics® 2/2 06/10/2014 Information not guaranteed. © 2014 - 2015 Terradatum and its suppliers and licensors (www.terradatum.com/about/licensors.td).
- 9. New Properties by Month May-2013 vs May-2014: The number of New properties is up 1% May-2014 196 May-2013 195 % 1 Change 1 Accurate Valuations Group May-2013 vs. May-2014 William Cobb Property Types: : Residential MLS: GBRAR Bedrooms: 1 Year Monthly All SqFt: All New Bathrooms: All Lot Size: All Square Footage All Period: Construction Type: Clarus MarketMetrics® 1/2 06/10/2014 Information not guaranteed. © 2014 - 2015 Terradatum and its suppliers and licensors (www.terradatum.com/about/licensors.td). County: East Baton Rouge, Ascension, Livingston, West Baton Rouge Price:
- 10. William Cobb Accurate Valuations Group New Properties by Month May-2013 vs May-2014: The number of New properties is up 1% Time Period Units Median Price May-14 196 223,075 Apr-14 160 216,100 Mar-14 165 207,000 Feb-14 160 204,540 Jan-14 165 218,740 Dec-13 114 208,917 Nov-13 115 219,900 Oct-13 193 210,000 Sep-13 166 202,850 Aug-13 169 219,900 Jul-13 133 192,900 Jun-13 137 202,900 May-13 195 201,900 Clarus MarketMetrics® 2/2 06/10/2014 Information not guaranteed. © 2014 - 2015 Terradatum and its suppliers and licensors (www.terradatum.com/about/licensors.td).
- 11. For Sale Properties by Month May-2013 vs May-2014: The number of For Sale properties is up 2% May-2014 815 May-2013 798 % 2 Change 17 Accurate Valuations Group May-2013 vs. May-2014 William Cobb Property Types: : Residential MLS: GBRAR Bedrooms: 1 Year Monthly All SqFt: All New Bathrooms: All Lot Size: All Square Footage All Period: Construction Type: Clarus MarketMetrics® 1/2 06/10/2014 Information not guaranteed. © 2014 - 2015 Terradatum and its suppliers and licensors (www.terradatum.com/about/licensors.td). County: East Baton Rouge, Ascension, Livingston, West Baton Rouge Price:
- 12. William Cobb Accurate Valuations Group For Sale Properties by Month May-2013 vs May-2014: The number of For Sale properties is up 2% Time Period Units Median Price Avg DOM May-14 815 222,042 172 Apr-14 801 219,900 185 Mar-14 822 216,900 177 Feb-14 815 218,640 177 Jan-14 812 216,900 180 Dec-13 766 214,900 190 Nov-13 787 214,900 179 Oct-13 820 212,277 167 Sep-13 752 212,950 173 Aug-13 754 212,900 172 Jul-13 734 209,950 188 Jun-13 764 212,850 182 May-13 798 212,900 174 Clarus MarketMetrics® 2/2 06/10/2014 Information not guaranteed. © 2014 - 2015 Terradatum and its suppliers and licensors (www.terradatum.com/about/licensors.td).
- 13. Expired Properties by Month May-2013 vs May-2014: The number of Expired properties is down -17% May-2014 30 May-2013 36 % -17 Change -6 Accurate Valuations Group May-2013 vs. May-2014 William Cobb Property Types: : Residential County: East Baton Rouge, Ascension, Livingston, West Baton Rouge MLS: GBRAR Bedrooms: 1 Year Monthly All SqFt: All New Bathrooms: All Lot Size: All Square Footage All Period: Construction Type: Price: Clarus MarketMetrics® 1/2 06/10/2014
- 14. William Cobb Accurate Valuations Group Expired Properties by Month May-2013 vs May-2014: The number of Expired properties is down -17% Units Median Price Avg DOM May-14 30 209,950 228 Apr-14 17 279,900 317 Mar-14 14 213,615 197 Feb-14 22 225,249 179 Jan-14 22 225,900 168 Dec-13 24 449,900 466 Nov-13 19 217,900 239 Oct-13 14 194,700 297 Sep-13 15 285,500 211 Aug-13 24 230,450 227 Jul-13 46 226,525 385 Jun-13 37 204,490 228 May-13 36 215,900 212 Clarus MarketMetrics® 2/2 06/10/2014 Information not guaranteed. © 2014 - 2015 Terradatum and its suppliers and licensors (www.terradatum.com/about/licensors.td).
- 15. Accurate Valuations Group May-2013 vs May-2014: The number of for sale properties is up 2% and the number of sold properties is up 14% May-2013 vs. May-2014 William Cobb May-2014 798 815 2 Supply & Demand by Month May-2013 Change % 17 May-2013 vs. May-2014 May-2013 May-2014 % 144 164 14 Change 20 Property Types: : Residential MLS: GBRAR Bedrooms: 1 Year Monthly All SqFt: All New Bathrooms: All Lot Size: All Square Footage All Period: Construction Type: Clarus MarketMetrics® 1/2 06/10/2014 Information not guaranteed. © 2014 - 2015 Terradatum and its suppliers and licensors (www.terradatum.com/about/licensors.td). County: East Baton Rouge, Ascension, Livingston, West Baton Rouge Price:
- 16. William Cobb Accurate Valuations Group Supply & Demand by Month May-2013 vs May-2014: The number of for sale properties is up 2% and the number of sold properties is up 14% # Properties # Properties Time Period For Sale Sold May-14 815 172 164 124 Apr-14 801 185 139 111 Mar-14 822 177 130 108 Feb-14 815 177 108 105 Jan-14 812 180 102 70 Dec-13 766 190 149 84 Nov-13 787 179 125 91 Oct-13 820 167 118 91 Sep-13 752 173 129 99 Aug-13 754 172 181 82 Jul-13 734 188 132 71 Jun-13 764 182 154 94 May-13 798 174 144 137 Avg DOM Avg DOM Clarus MarketMetrics® 2/2 06/10/2014 Information not guaranteed. © 2014 - 2015 Terradatum and its suppliers and licensors (www.terradatum.com/about/licensors.td).
- 17. The Average Days on Market by Month May-2013 vs May-2014: The average days on market is up 26% May-2014 104 May-2013 82 % 26 Change 21 Accurate Valuations Group May-2013 vs. May-2014 William Cobb Property Types: : Residential East Baton Rouge, Ascension, Livingston, West Baton Rouge All 1 Year Monthly County: Price: Period: Bedrooms: All SqFt: All All Square Footage Construction Type: New Bathrooms: All Lot Size: MLS: GBRAR Clarus MarketMetrics® 1/2 06/10/2014
- 18. William Cobb Accurate Valuations Group The Average Days on Market by Month May-2013 vs May-2014: The average days on market is up 26% Time Period Avg DOM # UC Units May-14 104 226 Apr-14 125 165 Mar-14 83 167 Feb-14 104 136 Jan-14 123 135 Dec-13 89 95 Nov-13 99 116 Oct-13 93 134 Sep-13 102 110 Aug-13 88 144 Jul-13 86 103 Jun-13 93 126 May-13 82 135 Clarus MarketMetrics® 2/2 06/10/2014 Information not guaranteed. © 2014 - 2015 Terradatum and its suppliers and licensors (www.terradatum.com/about/licensors.td).
- 19. May-2013 vs May-2014: The average months supply of inventory is down -47% Accurate Valuations Group May-2013 vs. May-2014 May-2014 4.6 -47 William Cobb 2.5 Months Supply of Inventory May-2013 Change % -2.2 Property Types: : Residential MLS: GBRAR Bedrooms: 1 Year Monthly All SqFt: All New Bathrooms: All Lot Size: All Square Footage All Period: Construction Type: Clarus MarketMetrics® 06/10/2014 1/2 Information not guaranteed. © 2014 - 2015 Terradatum and its suppliers and licensors (www.terradatum.com/about/licensors.td). County: East Baton Rouge, Ascension, Livingston, West Baton Rouge Price:
- 20. William Cobb Accurate Valuations Group Months Supply of Inventory May-2013 vs May-2014: The average months supply of inventory is down -47% # Units For Sale # UC Units Last Day of Month During Month MSI Time Period UC Avg DOM May-14 559 226 2.5 104 Apr-14 619 165 3.8 125 Mar-14 641 167 3.8 83 Feb-14 657 136 4.8 104 Jan-14 655 135 4.9 123 Dec-13 647 95 6.8 89 Nov-13 652 116 5.6 99 Oct-13 672 134 5.0 93 Sep-13 627 110 5.7 102 Aug-13 586 144 4.1 88 Jul-13 585 103 5.7 86 Jun-13 601 126 4.8 93 May-13 627 135 4.6 82 Clarus MarketMetrics® 06/10/2014 2/2 Information not guaranteed. © 2014 - 2015 Terradatum and its suppliers and licensors (www.terradatum.com/about/licensors.td).