Baton Rouge Home Sales For June 2013 2014
•
0 likes•234 views

Baton Rouge Home Sales For June 2013 2014 East Baton Rouge Home Sales June 2013 vs June 2014 Summary: Sold Homes -5% Median Sold Price +7% Months Supply of Inventory: -20% Average Days On Market: +13% Under Contract Homes +19% GREATER BATON ROUGE REAL ESTATE DATA NOTE: Based on information from Greater Baton Rouge Association of REALTORS®\MLS for period 06/01/2013 to 06/30/2013 to 06/01/2014 to 06/30/2014, extracted on 07/14/2014. Includes ALL home types and ages.

Recommended
Recommended
More Related Content
What's hot
What's hot (20)
Viewers also liked
Viewers also liked (14)
Similar to Baton Rouge Home Sales For June 2013 2014
Similar to Baton Rouge Home Sales For June 2013 2014 (12)
More from Bill Cobb, Appraiser
More from Bill Cobb, Appraiser (20)
Baton Rouge Home Sales For June 2013 2014
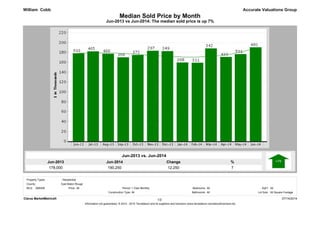
- 1. Jun-2014 190,250 Jun-2013 178,000 % 7 Change 12,250 Jun-2013 vs Jun-2014: The median sold price is up 7% Median Sold Price by Month Accurate Valuations Group Jun-2013 vs. Jun-2014 William Cobb Clarus MarketMetrics® 07/14/2014 Information not guaranteed. © 2014 - 2015 Terradatum and its suppliers and licensors (www.terradatum.com/about/licensors.td). 1/2 MLS: GBRAR Bedrooms: All All Construction Type: All1 Year Monthly SqFt: Bathrooms: Lot Size:All All Square Footage Period:All County: Property Types: : Residential East Baton Rouge Price:
- 2. Median Sold Price by Month Jun-2013 vs Jun-2014: The median sold price is up 7% Accurate Valuations GroupWilliam Cobb Sold Median Price Units Avg DOMTime Period Jun-14 190,250 480 83 May-14 176,500 501 83 Apr-14 170,750 430 95 Mar-14 188,000 342 89 Feb-14 159,000 311 100 Jan-14 159,500 268 93 Dec-13 182,500 349 85 Nov-13 183,250 297 87 Oct-13 174,727 372 89 Sep-13 170,000 366 83 Aug-13 177,217 466 82 Jul-13 182,000 465 79 Jun-13 178,000 503 82 Clarus MarketMetrics® 07/14/2014 Information not guaranteed. © 2014 - 2015 Terradatum and its suppliers and licensors (www.terradatum.com/about/licensors.td). 22/
- 3. Jun-2013 vs Jun-2014: The median price of for sale properties is up 9% and the median price of sold properties is up 7% Accurate Valuations Group Jun-2013 vs. Jun-2014 169,900 9 William Cobb 185,000 Jun-2014 Median For Sale vs Median Sold ChangeJun-2013 % 15,100 Jun-2013 Jun-2014 % 178,000 7 Jun-2013 vs. Jun-2014 190,250 Change 12,250 Clarus MarketMetrics® 07/14/2014 Information not guaranteed. © 2014 - 2015 Terradatum and its suppliers and licensors (www.terradatum.com/about/licensors.td). 1/2 MLS: GBRAR Bedrooms: All All Construction Type: All1 Year Monthly SqFt: Bathrooms: Lot Size:All All Square Footage Period:All County: Property Types: : Residential East Baton Rouge Price:
- 4. Median For Sale vs Median Sold Jun-2013 vs Jun-2014: The median price of for sale properties is up 9% and the median price of sold properties is up 7% Accurate Valuations GroupWilliam Cobb For SaleMedian SoldMedian For Sale # Properties # PropertiesSold Price Difference Time Period Jun-14 3,022 480185,000 190,250 5,250 May-14 3,030 501182,900 176,500 -6,400 Apr-14 3,029 430179,000 170,750 -8,250 Mar-14 2,909 342175,000 188,000 13,000 Feb-14 2,876 311169,900 159,000 -10,900 Jan-14 2,906 268168,000 159,500 -8,500 Dec-13 2,846 349165,000 182,500 17,500 Nov-13 2,956 297168,000 183,250 15,250 Oct-13 3,072 372166,950 174,727 7,777 Sep-13 3,047 366165,000 170,000 5,000 Aug-13 3,078 466166,950 177,217 10,267 Jul-13 3,089 465170,000 182,000 12,000 Jun-13 3,069 503169,900 178,000 8,100 Clarus MarketMetrics® Information not guaranteed. © 2014 - 2015 Terradatum and its suppliers and licensors (www.terradatum.com/about/licensors.td). 07/14/201422/
- 5. Jun-2014 480 Jun-2013 503 % -5 Change -23 Jun-2013 vs Jun-2014: The number of Sold properties is down -5% Sold Properties by Month Accurate Valuations Group Jun-2013 vs. Jun-2014 William Cobb Clarus MarketMetrics® 07/14/2014 Information not guaranteed. © 2014 - 2015 Terradatum and its suppliers and licensors (www.terradatum.com/about/licensors.td). 1/2 MLS: GBRAR Bedrooms: All All Construction Type: All1 Year Monthly SqFt: Bathrooms: Lot Size:All All Square Footage Period:All County: Property Types: : Residential East Baton Rouge Price:
- 6. Sold Properties by Month Jun-2013 vs Jun-2014: The number of Sold properties is down -5% Accurate Valuations GroupWilliam Cobb Time Period Units Median Price Avg DOM Jun-14 190,250480 83 May-14 176,500501 83 Apr-14 170,750430 95 Mar-14 188,000342 89 Feb-14 159,000311 100 Jan-14 159,500268 93 Dec-13 182,500349 85 Nov-13 183,250297 87 Oct-13 174,727372 89 Sep-13 170,000366 83 Aug-13 177,217466 82 Jul-13 182,000465 79 Jun-13 178,000503 82 Clarus MarketMetrics® 07/14/2014 Information not guaranteed. © 2014 - 2015 Terradatum and its suppliers and licensors (www.terradatum.com/about/licensors.td). 22/
- 7. Jun-2014 511 Jun-2013 429 % 19 Change 82 Jun-2013 vs Jun-2014: The number of Under Contract properties is up 19% Under Contract Properties by Month Accurate Valuations Group Jun-2013 vs. Jun-2014 William Cobb Clarus MarketMetrics® 07/14/2014 Information not guaranteed. © 2014 - 2015 Terradatum and its suppliers and licensors (www.terradatum.com/about/licensors.td). 1/2 AllBathrooms: SqFt: All : Residential All Square FootageConstruction Type: Lot Size:GBRAR East Baton Rouge Period: 1 Year Monthly Price: MLS: All AllAll Property Types: Bedrooms: County:
- 8. Under Contract Properties by Month Jun-2013 vs Jun-2014: The number of Under Contract properties is up 19% Accurate Valuations GroupWilliam Cobb Units Avg DOMMedian PriceTime Period Jun-14 185,000511 86 May-14 188,850514 92 Apr-14 175,000502 86 Mar-14 179,900445 92 Feb-14 192,000367 89 Jan-14 173,700358 100 Dec-13 167,250246 90 Nov-13 185,000300 91 Oct-13 176,700358 82 Sep-13 189,900341 93 Aug-13 179,900382 87 Jul-13 189,900430 88 Jun-13 175,000429 76 Clarus MarketMetrics® 07/14/2014 Information not guaranteed. © 2014 - 2015 Terradatum and its suppliers and licensors (www.terradatum.com/about/licensors.td). 22/
- 9. Jun-2014 694 Jun-2013 627 % 11 Change 67 Jun-2013 vs Jun-2014: The number of New properties is up 11% New Properties by Month Accurate Valuations Group Jun-2013 vs. Jun-2014 William Cobb Clarus MarketMetrics® 07/14/2014 Information not guaranteed. © 2014 - 2015 Terradatum and its suppliers and licensors (www.terradatum.com/about/licensors.td). 1/2 MLS: GBRAR Bedrooms: All All Construction Type: All1 Year Monthly SqFt: Bathrooms: Lot Size:All All Square Footage Period:All County: Property Types: : Residential East Baton Rouge Price:
- 10. New Properties by Month Jun-2013 vs Jun-2014: The number of New properties is up 11% Accurate Valuations GroupWilliam Cobb Units Median PriceTime Period Jun-14 184,950694 May-14 194,950682 Apr-14 184,999739 Mar-14 193,000583 Feb-14 179,000546 Jan-14 179,900558 Dec-13 171,900371 Nov-13 169,900459 Oct-13 186,450580 Sep-13 159,900617 Aug-13 173,000647 Jul-13 175,000677 Jun-13 179,900627 Clarus MarketMetrics® 07/14/2014 Information not guaranteed. © 2014 - 2015 Terradatum and its suppliers and licensors (www.terradatum.com/about/licensors.td). 22/
- 11. Jun-2014 3,022 Jun-2013 3,069 % -2 Change -47 Jun-2013 vs Jun-2014: The number of For Sale properties is down -2% For Sale Properties by Month Accurate Valuations Group Jun-2013 vs. Jun-2014 William Cobb Clarus MarketMetrics® 07/14/2014 Information not guaranteed. © 2014 - 2015 Terradatum and its suppliers and licensors (www.terradatum.com/about/licensors.td). 1/2 MLS: GBRAR Bedrooms: All All Construction Type: All1 Year Monthly SqFt: Bathrooms: Lot Size:All All Square Footage Period:All County: Property Types: : Residential East Baton Rouge Price:
- 12. For Sale Properties by Month Jun-2013 vs Jun-2014: The number of For Sale properties is down -2% Accurate Valuations GroupWilliam Cobb Units Avg DOMMedian PriceTime Period Jun-14 185,0003,022 140 May-14 182,9003,030 144 Apr-14 179,0003,029 146 Mar-14 175,0002,909 154 Feb-14 169,9002,876 155 Jan-14 168,0002,906 157 Dec-13 165,0002,846 163 Nov-13 168,0002,956 151 Oct-13 166,9503,072 143 Sep-13 165,0003,047 142 Aug-13 166,9503,078 147 Jul-13 170,0003,089 150 Jun-13 169,9003,069 151 Clarus MarketMetrics® 07/14/2014 Information not guaranteed. © 2014 - 2015 Terradatum and its suppliers and licensors (www.terradatum.com/about/licensors.td). 22/
- 13. Jun-2014 207 Jun-2013 228 % -9 Change -21 Jun-2013 vs Jun-2014: The number of Expired properties is down -9% Expired Properties by Month Accurate Valuations Group Jun-2013 vs. Jun-2014 William Cobb 07/14/2014Clarus MarketMetrics® 1/2 MLS: GBRAR Bedrooms: All All Construction Type: All1 Year Monthly SqFt: Bathrooms: Lot Size:All All Square Footage Period:All County: Property Types: : Residential East Baton Rouge Price:
- 14. Expired Properties by Month Jun-2013 vs Jun-2014: The number of Expired properties is down -9% Accurate Valuations GroupWilliam Cobb Avg DOMUnits Median Price Jun-14 159,999207 189 May-14 151,900188 193 Apr-14 169,900179 197 Mar-14 155,450174 199 Feb-14 154,000183 205 Jan-14 159,900218 186 Dec-13 168,750252 232 Nov-13 184,900181 180 Oct-13 154,900217 183 Sep-13 151,350214 183 Aug-13 156,250266 232 Jul-13 193,450228 213 Jun-13 159,900228 191 Clarus MarketMetrics® 07/14/2014 Information not guaranteed. © 2014 - 2015 Terradatum and its suppliers and licensors (www.terradatum.com/about/licensors.td). 22/
- 15. Jun-2013 vs Jun-2014: The number of for sale properties is down -2% and the number of sold properties is down -5% Accurate Valuations Group Jun-2013 vs. Jun-2014 3,069 -2 William Cobb 3,022 Jun-2014 Supply & Demand by Month ChangeJun-2013 % -47 Jun-2013 Jun-2014 % 503 -5 Jun-2013 vs. Jun-2014 480 Change -23 Clarus MarketMetrics® 07/14/2014 Information not guaranteed. © 2014 - 2015 Terradatum and its suppliers and licensors (www.terradatum.com/about/licensors.td). 1/2 MLS: GBRAR Bedrooms: All All Construction Type: All1 Year Monthly SqFt: Bathrooms: Lot Size:All All Square Footage Period:All County: Property Types: : Residential East Baton Rouge Price:
- 16. Supply & Demand by Month Jun-2013 vs Jun-2014: The number of for sale properties is down -2% and the number of sold properties is down -5% William Cobb Accurate Valuations Group For Sale Sold # Properties Avg DOM Avg DOM # Properties Time Period Jun-14 140 833,022 480 May-14 144 833,030 501 Apr-14 146 953,029 430 Mar-14 154 892,909 342 Feb-14 155 1002,876 311 Jan-14 157 932,906 268 Dec-13 163 852,846 349 Nov-13 151 872,956 297 Oct-13 143 893,072 372 Sep-13 142 833,047 366 Aug-13 147 823,078 466 Jul-13 150 793,089 465 Jun-13 151 823,069 503 Clarus MarketMetrics® 07/14/2014 Information not guaranteed. © 2014 - 2015 Terradatum and its suppliers and licensors (www.terradatum.com/about/licensors.td). 22/
- 17. Jun-2014 86 Jun-2013 76 % 13 Change 10 Jun-2013 vs Jun-2014: The average days on market is up 13% The Average Days on Market by Month Accurate Valuations Group Jun-2013 vs. Jun-2014 William Cobb East Baton Rouge All 1 Year Monthly County: Period:Price: Property Types: : Residential 07/14/20141/2Clarus MarketMetrics® All Square Footage Bedrooms: All AllSqFt: All Lot Size:Bathrooms:AllConstruction Type: MLS: GBRAR
- 18. The Average Days on Market by Month Jun-2013 vs Jun-2014: The average days on market is up 13% Accurate Valuations GroupWilliam Cobb # UC UnitsAvg DOMTime Period Jun-14 51186 May-14 51492 Apr-14 50286 Mar-14 44592 Feb-14 36789 Jan-14 358100 Dec-13 24690 Nov-13 30091 Oct-13 35882 Sep-13 34193 Aug-13 38287 Jul-13 43088 Jun-13 42976 Clarus MarketMetrics® 2/2 07/14/2014 Information not guaranteed. © 2014 - 2015 Terradatum and its suppliers and licensors (www.terradatum.com/about/licensors.td).
- 19. Jun-2013 vs Jun-2014: The average months supply of inventory is down -20% Accurate Valuations Group Jun-2013 vs. Jun-2014 5.6 -20 William Cobb 4.5 Jun-2014 Months Supply of Inventory ChangeJun-2013 % -1.1 Clarus MarketMetrics® 07/14/2014 Information not guaranteed. © 2014 - 2015 Terradatum and its suppliers and licensors (www.terradatum.com/about/licensors.td). 1/2 MLS: GBRAR Bedrooms: All All Construction Type: All1 Year Monthly SqFt: Bathrooms: Lot Size:All All Square Footage Period:All County: Property Types: : Residential East Baton Rouge Price:
- 20. Months Supply of Inventory Jun-2013 vs Jun-2014: The average months supply of inventory is down -20% William Cobb Accurate Valuations Group During MonthLast Day of Month MSI # Units For Sale # UC Units UC Avg DOMTime Period Jun-14 511 862,304 4.5 May-14 514 922,328 4.5 Apr-14 502 862,348 4.7 Mar-14 445 922,290 5.1 Feb-14 367 892,326 6.3 Jan-14 358 1002,330 6.5 Dec-13 246 902,348 9.5 Nov-13 300 912,475 8.2 Oct-13 358 822,497 7.0 Sep-13 341 932,492 7.3 Aug-13 382 872,430 6.4 Jul-13 430 882,431 5.7 Jun-13 429 762,412 5.6 Clarus MarketMetrics® 07/14/2014 Information not guaranteed. © 2014 - 2015 Terradatum and its suppliers and licensors (www.terradatum.com/about/licensors.td). 22/