Weekly Projects Update - w/e 10th February 2017
•
0 likes•556 views

AcuComm's weekly projects update - w/e 10th February 2017. For more information on our latest projects, visit our website: acucomm.net

Recommended
Recommended
More Related Content
More from AcuComm
More from AcuComm (20)
Recently uploaded
Recently uploaded (20)
Weekly Projects Update - w/e 10th February 2017
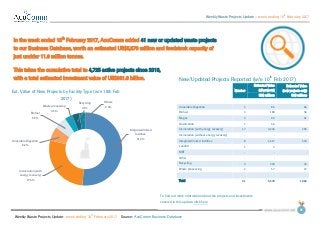
- 1. Weekly Waste Projects Update – week ending 10 th February 2017 Weekly Waste Projects Update: week ending 10 th February 2017 Source: AcuComm Business Database 01 2nd September 2016 New/Updated Projects Reported (w/e 10th Feb 2017) Number Estimated Value (all projects) Estimated Value (new projects only) US$ millionsUS$ millions Anaerobic Digestion 3 86 66 Biofuel 3 189 58 Biogas 3 94 31 Gasification 1 58 - Incineration (with energy recovery) 17 3,244 293 Incineration (without energy recovery) - - - Integrated/mixed facilities 8 1,517 550 Landfill 1 4 - MBT - - - Other - - - Recycling 3 320 33 Waste processing 2 57 37 Total 41 5,570 1,069 In the week ended 10th February 2017, AcuComm added 41 new or updated waste projects to our Business Database, worth an estimated US$5,570 million and feedstock capacity of just undder 11.6 million tonnes. This takes the cumulative total to 4,725 active projects since 2013, with a total estimated investment value of US$361.6 billion. To find out more information about the projects and investments covered in this update, click here Integrated/mixed facilities 51.4% Incineration (with energy recovery) 27.4% Anaerobic Digestion 6.2% Biofuel 5.5% Waste processing 3.5% Recycling 3.1% Others 2.9% Est. Value of New Projects by Facility Type (w/e 10th Feb 2017)
- 2. Weekly Waste Projects Update – week ending 10 th February 2017 Weekly Waste Projects Update: week ending 10 th February 2017 Source: AcuComm Business Database 02 New/Updated Projects Reported (w/e 10th Feb 2017) Number Capacity (tonnes) MW Anaerobic Digestion 3 795,037 6 Biofuel 3 991,020 47 Biogas 3 59,852 12 Gasification 1 19,426 52 Incineration (with energy recovery) 17 6,677,610 1,363 Incineration (without energy recovery) - - - Integrated/mixed facilities 8 1,775,751 202 Landfill 1 411,553 - MBT - - - Other - - - Recycling 3 472,740 2 Waste processing 2 358,878 - Total 41 11,561,867 1,684 The total estimated feedstock capacity of projects reported on in the past week is just under 11.6 million tonnes. WtE incineration was the largest category, accounting for just under 6.7 million tonnes. The total estimated power generation from these projects was 1,684 MW. WtE incineration was the largest category, accounting for 1,363 MW. Incineration (with energy recovery) 57.8% Integrated/mixed facilities 15.4% Biofuel 8.6% Others 18.3% Reported Capacity of Projects by Facility Type (w/e 10th Feb 2017) To find out more information about the projects and investments covered in this update, click here
- 3. Weekly Waste Projects Update – week ending 10 th February 2017 Weekly Waste Projects Update: week ending 10 th February 2017 Source: AcuComm Business Database 03 New Projects Reported by Waste Types (w/e 10th Feb 2017) Number Capacity (tonnes) MW Animal 1 374,437 2 Clinical - - - Construction/Demolition - - - e-Waste - - - Food - - - Gas 2 - 6 Glass - - - Hazardous 1 140,583 - Heat 1 132,720 2 Industrial 2 467,920 - Metals - - - MSW 13 3,235,739 262 Oil - - - Organic (general/unspecified) 4 2,425,521 421 Other - - - Paper - - - Plant biomass (non-waste) 1 748,324 34 Plant biomass (waste) 1 237,000 120 Plastics - - - Radioactive - - - Rubber - - - Sewage/wastewater 5 712,413 22 Wood 10 3,087,211 815 Total 41 11,561,867 1,684 MSW was the leading feedstock type reported on in the past week, accounting for an estimated 3.2 million tonnes, or 28.0% of the total. This was closely followed by wood with 3.1 million tonnes. MSW 28.0% Wood 26.7% Organic (general/unspecified) 21.0% Others 24.3% Reported Capacity of Projects by Waste Type (w/e 10th Feb 2017) To find out more information about the projects and investments covered in this update, click here
- 4. Weekly Waste Projects Update – week ending 10 th February 2017 Weekly Waste Projects Update: week ending 10 th February 2017 Source: AcuComm Business Database 04 New/Updated Projects, Country Coverage, (w/e 10th Feb 2017) Projects USA 11 UK 7 Finland 3 Netherlands 3 Sweden 2 Denmark 2 Others 13 Total 41 The leading country in the past week was the USA with 11 projects. This was followed by the UK with seven. 11 7 3 3 2 2 0 0 0 0 0 13 0 2 4 6 8 10 12 14 USA UK Finland Netherlands Sweden Denmark Others Reported Projects by Country (w/e 10th Feb 2017) To find out more information about the projects and investments covered in this update, click here
- 5. Weekly Waste Projects Update – week ending 10 th February 2017 Weekly Waste Projects Update: week ending 10 th February 2017 Source: AcuComm Business Database 05 Average Project Values by Facility Type US$ millions Anaerobic Digestion 25 Biofuel 118 Biogas 27 Gasification 144 Incineration (with energy recovery) 107 Incineration (without energy recovery) 52 Integrated/mixed facilities 195 Landfill 22 MBT 66 Other 81 Recycling 35 Waste processing 85 All Projects 77 Average Project Values by Feedstock Type US$ millions Animal 18 Clinical 30 Construction/Demolition 7 e-Waste 22 Food 20 Gas 76 Glass 14 Hazardous 68 Heat 39 Industrial 120 Metals 48 MSW 90 Oil 43 Organic (general/unspecified) 85 Other 55 Paper 74 Plant biomass (non-waste) 113 Plant biomass (waste) 79 Plastics 22 Radioactive 605 Rubber 39 Sewage/wastewater 43 Wood 89 All Projects 77 The average active waste project is worth US$77 million. There are naturally wide variations in average project value, due to the size, duration and complexity of different types of project. The figures on this page represent our latest estimates, based on data from 2013 to the current week. To find out more information about the projects and investments covered in this update, click here
- 6. Weekly Waste Projects Update – week ending 10 th February 2017 Weekly Waste Projects Update: week ending 10 th February 2017 Source: AcuComm Business Database 06 Top Five Projects, week ending 10th February 2017, by Estimated Value (US$ millions) Click the flag for more information on each project 1 UK 958 Construction of a >250 MW biomass plant. 2 UK 479 Construction of a 49 MW WtE facility. 3 Finland 433 Development of a bioproduct facility. 4 Sweden 338 Construction of recycling, biogas and thermal power plants. 5 Japan 266 Supply of a 2 MW heat recovery ORC unit for a steel plant. Top Five Projects, week ending 10th February 2017, by Reported Waste Capacity (tonnes) 1 UK 1,800,000 Construction of a 350 MW biomass facility. 2 UK 1,500,000 Construction of a >250 MW biomass plant. 3 UK 450,000 Construction of a 49 MW WtE facility. 4 Sweden 300,000 Construction of a new block at CHP facility. 5 Germany 300,000 Expansion of a waste-to-energy plant and new sludge incineration line. Top Five Projects, week ending 10th February 2017, by Reported Power Generation (MW) 1 UK 350 Construction of a 350 MW biomass facility. 2 UK 299 Construction of a >250 MW biomass plant. 3 Finland 200 Construction of a biomass CHP plant. 4 Sweden 150 Construction of a new block at CHP facility. 5 Denmark 120 Construction of a straw-fed biomass plant.
- 7. Weekly Waste Projects Update – week ending 10 th February 2017 Weekly Waste Projects Update: week ending 10 th February 2017 Source: AcuComm Business Database 07