
Recommended
More Related Content
What's hot
What's hot (20)
Similar to NATIONAL SERVICE SCHEME, NATIONAL GREEN CORPS, CLIMATE EDUCATION AND WASTE MANAGEMENT PROJECTS
Similar to NATIONAL SERVICE SCHEME, NATIONAL GREEN CORPS, CLIMATE EDUCATION AND WASTE MANAGEMENT PROJECTS (20)
More from W G Kumar
More from W G Kumar (6)
Recently uploaded
Recently uploaded (20)
NATIONAL SERVICE SCHEME, NATIONAL GREEN CORPS, CLIMATE EDUCATION AND WASTE MANAGEMENT PROJECTS
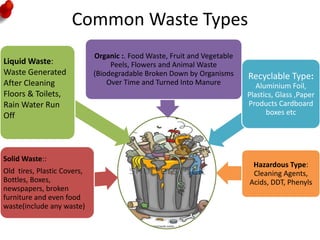
- 1. Common Waste Types Solid Waste:: Old tires, Plastic Covers, Bottles, Boxes, newspapers, broken furniture and even food waste(include any waste) Liquid Waste: Waste Generated After Cleaning Floors & Toilets, Rain Water Run Off Organic :. Food Waste, Fruit and Vegetable Peels, Flowers and Animal Waste (Biodegradable Broken Down by Organisms Over Time and Turned Into Manure Recyclable Type: Aluminium Foil, Plastics, Glass ,Paper Products Cardboard boxes etc Hazardous Type: Cleaning Agents, Acids, DDT, Phenyls
- 3. 1% Population Working on Waste
- 4. Tough Works: Collection and Disposal
- 5. Public Opinion in India
- 6. Public Opinion in India
- 7. CATEGORIES OF WASTE DISPOSAL 1. DILUTE AND DISPERSE (ATTENUATION) Throw it in the river / lake / sea Burn it Spreading Trash Thinly over Large Area to Minimize Impact Works for Sewage, Some Waste Chemicals, When Land-disposal is Not Available
- 8. Leaf Litter: Compostable • Every campus has leaf litter which can be composted into green manure. • We just burn it
- 9. 2. CONCENTRATE AND CONTAIN (ISOLATION) Waste dumps, landfills Mostly Solid Waste is Handled Like This
- 10. Solid Waste in Urban India
- 12. WHY WASTE MANAGEMENT? • Big Waste Generators • Motivation for ‘hands-on’ work. • Builds well-educated Consumers and Recyclers by BCC
- 13. Waste Classification Material not needed by owner, producer or processor: Garbage Classification • Domestic Waste • Pooja Waste • E-Waste • Construction Waste • Agricultural Waste • Food Waste • Medical Waste
- 14. 15 Total Population : 3.52 Crs Urban Population : 1.37 Crs % of Urban Population : 38.5 No of Urban Local Bodies- 68
- 15. Urbanization Trends in Telangana • Urbanization level Higher than country’s average • Hyderabad: 100 percent urbanized district- • Greater Hyderabad Municipal Corporation accounts to more than 60% of State urban Population
- 16. 91.32 % of urban HHs have access to toilets as compared to national figure of 81.4% Open Defecation is 8.68 % of HHs in urban areas lesser than the national average. Adilabad 25.87% has highest percentage followed by Mahbubnagar with 19.37% and the least is Hyderabad with 0.90% 51.54% of Telangana urban population are connected to Piped Sewerage networks(Under Ground Drainage) Inadequate Community and Public toilets Most of them have septic tanks and soak pits .Only 2 cities have existing Underground Drainage facility. UGD facility 4 towns are under implementation No septage or fecal sludge management facilities exist Sanitation Scenario- Telangana
- 17. Resident ial 70% Commer cial 25% Street Sweepin gs 5% SourcesParticulars 2014 Total waste generated (tons/day) in Telangana cities including GHMC 6287 MT Per capita waste generated (kg/day) 0.3-0.6kg Collection efficiency % 90% Door to door collection % 80% Source segregation % 20% Composting - Aerobic / Vermi 65% Scientific disposal 60% Expenditure per tonne on SWM Rs 500-1500 SWM Scenario Telangana
- 18. Swachh Telangana- Swachh Bharat Mission Vision “All cities and towns in Telangana become totally clean, sanitized, healthy, livable, ensuring and sustaining good public health and environmental outcomes for all citizens, with a special focus on hygienic and affordable sanitation for the urban poor and women”. Objectives Providing sanitation and household toilet facilities for urban households of all statutory towns in the state. To bring about Behavioral change by promoting cleanliness, hygiene and to eliminate open defecation Effective operation and maintenance of public & community toilets on sustainable basis To create an enabling environment for private sector participation for community public toilets & SWM Improved service delivery of Solid Waste Management services nd resource recovery in compliance to MSW Rules (M&H) 2000 19
- 19. TERI Projections on Waste Generation In India
- 20. Snap shots 21
- 21. Snap shots- Swachh Telangana Varvosatvam 22
- 22. Involving in Waste Management – Activity based programme
- 23. Start with activities focusing on Can be incorporated in any subjects like social science or after assembly exercise Can be incorporated as a project in physics and biology 1
- 24. Reduce : Waste Quantities Activity 1 Assessing Waste Quantity / Waste Audit: Identify type of waste generated Identify waste reduction opportunities Waste Audit: Walking through: Ground, common areas and assess waste generation practices. Assessment of dust bins status and placement. Mapping Waste Locations: Areas of waste and activities which produce waste. Categorise Waste : Recyclable and Non Recyclable Waste and their Quantities
- 25. Reduce : Waste Quantities . Assessing Dirty Areas: Monitoring Overflowing Dust Bins: Assessing Cleaning Timings: Assessing Clean Areas:
- 26. Reuse : Waste Usage Before Disposal Best out of Waste : • Dustbin Making with Used Material • Reusing Old Tyres for Sitting, Swings, Planting Indoor Plants • Source Segregation of waste • Keeping Bin Areas Clean and Hygienic
- 27. Reuse: Some Creative Projects Old tyres can be reused as pots and hang around in school. Bottle Base for Nursery Growth Used Water Bottles Holed and Inserted with Cloth for Creating Drip Irrigation of Potted Plants
- 28. Reuse : Use Waste Before Disposal Waste Swap : Share unused food, books, toys, sports items, unused CDs, electronic items, medicines amongst underprivileged who cannot afford Create and designate “ Zero Waste Corners” where people can freely deposit and collect unused items for their personal use. Organise waste swap campaign wherein unused items can be collected from community and donated to underprivileged or nursing homes
- 29. Reuse : Reduce Waste Recycle & Reuse Mela : Participate in Reuse and Recycle of Products . Swap products with one another on site Exchange or give for no profit reuse Design collected material to useful items & sell for profit Exhibit innovative arts and crafts, poster presentation, painting exhibition
- 31. Recycle: Save Environment Field trip. Visit Local Waste Dump Site/ Yard, Recycling Center, or Composting Facility Learn as to what is happening to waste Learn about lifecycle of waste and its impact on the environment. Post the field visit share experiences Interaction with Expert or Field Functionary: On waste, pollution prevention or recycling. Find out local public health official on waste management strategy adopted
- 32. Recycle: Save Energy Start a compost or worm bin • Composting helps us learn hands on: ecosystems, habitats, food webs and biodegradation. • Students experience how worms and other decomposers recycle fruits and vegetable scraps into compost. Compost can be used in garden! • Let green team students monitor waste segregation and the waste collection at lunchtime, take food waste to compost, and decide on how and where compost will be used.
- 33. Life Cycle Assessment • Life cycle assessment (LCA) is a methodology for assessing potential environmental impacts of a product or service across its entire life cycle, or cradle to grave It’s
- 35. Advantages: • An ‘eye opener’, providing an insight into systems and their alternatives • Can confirm expected environmental impacts and reveal completely unexpected impact Life Cycle Assessment
- 36. Food Waste Management Hierarchy 37 • Reduce over consumption Human consumption Animal feed Anaerobic digestion Composting Mechanical biological treatment (combined with landfill/incineration) Sanitary landfill equipped with methane collection Reduce overall environmental impact Main Benefits Notes Direct nutrient recovery Direct nutrient recovery Energy and indirect nutrient recovery Indirect nutrient recovery Reduce impact from landfill/ incineration Reduce methane emission High quality leftover food Medium quality leftover food Low quality food waste, high investment capacity Low-medium quality food waste Unsorted waste Unsorted waste, high investment capacityLess preferable Most preferable Reuse Recycle Recovery Reduce
- 38. Types of Waste in Rituals • Waste Flowers • Waste Coconuts • Waste Clothes • Waste Glass Material Photo frames • Waste Food • Pinda Pradhanam Waste • Spilled Oil
- 39. Waste Management in Temples • Composting of organic waste including flowers and other offerings from Kashi Vishwanath Temple by Banaras Hindu University • Shani Singnapur Temple Recycling Oil • Shirdi Sai Temple Composting Flower Waste
- 41. IIM Bangalore: Getting Waste Wise • "When I took charge as Dean Administration, I emphasized on re- building of toilets all over campus. • So, at an individual level, take oath today to keep campus clean and green“. Adopted a mile and cleaned it near IIMB campus. • Food wastage reduction plan: we collect leftover food and distribute to 70 children at Child Fund Association and food waste has reduced drastically from 800 to 400 kilos.
- 42. • Segregation of waste is another battle which we will win soon with help of Saahas. • We will continue 'Clean Drive' campaign; plant more trees under 'Go Green' campaign, set-up e-waste dustbins and segregate waste at source, which is a grave concern in our campus". • 99% segregation should happen at source and we have to point out ways to accomplish this. Reduction of non-biodegradable plastic sups, we would not entertain plastics at any food outlet in campus." IIM Bangalore: Getting Waste Wise
- 43. • Monitor each corridor/block and ensure waste segregation is happening at source. • Each one takes up responsibility is when we can achieve target of zero- waste campus. • Wet waste and dry leaves will be pulverized and converted to organic waste/manures. IIM Bangalore: Getting Waste Wise
- 44. • "By organizing institutional events or competitions, we can make e-waste collection fun. It can be exchanged for gifts and coupons in real time. Collected e-waste is recycled through authorized recyclers". • "e-waste disposal bins for each hostel and residential area; weekly / fortnightly collection, depending on amount generated; based on monthly collection data, one hostel would be declared a winner; annual winner shall be awarded, Individually, largest monthly contributor shall also be given gifts / coupons". • IIMB uses 75 lakh pages per year, for which 50 trees are cut every year. So, use soft copies/links to resources and encourage e-submissions. " IIM Bangalore: Getting Waste Wise
- 45. IIMB at present can manage 60% of waste but with new waste segregation plant, IIMB can manage 70-80% of waste.
- 46. Facts from The Story of Stuff • In the past three decades, one-third of the planet’s natural resources base have been consumed • We have very of less than 4% of our original forests left
- 47. WATER NOT DRINKABLE: Forty percent of waterways in the US have become undrinkable WE CONSUME MORE: The U.S. has 5% of the world’s population but consumes 30% of the world’s resources and creates 30% of the world’s wastes RATE OF CONSUMPTION MORE: If everybody consumed at U.S. rates, we would need 3 to 5 planets. CHEMICALS MORE: There are over 100,000 synthetic chemicals in commerce today CUMULATIVE IMPACT NOT KNOWN: Only a handful of synthetic chemicals have even been tested for human health impacts and NONE have been tested for synergistic health impacts TOXICS RELEASED: In the U.S., industry admits to releasing over 4 billion pounds of toxic chemicals a year EXCESS CONSUMPTION: The average U.S. person now consumes twice as much as they did 50 years ago. Facts from The Story of Stuff
- 48. MORE ADVERTISEMENTS: We each see more advertisements in one year than a people 50 years ago saw in a lifetime. LOW NATIONAL HAPPINESS: In the U.S. our national happiness peaked sometime in the 1950s. MORE HOURS IN SHOPPING: In the U.S., we spend 3–4 times as many hours shopping as our counterparts in Europe do. HOUSE SIZE DOUBLED: Average U.S. house size has doubled since the 1970s. MORE GARBAGE PERDAY: Each person in the United States makes 4 1/2 pounds of garbage a day. That is twice what we each made thirty years ago. EXCESS PRE PRODUCT INPUT WASTE: For every one garbage can of waste you put out on the curb, 70 garbage cans of waste were made upstream to make the junk in that one garbage can you put out on the curb. Facts from The Story of Stuff
- 49. • In the past three decades, one-third of the planet’s resources, its ‘natural wealth,’ has been consumed.” • “Ninety five to ninety eight percent of forests in the continental United States have been logged at least once since settlement by Europeans.” • “1 to 2 percent of original forests in the U.S. remain undisturbed.” Facts from The Story of Stuff
- 50. “Today, 40 percent of our nation’s rivers are unfishable, unswimmable, or Undrinkable” “The U.S. produced approximately 33% of the world’s waste with 4.6% of the world’s population” “In 2005, U.S. residents, businesses, and institutions produced more than 245 million tons of MSW, which is approximately 4.5 pounds of waste per person per day.” Facts from The Story of Stuff
- 51. “Of the more than 80,000 chemicals in commerce, only a small percentage of them have ever been screened for even one potential health effect, such as cancer, reproductive toxicity, developmental toxicity, or impacts on the immune system. Among the approximately 15,000 tested, few have been studied enough to correctly estimate potential risks from exposure. Even when testing is done, each chemical is tested individually rather than in the combinations that one is exposed to in the real world. In reality, no one is ever exposed to a single chemical, but to a chemical soup, the ingredients of which may interact to cause unpredictable health effects.” Facts from The Story of Stuff
- 52. “For Reporting Year 2005, 23,461 facilities reported to EPA’s TRI Program. These facilities reported 4.34 billion pounds of on-site and off-site disposal or other releases of the almost 650 toxic chemicals.” “Each of us sees more ads alone in one year than people of 50 years ago saw in an entire lifetime.” The average American saw 560 daily advertising messages in 1971 and by 1997 that number had increased to over 3,000 per day
- 53. Sanitation is Important than Independence Mahatma Gandhi 54
Editor's Notes
- An LCA looks at the movement of materials and energy through the system from the time you extract the raw materials from the environment, through the manufacture, use, and final disposal. Following the mass and energy should tell you what burdens the product or service place on the environment. Only those impacts which cannot be readily quantified, such as biodiversity, or odour, cannot be assessed using LCA.