statistical analysis of a balanced incomplete block design using spss
•Download as PPTX, PDF•
3 likes•2,913 views

Statistical analysis of a balanced incomplete block design using spss.

Recommended
Recommended
More Related Content
What's hot
What's hot (20)
Similar to statistical analysis of a balanced incomplete block design using spss
Similar to statistical analysis of a balanced incomplete block design using spss (9)
Recently uploaded
Recently uploaded (20)
statistical analysis of a balanced incomplete block design using spss
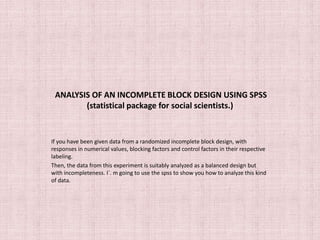
- 1. ANALYSIS OF AN INCOMPLETE BLOCK DESIGN USING SPSS (statistical package for social scientists.) If you have been given data from a randomized incomplete block design, with responses in numerical values, blocking factors and control factors in their respective labeling. Then, the data from this experiment is suitably analyzed as a balanced design but with incompleteness. I`. m going to use the spss to show you how to analyze this kind of data.
- 2. ANALYSIS OF BIBD USING SPSS. A B C D 1 10 12 14 2 14 16 12 3 15 17 10 4 18 20 13
- 3. ANALYSIS OF BIBD WITH SPSS
- 4. ANALYSIS OF A BIBD USING SPSS
- 5. ANALYSIS OF BIBD USING SPSS
- 6. ANALYSIS OF A BIBD USING SPSS.
- 7. ANALYSIS OF A BIBD USING SPSS
- 8. ANALYSIS OF A BIBD USING SPSS.
- 9. ANALYSIS OF A BIBD USING SPSS.
- 10. ANALYSIS OF A BIBD USING SPSS.
- 11. ANALYSIS OF A BIBD USING SPSS.
Editor's Notes
- The following was an experiment, conducted on a bee species to determine the best conditions under which their production is maximized, the blocking Numbered (1:4) represent different climatic conditions, they were 4. and the treatments (A:D) were the size of flower gardens put up in respective, climatic zones and within the bee hives.
- The first thing you need to do is to open the SPSS(Statistical package for social scientist), and define your variables in the variable view, as I will show you below. For numeric values define variable type as numeric, (2,0(two digits and allow 0 decimal places.)) For the treatments (A:D) enter variable type as string. For the blockings (1:4) enter the variable type as string and allow a length of 1 character.
- The next thing we need to do is enter the values for the responses, at the data view. I will prefer that you type row wise a you press the down key. ..
- Then enter the treatments in its ascending order, and that any treatment label should correspond to its respective reponse.
- Then, enter the labeling values for each blocking level. For any block label there corresponds a treatment value and a response value, they should be entered correspondingly.
- We are now done with the data entry process, we shall now analyze our data in order to draw statistical conclusions. STEPS ON HOW TO ANALYZE. with the spss window open point your mouse on analyze. go to generalized linear models. the click oon univariate. and select your variables to the sections as shown below.
- After pressing okay button you will get the following results.
- YOU CAN THEN DRAW YOU CONCLUSION. .I chose small sample of data just to demonstrate the processes, however given any volume of the data from a whole population the same steps can be used. You must be aware that spss ca n handle thousand volumes, of data.