
Recommended

Recommended
More Related Content
What's hot
What's hot (20)
Viewers also liked
Viewers also liked (14)
Similar to Food waste hotspots
Similar to Food waste hotspots (20)
More from Sustainable Brands
More from Sustainable Brands (20)
Recently uploaded
Recently uploaded (20)
Food waste hotspots
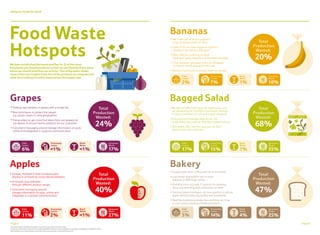
- 1. Using our Scale for Good Page 9Page 8 Food Waste Hotspots Grapes • Growers involved in trials to reduce pest/ disease in orchards by using natural predators • Increased crop utilisation through different product ranges • Consistent messaging around storage information on pack, online and integrated in customer communication Apples 11% Field Losses 2% Processing Losses <1% Retail Waste 27% Consumer Waste • We will not offer multi-buys on larger packs and are developing an intelligent promotion strategy to allow customers to 'mix and match' products • Introducing re-sealable bags across the range following a trial on shredded iceberg lettuce • Twin packs offer 'eat me now, eat me later' opportunities for customers Bagged Salad 17% Field Losses 15% Processing Losses 1% Retail Waste 35% Consumer Waste • We make use of all our suppliers’ crops to reduce waste on farm • State of the art data-logger to optimise conditions for banana transport • More effective ordering of stock leading to waste reduction at the ripening stage • ‘Love banana’ campaign training colleagues on how to handle bananas with care • Banana hammocks to protect them on display Bananas 2% Field Losses 7% Processing Losses 1% Retail Waste 10% Consumer Waste • Surplus bran from milling sent for animal feed • Less bread displayed in our in-store bakeries in 600 larger stores • Building more accurate IT systems for ordering stockand planning daily production in-store • Training bakery managers on new systems to reduce waste without reducing quality and availability • Real food website provides tips and hints on how to use surplus bread and bakery products Bakery 5% Field Losses 14% Processing Losses 4% Retail Waste 25% Consumer Waste 6% Field Losses <1% Processing Losses <1% Retail Waste 17% Consumer Waste We have established the waste profiles for 25 of the most frequently purchased products so that we can identify those areas where we should prioritise our activity. This infographic shows some of the key insights from five of the products we analysed and what we are doing to tackle waste across the supply web. Total Production Wasted: 24% Total Production Wasted: 40% Total Production Wasted: 68% Total Production Wasted: 20% Total Production Wasted: 47% • Trialling new varieties of grapes with a longer life • New techniques to protect the grapes e.g. plastic covers in rainy geographies • Fixing orders to get more fruit direct from our growers to our depots to ensure fresher products for our customers • Consistent messaging around storage information on pack, online and integrated in customer communication The percentages displayed have been rounded to the nearest whole number Consumer waste data is derived from published WRAP data and will be updated as new data is available from WRAP in 2014 More detail on our methodology can be found at www.tescoplc.com/society/resources