SlideShare a Scribd company logo
1 of 23
PRESENT VALUE = FUTURE VALUE / (1+r)n
YEARS CASHFLOWS PVIF @ 10%
(1/1+r)n
PVIF @ 12% PV OF CFS 10%
1 3375 1/1.1 = 0.909 1/1.12 =
0.893
3067.875
2 10375 1/(1.1)2
=0.826 1/(1.12)2
=
0.797
8569.75
3 11375 0.751 8542.625
25125 20180.25
(20000) (20000)
5125 180.25
1/(1+r)n
1/(1.15)2
= 0.756
YEARS CASHFLOWS PVIF / 10% PV OF CFS
1 3375 0.909 3067.875
2 3375 0.826 2789.1
3 3375 0.751 2534.625
2.486 8391.6
PVAF TABLES 2.486
PVAF/3yrs,10% = 2.486
STABLE CFS * PVAF/3yrs,10% = 3375 * 2.486 = 8390.25
07.06.2021
1) TRADITIONAL APPROACH:
A) PAY BACK PERIOD METHOD:
ACCEPT/REJECT CRITERION : ACCEPT IF PBP (YEARS) < LIFE OF THE PROJECT
REJECT IF PBP( YEARS) > LIFE OF THE PROJECT
CALCULATION OF PBP IF CASHFLOWS ARE STABLE
PBP = INITIAL OUTLAY OF THE PROJECT / ANNUAL CASHFLOW
1) GIVEN: INVESTMENT = Rs.100000
ANNUAL CASHFLOW = Rs.20000
PBP = INITIAL OUTLAY OF THE PROJECT / ANNUAL CASHFLOW
PBP = 5 YEARS
2) GIVEN : INVESTMENT = Rs.500000
PROFIT BEFORE TAX = Rs. 80000
LESS: TAX @50% = Rs.(40000)
PAT = Rs.40000
ADD: DEP @12% 500000= 60000
CFAT = 100000
PBP = INITIAL OUTLAY OF THE PROJECT / ANNUAL CASHFLOW
PBP = 500000/100000 = 5 YEARS
08.06.2021
SOL) INITIAL INVESTMENT IS RS.10000
STATEMENT SHOWING CALCULATION OF PBP
YEARS CFAT CUMULATIVE CFAT
1 2000 2000
2 4000 6000
3 3000 9000
4 2OOO
PBP = 3YEARS + (10000 – 9000) / 2000
PBP = 3YEARS +1000/2000
PBP = 3 YEARS + 0.5
PBP = 3.5 YEARS
OR
PBP = 3YEARS,[ (10000 – 9000) / 2000 ] * 12
PBP = 3YEARS, 1000/2000 *12
PBP = 3 YEARS, 6 MONTHS
Pb) Calculate PBP for the data below. Investment is Rs.15000.
YEARS CFAT
1 1000
2 2000
3 4000
4 5000
5 8000
SOL) STATEMENT SHOWING CALCULATION OF PBP
YEARS CFAT CUMULATIVE CFAT
1 1000 1000
2 2000 3000
3 4000 7000
4 5000 12000
5 8000
PBP = 4 Years + (15000 – 12000)/ 8000
PBP = 4 Years + 0.375
PBP = 4.375 years
PBP = 4 years and (0.375*12)
PBP = 4 years and 4.5 months
Pb) For the following 2 projects calculate PBP
Years Project X Project Y
0 -10000 -10000
1 4000 5000
2 4000 6000
3 2000 3000
Sol) Statement showing calculation of PBP for Project X
Years CFAT Cumulative CFAT
1 4000 4000
2 4000 8000
3 2000 10000
PBP for Project X is 3 Years
Statement showing calculation of PBP for Project Y
Years CFAT Cumulative CFAT
1 5000 5000
2 6000
3 3000
PBP = 1 Year + (10000 – 5000) / 6000
PBP = 1 year + 0.833
PBP = 1.833 Years
Decision: We accept Project Y over Project X because the calculated PBP for Project Y is lesser than the PBP of Project X.
B) RATE OF RETURN METHOD ( PERCENTAGE) OR ARR ACCOUNTING RATE OF RETURN
NET PROFIT
1) ARR = AVERAGE ANNUAL PROFITS AFTER DEP & TAXES / AVERAGE INVESTMENT * 100
AVG. ANNUAL PROFITS AFTER DEP & TAXES = Total Profits / NO. OF YEARS
AVG. INVESTMENT = Total Investment / 2
OR
AVG. INVESTMENT = (COST – SCRAP)/ 2 + WORKING CAPITAL + SCRAP VALUE
ACCEPT IF ARR > ROR
REJECT IF ARR < ROR
Pb) Determine ARR for machines A and B.
Particulars Machine A Machine B
Cost 56125 56125
Life 5 5
Salvage value ( Scrap) 3000 3000
Income Tax 55% 55%
Additional working capital 5000 6000
Years
1 3375 11375
2 5375 9375
3 7375 7375
4 9375 5375
5 11375 3375
Total Profits 36875 36875
SOL) ARR = AVERAGE ANNUAL PROFITS AFTER DEP & TAXES / AVERAGE INVESTMENT * 100
CALCULATION OF ARR FOR MACHINE A
AVERAGE ANNUAL PROFITS AFTER DEP & TAXES = 36875/ 5
AVERAGE ANNUAL PROFITS AFTER DEP & TAXES = 7375.
AVG. INVESTMENT = (COST – SCRAP)/ 2 + WORKING CAPITAL + SCRAP VALUE
= (56125 – 3000)/ 2 + 5000 + 3000
= 26563 + 8000 = 34563
ARR FOR MACHINE A = 7375 / 34563 * 100
ARR FOR MACHINE A = 21.33%
ARR FOR MACHINE B = 20.73 %
18.02.2022
Pb) The following cash flows are given below for projects X and Y. Investment in both the projects is Rs.3000. Calculate PBP and suggest.
Years Project X Project Y
1 1300 900
2 1100 900
3 900 900
4 640 900
5 640 900
Sol) Statement showing calculation of PBP for Project X
Years CFAT Cumulative CFAT
1 1300 1300
2 1100 2400
3 900
4 640
5 640
PBP = 2 years + (3000 – 2400) / 900
PBP = 2.67 Years. Calculation of PBP for Project Y
PBP = Investment / Annual CFAT
PBP = 3000 / 900
PBP = 3.33 Years.
Decision: Since PBP of Project X is lesser than the PBP of Project Y, we accept Project X.
Pb) Calculate ARR for the following project if ROR is 10%. Initial Investment is Rs. 40000
Years PAT( Profit After Tax)
1 10000
2 8000
3 6000
4 2000
ARR = Average annual net profit / Average Investment * 100
Average annual net profit = 26000 / 4 = Rs. 6500
Average Investment = Total Investment / 2
Average Investment = 40000 / 2 = 20000
ARR = 6500 / 20000 * 100
ARR = 32.5% > ROR
ARR > ROR
Decision: Accept the given project.
Discounted PBP: (DPBP)
Under this method, after calculating the present values for each year, then the cumulative CFAT are calculated. Then the procedure for
calculating DPBP is same as that of PBP.
Pb) Calculate
i) PBP
ii) DPBP
For the following data:
Cost = Rs. 50000
Life = 5 Years
Cost Of Capital = 10%
Years CFAT
1 5000
2 20000
3 30000
4 30000
5 10000
Sol)
Statement showing calculation of PBP
Years CFAT Cumulative CFAT
1 5000 5000
2 20000 25000
3 30000
4 30000
5 10000
PBP = 2 years + (50000 – 250000) / 30000
PBP = 2.833 Years.
Statement showing calculation of DPBP
Years CFAT PVIF @ 10% Discounted
CFAT or Present
Value of CFAT
Cumulative
Discounted
CFAT
1 5000 0.909 4545 4545
2 20000 0.826 16520 21065
3 30000 0.751 22530 43595
4 30000 0.683 20490
5 10000 0.621 6210
DPBP = 3 Years + (50000 – 43595) / 20490
DPBP = 3.313 Years.
Pb) Calculate DPBP for the following project at COC of 8%. Investment is Rs.150000.
Years CFAT
1 50000
2 75000
3 125000
4 130000
5 80000
Sol)
Years CFAT PVIF @ 8% Discounted CFAT Cumulative CFAT
1 50000 0.926 46300 46300
2 75000 0.857 64275 110575
3 125000 0.794 99250
4 130000 0.735 95550
5 80000 0.681 54480
DPBP = 2 Years + (150000 – 110575) / 99250
DPBP = 2.397.
21.02.2022
DISCOUNTED TECHNIQUES OF CAPITAL BUDGETING:
1) Calculate Discounted Payback Period if the cash flows are Rs.50000 for a life of 10 years with initial investment of Rs.200000. ROR is
at 12%
1 / (1.12)n
STATEMENT SHOWING CALCULATION OF DPBP
YEARS CFS PVIF @ 12% DISCOUNTED CASH
FLOWS/ PV OF
CASHFLOWS
CUMULATIVE
CFS
1 50000 0.8929 44645 44645
2 50000 0.7972 39860 84505
3 50000 0.7118 35590 120095
4 50000 0.6355 31775 151870
5 50000 0.5674 28370 180240
6 50000 0.5066 25330
7 50000 0.4523 22615
8 50000 0.4039 20195
9 50000 0.3606 18030
10 50000 0.3220 16100
DPBP = 5 YEARS + (200000 – 180240)/25330
DPBP = 5 YEARS + 0.780
PBP = 5.78 YEARS
SOL) STATEMENT SHOWING CALCULATION OF PBP USING TRADITIONAL METHOD
YEARS ANNUAL CFS CUMULATIVE CFS
1 5000 5000
2 20000 25000
3 30000
4 30000
5 10000
PBP = 2 YEARS + (50000 – 25000)/ 30000
PBP = 2.83 YEARS
STATEMENT SHOWING CALCULATION OF DPBP
YEARS ANNUAL CFS PVIF @ 10 % PV OF CFS CUMULATIVE PV
OF CFS
1 5000 0.909 4545 4545
2 20000 0.826 16520 21065
3 30000 0.751 22530 43595
4 30000 0.683 20490
5 10000 0.621 6210
PBP = 3 YEARS + (50000 – 43595)/ 20490
PBP = 3.312 YEARS
2) NET PRESENT VALUE (NPV): NPV is a time value of money approach. In evaluating the investment proposal. Under this method, all cash
inflows and outflows are converted to their present values and then the technique of NPV is applied.
STEP WISE CALCULATION:
STEP 1 : DETERMINE THE COC (ROR)
STEP 2 : CALCULATE PV OF CASHFLOWS
STEP 3: TAKE TOTAL PV OF cash inflows
STEP 4 : CALCULATE NPV =
TPV OF CIFS – TPV OF COFS
STEP 5: ACCEPT THE PROPOSAL IF NPV IS POSITIVE;
REJECT THE PROPOSAL IF NPV IS NEGATIVE.
Pb) Calculate NPV for Projects X and Y and suggest which project is feasible if COC is 10%. Cost of Project X is Rs.20000 and cost of
Project Y is Rs.30000.
YEARS PROJECT X PROJECT Y
1 5000 20000
2 10000 10000
3 10000 5000
4 3000 3000
5 2000 2000
5( SCRAP) 1000 2000
SOL)
STATEMENT SHOWING CALCULATION OF NPV FOR PROJECT X COST: Rs. 20000
YEARS CFS PVIF @ 10% PV OF Cash Inflows
1 5000 0.909 4545
2 10000 0.826 8260
3 10000 0.751 7510
4 3000 0.683 2049
5 2000 0.621 1242
5( SCRAP VALUE) 1000 0.621 621
TOTAL OF PV OF Cash Inflows
LESS: TOTAL PV OF COFS PVIF for Year 0 is always = 1
24227
(20000)
NET PRESENT VALUE 4227
STATEMENT SHOWING CALCULATION OF NPV FOR PROJECT Y COST: Rs. 30000
YEARS CFS PVIF @ 10% PV OF CFS
1 20000 0.909 18180
2 10000 0.826 8260
3 5000 0.751 3755
4 3000 0.683 2049
5 2000 0.621 1242
5( SCRAP VALUE) 2000 0.621 1242
TOTAL OF PV OF CFS
LESS: TOTAL PV OF COFS
NET PRESENT VALUE
34728
(30000)
4728
Decision: We accept Project Y because NPV of Project Y is Higher than the NPV of Project X.
Pb) Calculate NPV of Project A at 12% COC for the following Cash Flows if the initial Investment is Rs.16200.
YEARS CASH INFLOWS
1 8000
2 7000
3 6000
Sol)
Years Cash Inflows PVIF @ 12% Present Value of Cash
Inflows
1 8000 0.893 7144
2 7000 0.797 5579
3 6000 0.712 4272
Total Present Value of Cash Inflow
(-) Total Present Value Of Cash Outflow
NPV
16995
(16200)
795
Decision: Accept the given Project A as its NPV is Positive.
PROFITABILITY Index/ BENEFITR COST RATIO.
It is a time adjusted method for evaluating the investment proposal. It is termed as Benefit Cost Ratio because, numerator measures benefits
and denominator measures cost. PI can be measured in a) per rupee method (b) in percentage.
a) PI ( Per Rupee) =Total PV of Cash inflows / Total PV of Cash outflows.
Accept if PI > 1 ; Reject if PI < 1
b) PI (Percentage) = Total PV of Cash inflows / Total PV of Cash outflows * 100
Accept if PI > 100 ; Reject if PI < 100
Pb) Initial Cash Outlay is Rs.25000
Years Cash Inflows
1 10000
2 7500
3 12500
4 5000
Discount Factor is 10%
Sol)
Years Cash inflows PVIF @ 10% PV of Cash Inflows
1 10000 0.909 9090
2 7500 0.826 6195
3 12500 0.751 9388
4 5000 0.683 3415
Total PV of Cash
Inflows
28088
PI( Per Rupee) =Total PV of Cash inflows / Total PV of Cash outflows.
PI = 28088 / 25000
PI = 1.123
PI> 1.
Therefore we accept the project.
Pb) The management of Z Ltd. Proposes to invest Rs.8000 in a project which will give earnings for 5 years as below:
Years Cash flows
1 3000
2 4000
3 3000
4 2000
5 2000
Suggest whether project is worthwhile to accept using
a) DPBP
b) NPV
c) PI
Discount rate is 10 %
Sol)
a) Statement showing calculation of DPBP
Years Cash
inflows
PVIF @
10%
PV of Cash
Inflows
Cumulative
Cash Inflows
1 3000 0.909 2727 2727
2 4000 0.826 3304 6031
3 3000 0.751 2253
4 2000 0.683 1366
5 2000 0.621 1242
DPBP = 2 Years + (8000 – 6031) / 2253
DPBP = 2.873 Years
b) Statement showing calculation of NPV
Years Cash
inflows
PVIF @
10%
PV of Cash
Inflows
1 3000 0.909 2727
2 4000 0.826 3304
3 3000 0.751 2253
4 2000 0.683 1366
5 2000 0.621 1242
Total PV of Cash inflows
Less: Total PV of Cash Outflow
NPV
10892
(8000)
2892
c) PI ( Per Rupee) =Total PV of Cash inflows / Total PV of Cash outflows.
PI = 10892 / 8000
PI = 1.36
Decision: DPBP < Life of Project. Therefore, we accept the proposal
NPV is positive, therefore we accept the proposal
PI > 1, therefore, we accept the proposal.
Under the given 3 techniques the proposal should be accepted. Thus, the proposal accepted.
INTERNAL RATE OF RETURN.
This method is also known as Yield method. IRR is a rate which actually equates the PV of cash inflows with
PV of cash outflows. This is the rate actually earned by the project. Under this method, the project is
accepted if IRR > COC or Cut-off rate and
rejected if IRR < COC or Cut-off rate.
IRR is calculated using trial and error method.
IRR = Lower Rate +(HPV of Cash Inflows – Initial Investment) / (HPV of Cash Inflows - LPV of Cash Inflows) * Difference in Rate.
Pb) From the following information relating to two projects X and Y, calculate IRR and state which project is better.
Particulars Project X Project Y
Life 10Years 8 Years
Cost Rs. 180000 200000
Savings( Annual Cash flows) Rs. 30000 40000
Sol)
Statement showing calculation of PV of Cash inflows for Project X
Years Cash inflows PVIF @10% PVIF @ 15%
1 30000 0.909 0.870
2 30000 0.826 0.756
3 30000 0.751 0.658
4 30000 0.683 0.572
5 30000 0.621 0.497
6 30000 0.564 0.432
7 30000 0.513 0.376
8 30000 0.467 0.327
9 30000 0.424 0.284
10 30000 0.386 0.247
PVAF @ 10% for 10
Years = 6.145
PVAF @ 15% for 10
years = 5.019
TPV of Cash Inflows @ 10% = 6.145 * 30000 = 184350 (HPV)
TPV of Cash Inflows @ 15% = 5.019 * 30000 = 150570 (LPV)
IRR = Lower Rate +(HPV of Cash Inflows – Initial Investment) / (HPV of Cash Inflows - LPV of Cash Inflows) * Difference in Rate.
IRR = 10 + (184350 – 180000) / (184350 – 150570) * 5
IRR = 10 + (4350 / 33780) * 5
IRR = 10 + (0.128 *5)
IRR = 10 + 0.64
IRR = 10.64 % for Project X
Statement showing calculation of PV of Cash inflows for Project Y
Years Cash inflows PVIF @10% PVIF @ 15%
1 40000 0.909 0.870
2 40000 0.826 0.756
3 40000 0.751 0.658
4 40000 0.683 0.572
5 40000 0.621 0.497
6 40000 0.564 0.432
7 40000 0.513 0.376
8 40000 0.467 0.327
PVAF @ 10% for 8
years= 5.335
PVAF @ 15% for 8
years = 4.487
TPV of Cash Inflows @ 10% = 5.335 * 40000 = 213400 (HPV)
TPV of Cash Inflows @ 15% = 4.487 * 40000 = 179480 (LPV)
IRR = Lower Rate + (HPV of Cash Inflows – Initial Investment) / (HPV of Cash Inflows - LPV of Cash Inflows) * Difference in Rate.
IRR = 10 +(213400 – 200000) / (213400 - 179480) * 5
IRR = 10 + (13400 / 33920)* 5
IRR = 10 + (0.395* 5)
IRR = 10 + 1.975
IRR = 11.975 for Project Y
Decision: IRR of Project Y is > than the IRR of Project X, therefore we accept Project Y.
Pb) Calculate IRR for the investment and suggest about its acceptability if cost of capital is 12%
Years Cash flows
0 25000
1 10000
2 7500
3 12500
4 5000
Sol) Statement showing calculation of IRR using Trial and Error method
Years Cash inflows PVIF @ 12% PV of Cash
inflows
PVIF @ 18% PV of Cash
inflows
1 10000 0.893 8930 0.847 8470
2 7500 0.797 5978 0.718 5385
3 12500 0.712 8900 0.609 7613
4 5000 0.636 3180 0.516 2580
26988 (HPV) 24048 (LPV)
IRR = Lower Rate + (HPV of Cash Inflows – Initial Investment) / (HPV of Cash Inflows - LPV of Cash Inflows) * Difference in Rate.
IRR = 12% + (26988 – 25000) / (26988 – 24048) * 6
IRR = 12 % + (1988 / 2940) * 6
IRR = 12% + (0.676) * 6
IRR = 12 % + 4.056
IRR = 16.056 %
Decision: Since IRR > COC that is 16.056% > 12 %, we accept the investment proposal.
Pb) From the following information calculate NPV, PI, IRR of the project @ discount rate of 10%.
Years Cash Flows
0 50000
1 20000
2 15000
3 25000
4 10000
Sol) Statement showing calculation of NPV and PI
Years Cash inflows PVIF @ 10 % PV of cash inflows
1 20000 0.909 18180
2 15000 0.826 12390
3 25000 0.751 18775
4 10000 0.683 6830
Total PV of Cash inflows
Less: Total PV of Cash outflows
NPV
PI = Total PV of Cash inflow / Total PV of Cash outflows
PI =
56175
(50000)
6175
56175 / 50000
1.1235
Statement showing calculation of IRR using Trial and Error Method
Years Cash inflows PVIF @ 15% PV of cash
inflows
PVIF @ 18
%
PV of cash
inflows
1 20000 0.870 17400 0.847 16940
2 15000 0.756 11340 0.718 10770
3 25000 0.658 16450 0.609 15225
4 10000 0.572 5720 0.516 5160
50910 (HPV) 48095 (LPV)
IRR = Lower Rate + (HPV of Cash Inflows – Initial Investment) / (HPV of Cash Inflows - LPV of Cash Inflows) * Difference in Rate.
IRR = 15 + (50910-50000) / 50910 – 48095) * 3
IRR = 15 + (910 / 2815) * 3
IRR = 15 + (0.3232) * 3
IRR = 15 + 0.97
IRR = 15.097 %
Notes to be considered:
Traditional methods Discounted methods
Methods Inflows to be
considered
Methods Inflows to be
considered
Payback period method CFAT Discounted Payback
period method
CFAT
Accounting rate of return
method
PAT Net Present Value Method CFAT
Internal rate of return
method
CFAT
Profitability Index method CFAT
Particulars Rs
Earnings before interest and tax (EBIT) XXXX
Less: Interest (XXX)
Earnings before tax XXX
Less: Tax (XXX)
Earnings after Tax / Profit after Tax (PAT) XXX
Add: Depreciation XXX
CFAT XXXX
Depreciation = (Cost of the project – Scrap Value) / Life of the Project.
Pb) A chemical company, is considering to invest in a project that costs Rs.400000. The estimated salvage value is null. Tax rate is 15%. The
company uses straight line method for calculating depreciation. The expected cash flows before depreciation and tax are as below:
Years Expected cash flows before depreciation and tax
1 100000
2 150000
3 200000
4 250000
5 300000
Calculate NPV and suggest whether to accept or reject the proposal.
Sol) Depreciation = (Cost of the project – Scrap Value) / Life of the Project
Depreciation = (400000 – 0) / 5
Depreciation = 80000
Years Expected cash
flows before
depreciation and
tax
Less:
Depreciation
(Rs.80000)
EBIT Less: Tax
@ 15%
EAT / PAT Add:
Depreciation
CFAT
1 100000 (80000) 20000 (3000) 17000 80000 97000
2 150000 (80000) 70000 (10500) 59500 80000 139500
3 200000 (80000) 120000 (18000) 102000 80000 182000
4 250000 (80000) 170000 (25500) 144500 80000 224500
5 300000 (80000) 220000 (33000) 187000 80000 267000
Statement showing calculation of NPV
Years CFAT PVIF @ 10 % PV of Cash Inflows
1 97000 0.909 88173
2 139500 0.826 115227
3 182000 0.751 136682
4 224500 0.683 153334
5 267000 0.621 165807
Total PV of Cashinflows
Less: Total PV of Cash outflows
NPV
659223
(400000)
259223
Decision: Accept the given investment proposal because NPV is Positive.

More Related Content

What's hot

The Pearl Business Hotel Marketing Plan
The Pearl Business Hotel Marketing PlanThe Pearl Business Hotel Marketing Plan
The Pearl Business Hotel Marketing PlanSandhya Pattanaik
 
How to increase market share of taj hotels
How to increase market share of taj hotelsHow to increase market share of taj hotels
How to increase market share of taj hotelsAnshuman Mahapatra
 
Philea-Resort-Spa-Malaysia-Intern-Report
Philea-Resort-Spa-Malaysia-Intern-ReportPhilea-Resort-Spa-Malaysia-Intern-Report
Philea-Resort-Spa-Malaysia-Intern-ReportShristi Karki
 
Human resource at taj palace
Human resource at taj palaceHuman resource at taj palace
Human resource at taj palaceLal Sivaraj
 
Hotel Industry Project
Hotel Industry ProjectHotel Industry Project
Hotel Industry ProjectSai Youdhister
 
Talent management across the generations
Talent management across the generationsTalent management across the generations
Talent management across the generationsRoffey Park
 
On the job training report
On the job training reportOn the job training report
On the job training reportIITTM NOIDA
 
Business plan enreach hotel
Business plan enreach hotelBusiness plan enreach hotel
Business plan enreach hotelJanuarika Rika
 
PT ESI PF & Other Payroll statutory compliances
PT ESI PF & Other Payroll statutory compliances PT ESI PF & Other Payroll statutory compliances
PT ESI PF & Other Payroll statutory compliances Ajay K Reddy
 
5 more interest formulas
5 more interest formulas5 more interest formulas
5 more interest formulasMohsin Siddique
 
AB - Completion of Probationary Period Letter
AB - Completion of Probationary Period LetterAB - Completion of Probationary Period Letter
AB - Completion of Probationary Period LetterAmanda Jane Beavan
 

What's hot (20)

The Pearl Business Hotel Marketing Plan
The Pearl Business Hotel Marketing PlanThe Pearl Business Hotel Marketing Plan
The Pearl Business Hotel Marketing Plan
 
How to increase market share of taj hotels
How to increase market share of taj hotelsHow to increase market share of taj hotels
How to increase market share of taj hotels
 
TAJ GROUP OF HOTELS
TAJ GROUP OF HOTELS TAJ GROUP OF HOTELS
TAJ GROUP OF HOTELS
 
Philea-Resort-Spa-Malaysia-Intern-Report
Philea-Resort-Spa-Malaysia-Intern-ReportPhilea-Resort-Spa-Malaysia-Intern-Report
Philea-Resort-Spa-Malaysia-Intern-Report
 
Human resource at taj palace
Human resource at taj palaceHuman resource at taj palace
Human resource at taj palace
 
Hotel Industry Project
Hotel Industry ProjectHotel Industry Project
Hotel Industry Project
 
Talent management across the generations
Talent management across the generationsTalent management across the generations
Talent management across the generations
 
On the job training report
On the job training reportOn the job training report
On the job training report
 
10. depreciation
10. depreciation10. depreciation
10. depreciation
 
iti report
iti reportiti report
iti report
 
Business plan enreach hotel
Business plan enreach hotelBusiness plan enreach hotel
Business plan enreach hotel
 
PT ESI PF & Other Payroll statutory compliances
PT ESI PF & Other Payroll statutory compliances PT ESI PF & Other Payroll statutory compliances
PT ESI PF & Other Payroll statutory compliances
 
LEAVE POLICY
LEAVE POLICYLEAVE POLICY
LEAVE POLICY
 
Raghavendra
RaghavendraRaghavendra
Raghavendra
 
5 more interest formulas
5 more interest formulas5 more interest formulas
5 more interest formulas
 
Novotel
Novotel Novotel
Novotel
 
Itc hotels
Itc hotelsItc hotels
Itc hotels
 
exitpolicy
exitpolicyexitpolicy
exitpolicy
 
Financial ration analysis assignment
Financial ration analysis   assignmentFinancial ration analysis   assignment
Financial ration analysis assignment
 
AB - Completion of Probationary Period Letter
AB - Completion of Probationary Period LetterAB - Completion of Probationary Period Letter
AB - Completion of Probationary Period Letter
 

Similar to Capital Budgeting.docx

Capital budgeting
Capital budgetingCapital budgeting
Capital budgetingAmeen San
 
233665105 eng-g-economy
233665105 eng-g-economy233665105 eng-g-economy
233665105 eng-g-economyBryan Yu
 
Chapter 9.Risk and Managerial Options in Capital Budgeting
Chapter 9.Risk and Managerial Options in Capital BudgetingChapter 9.Risk and Managerial Options in Capital Budgeting
Chapter 9.Risk and Managerial Options in Capital BudgetingZahraMirzayeva
 
capital budgeting In financial management
capital budgeting In financial managementcapital budgeting In financial management
capital budgeting In financial managementssuserc3bdcc
 
Capital budegting project and risk analysis
Capital budegting  project and risk analysisCapital budegting  project and risk analysis
Capital budegting project and risk analysissanthoshsanthuse
 
Chapter 18 - Sensitivity Analysis.pdf
Chapter 18 - Sensitivity Analysis.pdfChapter 18 - Sensitivity Analysis.pdf
Chapter 18 - Sensitivity Analysis.pdf18010YeashRahman
 
Aminullah assagaf time value of money
Aminullah assagaf time value of moneyAminullah assagaf time value of money
Aminullah assagaf time value of moneyAminullah Assagaf
 
Aminullah assagaf time value of money
Aminullah assagaf time value of moneyAminullah assagaf time value of money
Aminullah assagaf time value of moneyAminullah Assagaf
 
Aminullah assagaf time value of money
Aminullah assagaf time value of moneyAminullah assagaf time value of money
Aminullah assagaf time value of moneyAminullah Assagaf
 
19L2 1114 2018 RealOptions Answers.doc
19L2 1114 2018 RealOptions Answers.doc19L2 1114 2018 RealOptions Answers.doc
19L2 1114 2018 RealOptions Answers.docssuser7ba432
 
Production & Operation Management Chapter6[1]
Production & Operation Management Chapter6[1]Production & Operation Management Chapter6[1]
Production & Operation Management Chapter6[1]Hariharan Ponnusamy
 

Similar to Capital Budgeting.docx (20)

Capital budgeting
Capital budgetingCapital budgeting
Capital budgeting
 
Capital-Budgeting_Grp1-v2.ppt
Capital-Budgeting_Grp1-v2.pptCapital-Budgeting_Grp1-v2.ppt
Capital-Budgeting_Grp1-v2.ppt
 
Fm
FmFm
Fm
 
Capital budgeting
Capital budgetingCapital budgeting
Capital budgeting
 
Capital budgeting
Capital budgetingCapital budgeting
Capital budgeting
 
233665105 eng-g-economy
233665105 eng-g-economy233665105 eng-g-economy
233665105 eng-g-economy
 
CF _Final.docx
CF _Final.docxCF _Final.docx
CF _Final.docx
 
Capital budgeting -2
Capital budgeting -2Capital budgeting -2
Capital budgeting -2
 
Chapter 9.Risk and Managerial Options in Capital Budgeting
Chapter 9.Risk and Managerial Options in Capital BudgetingChapter 9.Risk and Managerial Options in Capital Budgeting
Chapter 9.Risk and Managerial Options in Capital Budgeting
 
Capital budgeting
Capital budgetingCapital budgeting
Capital budgeting
 
capital budgeting In financial management
capital budgeting In financial managementcapital budgeting In financial management
capital budgeting In financial management
 
Capital budegting project and risk analysis
Capital budegting  project and risk analysisCapital budegting  project and risk analysis
Capital budegting project and risk analysis
 
Chapter 18 - Sensitivity Analysis.pdf
Chapter 18 - Sensitivity Analysis.pdfChapter 18 - Sensitivity Analysis.pdf
Chapter 18 - Sensitivity Analysis.pdf
 
Text solu2
Text solu2Text solu2
Text solu2
 
Aminullah assagaf time value of money
Aminullah assagaf time value of moneyAminullah assagaf time value of money
Aminullah assagaf time value of money
 
Aminullah assagaf time value of money
Aminullah assagaf time value of moneyAminullah assagaf time value of money
Aminullah assagaf time value of money
 
Aminullah assagaf time value of money
Aminullah assagaf time value of moneyAminullah assagaf time value of money
Aminullah assagaf time value of money
 
19L2 1114 2018 RealOptions Answers.doc
19L2 1114 2018 RealOptions Answers.doc19L2 1114 2018 RealOptions Answers.doc
19L2 1114 2018 RealOptions Answers.doc
 
Production & Operation Management Chapter6[1]
Production & Operation Management Chapter6[1]Production & Operation Management Chapter6[1]
Production & Operation Management Chapter6[1]
 
Chapter6[1]
Chapter6[1]Chapter6[1]
Chapter6[1]
 

Recently uploaded

Cost estimation approach: FP to COCOMO scenario based question
Cost estimation approach: FP to COCOMO scenario based questionCost estimation approach: FP to COCOMO scenario based question
Cost estimation approach: FP to COCOMO scenario based questionSneha Padhiar
 
Robotics-Asimov's Laws, Mechanical Subsystems, Robot Kinematics, Robot Dynami...
Robotics-Asimov's Laws, Mechanical Subsystems, Robot Kinematics, Robot Dynami...Robotics-Asimov's Laws, Mechanical Subsystems, Robot Kinematics, Robot Dynami...
Robotics-Asimov's Laws, Mechanical Subsystems, Robot Kinematics, Robot Dynami...Sumanth A
 
Novel 3D-Printed Soft Linear and Bending Actuators
Novel 3D-Printed Soft Linear and Bending ActuatorsNovel 3D-Printed Soft Linear and Bending Actuators
Novel 3D-Printed Soft Linear and Bending ActuatorsResearcher Researcher
 
ROBOETHICS-CCS345 ETHICS AND ARTIFICIAL INTELLIGENCE.ppt
ROBOETHICS-CCS345 ETHICS AND ARTIFICIAL INTELLIGENCE.pptROBOETHICS-CCS345 ETHICS AND ARTIFICIAL INTELLIGENCE.ppt
ROBOETHICS-CCS345 ETHICS AND ARTIFICIAL INTELLIGENCE.pptJohnWilliam111370
 
Engineering Drawing section of solid
Engineering Drawing     section of solidEngineering Drawing     section of solid
Engineering Drawing section of solidnamansinghjarodiya
 
SOFTWARE ESTIMATION COCOMO AND FP CALCULATION
SOFTWARE ESTIMATION COCOMO AND FP CALCULATIONSOFTWARE ESTIMATION COCOMO AND FP CALCULATION
SOFTWARE ESTIMATION COCOMO AND FP CALCULATIONSneha Padhiar
 
Input Output Management in Operating System
Input Output Management in Operating SystemInput Output Management in Operating System
Input Output Management in Operating SystemRashmi Bhat
 
Research Methodology for Engineering pdf
Research Methodology for Engineering pdfResearch Methodology for Engineering pdf
Research Methodology for Engineering pdfCaalaaAbdulkerim
 
Prach: A Feature-Rich Platform Empowering the Autism Community
Prach: A Feature-Rich Platform Empowering the Autism CommunityPrach: A Feature-Rich Platform Empowering the Autism Community
Prach: A Feature-Rich Platform Empowering the Autism Communityprachaibot
 
"Exploring the Essential Functions and Design Considerations of Spillways in ...
"Exploring the Essential Functions and Design Considerations of Spillways in ..."Exploring the Essential Functions and Design Considerations of Spillways in ...
"Exploring the Essential Functions and Design Considerations of Spillways in ...Erbil Polytechnic University
 
Earthing details of Electrical Substation
Earthing details of Electrical SubstationEarthing details of Electrical Substation
Earthing details of Electrical Substationstephanwindworld
 
High Voltage Engineering- OVER VOLTAGES IN ELECTRICAL POWER SYSTEMS
High Voltage Engineering- OVER VOLTAGES IN ELECTRICAL POWER SYSTEMSHigh Voltage Engineering- OVER VOLTAGES IN ELECTRICAL POWER SYSTEMS
High Voltage Engineering- OVER VOLTAGES IN ELECTRICAL POWER SYSTEMSsandhya757531
 
Robotics Group 10 (Control Schemes) cse.pdf
Robotics Group 10  (Control Schemes) cse.pdfRobotics Group 10  (Control Schemes) cse.pdf
Robotics Group 10 (Control Schemes) cse.pdfsahilsajad201
 
Stork Webinar | APM Transformational planning, Tool Selection & Performance T...
Stork Webinar | APM Transformational planning, Tool Selection & Performance T...Stork Webinar | APM Transformational planning, Tool Selection & Performance T...
Stork Webinar | APM Transformational planning, Tool Selection & Performance T...Stork
 
THE SENDAI FRAMEWORK FOR DISASTER RISK REDUCTION
THE SENDAI FRAMEWORK FOR DISASTER RISK REDUCTIONTHE SENDAI FRAMEWORK FOR DISASTER RISK REDUCTION
THE SENDAI FRAMEWORK FOR DISASTER RISK REDUCTIONjhunlian
 
Comprehensive energy systems.pdf Comprehensive energy systems.pdf
Comprehensive energy systems.pdf Comprehensive energy systems.pdfComprehensive energy systems.pdf Comprehensive energy systems.pdf
Comprehensive energy systems.pdf Comprehensive energy systems.pdfalene1
 
Mine Environment II Lab_MI10448MI__________.pptx
Mine Environment II Lab_MI10448MI__________.pptxMine Environment II Lab_MI10448MI__________.pptx
Mine Environment II Lab_MI10448MI__________.pptxRomil Mishra
 
Ch10-Global Supply Chain - Cadena de Suministro.pdf
Ch10-Global Supply Chain - Cadena de Suministro.pdfCh10-Global Supply Chain - Cadena de Suministro.pdf
Ch10-Global Supply Chain - Cadena de Suministro.pdfChristianCDAM
 
11. Properties of Liquid Fuels in Energy Engineering.pdf
11. Properties of Liquid Fuels in Energy Engineering.pdf11. Properties of Liquid Fuels in Energy Engineering.pdf
11. Properties of Liquid Fuels in Energy Engineering.pdfHafizMudaserAhmad
 
List of Accredited Concrete Batching Plant.pdf
List of Accredited Concrete Batching Plant.pdfList of Accredited Concrete Batching Plant.pdf
List of Accredited Concrete Batching Plant.pdfisabel213075
 

Recently uploaded (20)

Cost estimation approach: FP to COCOMO scenario based question
Cost estimation approach: FP to COCOMO scenario based questionCost estimation approach: FP to COCOMO scenario based question
Cost estimation approach: FP to COCOMO scenario based question
 
Robotics-Asimov's Laws, Mechanical Subsystems, Robot Kinematics, Robot Dynami...
Robotics-Asimov's Laws, Mechanical Subsystems, Robot Kinematics, Robot Dynami...Robotics-Asimov's Laws, Mechanical Subsystems, Robot Kinematics, Robot Dynami...
Robotics-Asimov's Laws, Mechanical Subsystems, Robot Kinematics, Robot Dynami...
 
Novel 3D-Printed Soft Linear and Bending Actuators
Novel 3D-Printed Soft Linear and Bending ActuatorsNovel 3D-Printed Soft Linear and Bending Actuators
Novel 3D-Printed Soft Linear and Bending Actuators
 
ROBOETHICS-CCS345 ETHICS AND ARTIFICIAL INTELLIGENCE.ppt
ROBOETHICS-CCS345 ETHICS AND ARTIFICIAL INTELLIGENCE.pptROBOETHICS-CCS345 ETHICS AND ARTIFICIAL INTELLIGENCE.ppt
ROBOETHICS-CCS345 ETHICS AND ARTIFICIAL INTELLIGENCE.ppt
 
Engineering Drawing section of solid
Engineering Drawing     section of solidEngineering Drawing     section of solid
Engineering Drawing section of solid
 
SOFTWARE ESTIMATION COCOMO AND FP CALCULATION
SOFTWARE ESTIMATION COCOMO AND FP CALCULATIONSOFTWARE ESTIMATION COCOMO AND FP CALCULATION
SOFTWARE ESTIMATION COCOMO AND FP CALCULATION
 
Input Output Management in Operating System
Input Output Management in Operating SystemInput Output Management in Operating System
Input Output Management in Operating System
 
Research Methodology for Engineering pdf
Research Methodology for Engineering pdfResearch Methodology for Engineering pdf
Research Methodology for Engineering pdf
 
Prach: A Feature-Rich Platform Empowering the Autism Community
Prach: A Feature-Rich Platform Empowering the Autism CommunityPrach: A Feature-Rich Platform Empowering the Autism Community
Prach: A Feature-Rich Platform Empowering the Autism Community
 
"Exploring the Essential Functions and Design Considerations of Spillways in ...
"Exploring the Essential Functions and Design Considerations of Spillways in ..."Exploring the Essential Functions and Design Considerations of Spillways in ...
"Exploring the Essential Functions and Design Considerations of Spillways in ...
 
Earthing details of Electrical Substation
Earthing details of Electrical SubstationEarthing details of Electrical Substation
Earthing details of Electrical Substation
 
High Voltage Engineering- OVER VOLTAGES IN ELECTRICAL POWER SYSTEMS
High Voltage Engineering- OVER VOLTAGES IN ELECTRICAL POWER SYSTEMSHigh Voltage Engineering- OVER VOLTAGES IN ELECTRICAL POWER SYSTEMS
High Voltage Engineering- OVER VOLTAGES IN ELECTRICAL POWER SYSTEMS
 
Robotics Group 10 (Control Schemes) cse.pdf
Robotics Group 10  (Control Schemes) cse.pdfRobotics Group 10  (Control Schemes) cse.pdf
Robotics Group 10 (Control Schemes) cse.pdf
 
Stork Webinar | APM Transformational planning, Tool Selection & Performance T...
Stork Webinar | APM Transformational planning, Tool Selection & Performance T...Stork Webinar | APM Transformational planning, Tool Selection & Performance T...
Stork Webinar | APM Transformational planning, Tool Selection & Performance T...
 
THE SENDAI FRAMEWORK FOR DISASTER RISK REDUCTION
THE SENDAI FRAMEWORK FOR DISASTER RISK REDUCTIONTHE SENDAI FRAMEWORK FOR DISASTER RISK REDUCTION
THE SENDAI FRAMEWORK FOR DISASTER RISK REDUCTION
 
Comprehensive energy systems.pdf Comprehensive energy systems.pdf
Comprehensive energy systems.pdf Comprehensive energy systems.pdfComprehensive energy systems.pdf Comprehensive energy systems.pdf
Comprehensive energy systems.pdf Comprehensive energy systems.pdf
 
Mine Environment II Lab_MI10448MI__________.pptx
Mine Environment II Lab_MI10448MI__________.pptxMine Environment II Lab_MI10448MI__________.pptx
Mine Environment II Lab_MI10448MI__________.pptx
 
Ch10-Global Supply Chain - Cadena de Suministro.pdf
Ch10-Global Supply Chain - Cadena de Suministro.pdfCh10-Global Supply Chain - Cadena de Suministro.pdf
Ch10-Global Supply Chain - Cadena de Suministro.pdf
 
11. Properties of Liquid Fuels in Energy Engineering.pdf
11. Properties of Liquid Fuels in Energy Engineering.pdf11. Properties of Liquid Fuels in Energy Engineering.pdf
11. Properties of Liquid Fuels in Energy Engineering.pdf
 
List of Accredited Concrete Batching Plant.pdf
List of Accredited Concrete Batching Plant.pdfList of Accredited Concrete Batching Plant.pdf
List of Accredited Concrete Batching Plant.pdf
 

Capital Budgeting.docx

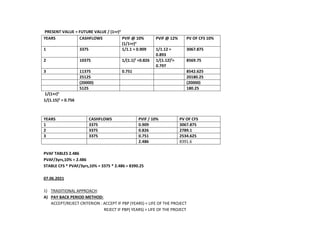
  • 1. PRESENT VALUE = FUTURE VALUE / (1+r)n YEARS CASHFLOWS PVIF @ 10% (1/1+r)n PVIF @ 12% PV OF CFS 10% 1 3375 1/1.1 = 0.909 1/1.12 = 0.893 3067.875 2 10375 1/(1.1)2 =0.826 1/(1.12)2 = 0.797 8569.75 3 11375 0.751 8542.625 25125 20180.25 (20000) (20000) 5125 180.25 1/(1+r)n 1/(1.15)2 = 0.756 YEARS CASHFLOWS PVIF / 10% PV OF CFS 1 3375 0.909 3067.875 2 3375 0.826 2789.1 3 3375 0.751 2534.625 2.486 8391.6 PVAF TABLES 2.486 PVAF/3yrs,10% = 2.486 STABLE CFS * PVAF/3yrs,10% = 3375 * 2.486 = 8390.25 07.06.2021 1) TRADITIONAL APPROACH: A) PAY BACK PERIOD METHOD: ACCEPT/REJECT CRITERION : ACCEPT IF PBP (YEARS) < LIFE OF THE PROJECT REJECT IF PBP( YEARS) > LIFE OF THE PROJECT
  • 2. CALCULATION OF PBP IF CASHFLOWS ARE STABLE PBP = INITIAL OUTLAY OF THE PROJECT / ANNUAL CASHFLOW 1) GIVEN: INVESTMENT = Rs.100000 ANNUAL CASHFLOW = Rs.20000 PBP = INITIAL OUTLAY OF THE PROJECT / ANNUAL CASHFLOW PBP = 5 YEARS 2) GIVEN : INVESTMENT = Rs.500000 PROFIT BEFORE TAX = Rs. 80000 LESS: TAX @50% = Rs.(40000) PAT = Rs.40000 ADD: DEP @12% 500000= 60000 CFAT = 100000 PBP = INITIAL OUTLAY OF THE PROJECT / ANNUAL CASHFLOW PBP = 500000/100000 = 5 YEARS 08.06.2021 SOL) INITIAL INVESTMENT IS RS.10000 STATEMENT SHOWING CALCULATION OF PBP YEARS CFAT CUMULATIVE CFAT 1 2000 2000 2 4000 6000 3 3000 9000 4 2OOO PBP = 3YEARS + (10000 – 9000) / 2000 PBP = 3YEARS +1000/2000 PBP = 3 YEARS + 0.5 PBP = 3.5 YEARS
  • 3. OR PBP = 3YEARS,[ (10000 – 9000) / 2000 ] * 12 PBP = 3YEARS, 1000/2000 *12 PBP = 3 YEARS, 6 MONTHS Pb) Calculate PBP for the data below. Investment is Rs.15000. YEARS CFAT 1 1000 2 2000 3 4000 4 5000 5 8000 SOL) STATEMENT SHOWING CALCULATION OF PBP YEARS CFAT CUMULATIVE CFAT 1 1000 1000 2 2000 3000 3 4000 7000 4 5000 12000 5 8000 PBP = 4 Years + (15000 – 12000)/ 8000 PBP = 4 Years + 0.375 PBP = 4.375 years PBP = 4 years and (0.375*12) PBP = 4 years and 4.5 months Pb) For the following 2 projects calculate PBP Years Project X Project Y 0 -10000 -10000 1 4000 5000 2 4000 6000 3 2000 3000
  • 4. Sol) Statement showing calculation of PBP for Project X Years CFAT Cumulative CFAT 1 4000 4000 2 4000 8000 3 2000 10000 PBP for Project X is 3 Years Statement showing calculation of PBP for Project Y Years CFAT Cumulative CFAT 1 5000 5000 2 6000 3 3000 PBP = 1 Year + (10000 – 5000) / 6000 PBP = 1 year + 0.833 PBP = 1.833 Years Decision: We accept Project Y over Project X because the calculated PBP for Project Y is lesser than the PBP of Project X. B) RATE OF RETURN METHOD ( PERCENTAGE) OR ARR ACCOUNTING RATE OF RETURN NET PROFIT 1) ARR = AVERAGE ANNUAL PROFITS AFTER DEP & TAXES / AVERAGE INVESTMENT * 100 AVG. ANNUAL PROFITS AFTER DEP & TAXES = Total Profits / NO. OF YEARS AVG. INVESTMENT = Total Investment / 2 OR AVG. INVESTMENT = (COST – SCRAP)/ 2 + WORKING CAPITAL + SCRAP VALUE ACCEPT IF ARR > ROR REJECT IF ARR < ROR Pb) Determine ARR for machines A and B. Particulars Machine A Machine B Cost 56125 56125 Life 5 5
  • 5. Salvage value ( Scrap) 3000 3000 Income Tax 55% 55% Additional working capital 5000 6000 Years 1 3375 11375 2 5375 9375 3 7375 7375 4 9375 5375 5 11375 3375 Total Profits 36875 36875 SOL) ARR = AVERAGE ANNUAL PROFITS AFTER DEP & TAXES / AVERAGE INVESTMENT * 100 CALCULATION OF ARR FOR MACHINE A AVERAGE ANNUAL PROFITS AFTER DEP & TAXES = 36875/ 5 AVERAGE ANNUAL PROFITS AFTER DEP & TAXES = 7375. AVG. INVESTMENT = (COST – SCRAP)/ 2 + WORKING CAPITAL + SCRAP VALUE = (56125 – 3000)/ 2 + 5000 + 3000 = 26563 + 8000 = 34563 ARR FOR MACHINE A = 7375 / 34563 * 100 ARR FOR MACHINE A = 21.33% ARR FOR MACHINE B = 20.73 % 18.02.2022 Pb) The following cash flows are given below for projects X and Y. Investment in both the projects is Rs.3000. Calculate PBP and suggest.
  • 6. Years Project X Project Y 1 1300 900 2 1100 900 3 900 900 4 640 900 5 640 900 Sol) Statement showing calculation of PBP for Project X Years CFAT Cumulative CFAT 1 1300 1300 2 1100 2400 3 900 4 640 5 640 PBP = 2 years + (3000 – 2400) / 900 PBP = 2.67 Years. Calculation of PBP for Project Y PBP = Investment / Annual CFAT PBP = 3000 / 900 PBP = 3.33 Years. Decision: Since PBP of Project X is lesser than the PBP of Project Y, we accept Project X. Pb) Calculate ARR for the following project if ROR is 10%. Initial Investment is Rs. 40000 Years PAT( Profit After Tax) 1 10000 2 8000
  • 7. 3 6000 4 2000 ARR = Average annual net profit / Average Investment * 100 Average annual net profit = 26000 / 4 = Rs. 6500 Average Investment = Total Investment / 2 Average Investment = 40000 / 2 = 20000 ARR = 6500 / 20000 * 100 ARR = 32.5% > ROR ARR > ROR Decision: Accept the given project. Discounted PBP: (DPBP) Under this method, after calculating the present values for each year, then the cumulative CFAT are calculated. Then the procedure for calculating DPBP is same as that of PBP. Pb) Calculate i) PBP ii) DPBP For the following data: Cost = Rs. 50000 Life = 5 Years
  • 8. Cost Of Capital = 10% Years CFAT 1 5000 2 20000 3 30000 4 30000 5 10000 Sol) Statement showing calculation of PBP Years CFAT Cumulative CFAT 1 5000 5000 2 20000 25000 3 30000 4 30000 5 10000 PBP = 2 years + (50000 – 250000) / 30000 PBP = 2.833 Years. Statement showing calculation of DPBP Years CFAT PVIF @ 10% Discounted CFAT or Present Value of CFAT Cumulative Discounted CFAT 1 5000 0.909 4545 4545 2 20000 0.826 16520 21065 3 30000 0.751 22530 43595
  • 9. 4 30000 0.683 20490 5 10000 0.621 6210 DPBP = 3 Years + (50000 – 43595) / 20490 DPBP = 3.313 Years. Pb) Calculate DPBP for the following project at COC of 8%. Investment is Rs.150000. Years CFAT 1 50000 2 75000 3 125000 4 130000 5 80000 Sol) Years CFAT PVIF @ 8% Discounted CFAT Cumulative CFAT 1 50000 0.926 46300 46300 2 75000 0.857 64275 110575 3 125000 0.794 99250 4 130000 0.735 95550 5 80000 0.681 54480 DPBP = 2 Years + (150000 – 110575) / 99250 DPBP = 2.397.
  • 10. 21.02.2022 DISCOUNTED TECHNIQUES OF CAPITAL BUDGETING: 1) Calculate Discounted Payback Period if the cash flows are Rs.50000 for a life of 10 years with initial investment of Rs.200000. ROR is at 12% 1 / (1.12)n STATEMENT SHOWING CALCULATION OF DPBP YEARS CFS PVIF @ 12% DISCOUNTED CASH FLOWS/ PV OF CASHFLOWS CUMULATIVE CFS 1 50000 0.8929 44645 44645 2 50000 0.7972 39860 84505 3 50000 0.7118 35590 120095 4 50000 0.6355 31775 151870 5 50000 0.5674 28370 180240 6 50000 0.5066 25330 7 50000 0.4523 22615 8 50000 0.4039 20195 9 50000 0.3606 18030 10 50000 0.3220 16100 DPBP = 5 YEARS + (200000 – 180240)/25330 DPBP = 5 YEARS + 0.780
  • 11. PBP = 5.78 YEARS SOL) STATEMENT SHOWING CALCULATION OF PBP USING TRADITIONAL METHOD YEARS ANNUAL CFS CUMULATIVE CFS 1 5000 5000 2 20000 25000 3 30000 4 30000 5 10000 PBP = 2 YEARS + (50000 – 25000)/ 30000 PBP = 2.83 YEARS STATEMENT SHOWING CALCULATION OF DPBP YEARS ANNUAL CFS PVIF @ 10 % PV OF CFS CUMULATIVE PV OF CFS 1 5000 0.909 4545 4545 2 20000 0.826 16520 21065 3 30000 0.751 22530 43595 4 30000 0.683 20490 5 10000 0.621 6210 PBP = 3 YEARS + (50000 – 43595)/ 20490 PBP = 3.312 YEARS 2) NET PRESENT VALUE (NPV): NPV is a time value of money approach. In evaluating the investment proposal. Under this method, all cash inflows and outflows are converted to their present values and then the technique of NPV is applied.
  • 12. STEP WISE CALCULATION: STEP 1 : DETERMINE THE COC (ROR) STEP 2 : CALCULATE PV OF CASHFLOWS STEP 3: TAKE TOTAL PV OF cash inflows STEP 4 : CALCULATE NPV = TPV OF CIFS – TPV OF COFS STEP 5: ACCEPT THE PROPOSAL IF NPV IS POSITIVE; REJECT THE PROPOSAL IF NPV IS NEGATIVE. Pb) Calculate NPV for Projects X and Y and suggest which project is feasible if COC is 10%. Cost of Project X is Rs.20000 and cost of Project Y is Rs.30000. YEARS PROJECT X PROJECT Y 1 5000 20000 2 10000 10000 3 10000 5000 4 3000 3000 5 2000 2000 5( SCRAP) 1000 2000 SOL) STATEMENT SHOWING CALCULATION OF NPV FOR PROJECT X COST: Rs. 20000 YEARS CFS PVIF @ 10% PV OF Cash Inflows 1 5000 0.909 4545 2 10000 0.826 8260 3 10000 0.751 7510 4 3000 0.683 2049 5 2000 0.621 1242 5( SCRAP VALUE) 1000 0.621 621 TOTAL OF PV OF Cash Inflows LESS: TOTAL PV OF COFS PVIF for Year 0 is always = 1 24227 (20000)
  • 13. NET PRESENT VALUE 4227 STATEMENT SHOWING CALCULATION OF NPV FOR PROJECT Y COST: Rs. 30000 YEARS CFS PVIF @ 10% PV OF CFS 1 20000 0.909 18180 2 10000 0.826 8260 3 5000 0.751 3755 4 3000 0.683 2049 5 2000 0.621 1242 5( SCRAP VALUE) 2000 0.621 1242 TOTAL OF PV OF CFS LESS: TOTAL PV OF COFS NET PRESENT VALUE 34728 (30000) 4728 Decision: We accept Project Y because NPV of Project Y is Higher than the NPV of Project X. Pb) Calculate NPV of Project A at 12% COC for the following Cash Flows if the initial Investment is Rs.16200. YEARS CASH INFLOWS 1 8000 2 7000 3 6000 Sol) Years Cash Inflows PVIF @ 12% Present Value of Cash Inflows 1 8000 0.893 7144 2 7000 0.797 5579 3 6000 0.712 4272 Total Present Value of Cash Inflow (-) Total Present Value Of Cash Outflow NPV 16995 (16200) 795
  • 14. Decision: Accept the given Project A as its NPV is Positive. PROFITABILITY Index/ BENEFITR COST RATIO. It is a time adjusted method for evaluating the investment proposal. It is termed as Benefit Cost Ratio because, numerator measures benefits and denominator measures cost. PI can be measured in a) per rupee method (b) in percentage. a) PI ( Per Rupee) =Total PV of Cash inflows / Total PV of Cash outflows. Accept if PI > 1 ; Reject if PI < 1 b) PI (Percentage) = Total PV of Cash inflows / Total PV of Cash outflows * 100 Accept if PI > 100 ; Reject if PI < 100 Pb) Initial Cash Outlay is Rs.25000 Years Cash Inflows 1 10000 2 7500 3 12500 4 5000 Discount Factor is 10% Sol) Years Cash inflows PVIF @ 10% PV of Cash Inflows 1 10000 0.909 9090 2 7500 0.826 6195 3 12500 0.751 9388 4 5000 0.683 3415 Total PV of Cash Inflows 28088
  • 15. PI( Per Rupee) =Total PV of Cash inflows / Total PV of Cash outflows. PI = 28088 / 25000 PI = 1.123 PI> 1. Therefore we accept the project. Pb) The management of Z Ltd. Proposes to invest Rs.8000 in a project which will give earnings for 5 years as below: Years Cash flows 1 3000 2 4000 3 3000 4 2000 5 2000 Suggest whether project is worthwhile to accept using a) DPBP b) NPV c) PI Discount rate is 10 % Sol) a) Statement showing calculation of DPBP Years Cash inflows PVIF @ 10% PV of Cash Inflows Cumulative Cash Inflows 1 3000 0.909 2727 2727 2 4000 0.826 3304 6031 3 3000 0.751 2253 4 2000 0.683 1366 5 2000 0.621 1242 DPBP = 2 Years + (8000 – 6031) / 2253 DPBP = 2.873 Years
  • 16. b) Statement showing calculation of NPV Years Cash inflows PVIF @ 10% PV of Cash Inflows 1 3000 0.909 2727 2 4000 0.826 3304 3 3000 0.751 2253 4 2000 0.683 1366 5 2000 0.621 1242 Total PV of Cash inflows Less: Total PV of Cash Outflow NPV 10892 (8000) 2892 c) PI ( Per Rupee) =Total PV of Cash inflows / Total PV of Cash outflows. PI = 10892 / 8000 PI = 1.36 Decision: DPBP < Life of Project. Therefore, we accept the proposal NPV is positive, therefore we accept the proposal PI > 1, therefore, we accept the proposal. Under the given 3 techniques the proposal should be accepted. Thus, the proposal accepted. INTERNAL RATE OF RETURN. This method is also known as Yield method. IRR is a rate which actually equates the PV of cash inflows with PV of cash outflows. This is the rate actually earned by the project. Under this method, the project is accepted if IRR > COC or Cut-off rate and rejected if IRR < COC or Cut-off rate. IRR is calculated using trial and error method.
  • 17. IRR = Lower Rate +(HPV of Cash Inflows – Initial Investment) / (HPV of Cash Inflows - LPV of Cash Inflows) * Difference in Rate. Pb) From the following information relating to two projects X and Y, calculate IRR and state which project is better. Particulars Project X Project Y Life 10Years 8 Years Cost Rs. 180000 200000 Savings( Annual Cash flows) Rs. 30000 40000 Sol) Statement showing calculation of PV of Cash inflows for Project X Years Cash inflows PVIF @10% PVIF @ 15% 1 30000 0.909 0.870 2 30000 0.826 0.756 3 30000 0.751 0.658 4 30000 0.683 0.572 5 30000 0.621 0.497 6 30000 0.564 0.432 7 30000 0.513 0.376 8 30000 0.467 0.327 9 30000 0.424 0.284 10 30000 0.386 0.247 PVAF @ 10% for 10 Years = 6.145 PVAF @ 15% for 10 years = 5.019 TPV of Cash Inflows @ 10% = 6.145 * 30000 = 184350 (HPV) TPV of Cash Inflows @ 15% = 5.019 * 30000 = 150570 (LPV) IRR = Lower Rate +(HPV of Cash Inflows – Initial Investment) / (HPV of Cash Inflows - LPV of Cash Inflows) * Difference in Rate.
  • 18. IRR = 10 + (184350 – 180000) / (184350 – 150570) * 5 IRR = 10 + (4350 / 33780) * 5 IRR = 10 + (0.128 *5) IRR = 10 + 0.64 IRR = 10.64 % for Project X Statement showing calculation of PV of Cash inflows for Project Y Years Cash inflows PVIF @10% PVIF @ 15% 1 40000 0.909 0.870 2 40000 0.826 0.756 3 40000 0.751 0.658 4 40000 0.683 0.572 5 40000 0.621 0.497 6 40000 0.564 0.432 7 40000 0.513 0.376 8 40000 0.467 0.327 PVAF @ 10% for 8 years= 5.335 PVAF @ 15% for 8 years = 4.487 TPV of Cash Inflows @ 10% = 5.335 * 40000 = 213400 (HPV) TPV of Cash Inflows @ 15% = 4.487 * 40000 = 179480 (LPV) IRR = Lower Rate + (HPV of Cash Inflows – Initial Investment) / (HPV of Cash Inflows - LPV of Cash Inflows) * Difference in Rate. IRR = 10 +(213400 – 200000) / (213400 - 179480) * 5 IRR = 10 + (13400 / 33920)* 5
  • 19. IRR = 10 + (0.395* 5) IRR = 10 + 1.975 IRR = 11.975 for Project Y Decision: IRR of Project Y is > than the IRR of Project X, therefore we accept Project Y. Pb) Calculate IRR for the investment and suggest about its acceptability if cost of capital is 12% Years Cash flows 0 25000 1 10000 2 7500 3 12500 4 5000 Sol) Statement showing calculation of IRR using Trial and Error method Years Cash inflows PVIF @ 12% PV of Cash inflows PVIF @ 18% PV of Cash inflows 1 10000 0.893 8930 0.847 8470 2 7500 0.797 5978 0.718 5385 3 12500 0.712 8900 0.609 7613 4 5000 0.636 3180 0.516 2580 26988 (HPV) 24048 (LPV) IRR = Lower Rate + (HPV of Cash Inflows – Initial Investment) / (HPV of Cash Inflows - LPV of Cash Inflows) * Difference in Rate. IRR = 12% + (26988 – 25000) / (26988 – 24048) * 6 IRR = 12 % + (1988 / 2940) * 6
  • 20. IRR = 12% + (0.676) * 6 IRR = 12 % + 4.056 IRR = 16.056 % Decision: Since IRR > COC that is 16.056% > 12 %, we accept the investment proposal. Pb) From the following information calculate NPV, PI, IRR of the project @ discount rate of 10%. Years Cash Flows 0 50000 1 20000 2 15000 3 25000 4 10000 Sol) Statement showing calculation of NPV and PI Years Cash inflows PVIF @ 10 % PV of cash inflows 1 20000 0.909 18180 2 15000 0.826 12390 3 25000 0.751 18775 4 10000 0.683 6830 Total PV of Cash inflows Less: Total PV of Cash outflows NPV PI = Total PV of Cash inflow / Total PV of Cash outflows PI = 56175 (50000) 6175 56175 / 50000 1.1235 Statement showing calculation of IRR using Trial and Error Method Years Cash inflows PVIF @ 15% PV of cash inflows PVIF @ 18 % PV of cash inflows
  • 21. 1 20000 0.870 17400 0.847 16940 2 15000 0.756 11340 0.718 10770 3 25000 0.658 16450 0.609 15225 4 10000 0.572 5720 0.516 5160 50910 (HPV) 48095 (LPV) IRR = Lower Rate + (HPV of Cash Inflows – Initial Investment) / (HPV of Cash Inflows - LPV of Cash Inflows) * Difference in Rate. IRR = 15 + (50910-50000) / 50910 – 48095) * 3 IRR = 15 + (910 / 2815) * 3 IRR = 15 + (0.3232) * 3 IRR = 15 + 0.97 IRR = 15.097 % Notes to be considered: Traditional methods Discounted methods Methods Inflows to be considered Methods Inflows to be considered Payback period method CFAT Discounted Payback period method CFAT Accounting rate of return method PAT Net Present Value Method CFAT Internal rate of return method CFAT Profitability Index method CFAT
  • 22. Particulars Rs Earnings before interest and tax (EBIT) XXXX Less: Interest (XXX) Earnings before tax XXX Less: Tax (XXX) Earnings after Tax / Profit after Tax (PAT) XXX Add: Depreciation XXX CFAT XXXX Depreciation = (Cost of the project – Scrap Value) / Life of the Project. Pb) A chemical company, is considering to invest in a project that costs Rs.400000. The estimated salvage value is null. Tax rate is 15%. The company uses straight line method for calculating depreciation. The expected cash flows before depreciation and tax are as below: Years Expected cash flows before depreciation and tax 1 100000 2 150000 3 200000 4 250000 5 300000 Calculate NPV and suggest whether to accept or reject the proposal. Sol) Depreciation = (Cost of the project – Scrap Value) / Life of the Project Depreciation = (400000 – 0) / 5 Depreciation = 80000
  • 23. Years Expected cash flows before depreciation and tax Less: Depreciation (Rs.80000) EBIT Less: Tax @ 15% EAT / PAT Add: Depreciation CFAT 1 100000 (80000) 20000 (3000) 17000 80000 97000 2 150000 (80000) 70000 (10500) 59500 80000 139500 3 200000 (80000) 120000 (18000) 102000 80000 182000 4 250000 (80000) 170000 (25500) 144500 80000 224500 5 300000 (80000) 220000 (33000) 187000 80000 267000 Statement showing calculation of NPV Years CFAT PVIF @ 10 % PV of Cash Inflows 1 97000 0.909 88173 2 139500 0.826 115227 3 182000 0.751 136682 4 224500 0.683 153334 5 267000 0.621 165807 Total PV of Cashinflows Less: Total PV of Cash outflows NPV 659223 (400000) 259223 Decision: Accept the given investment proposal because NPV is Positive.