Generative AI - Gitex v1Generative AI - Gitex v1.pptx
Cp formal lab report
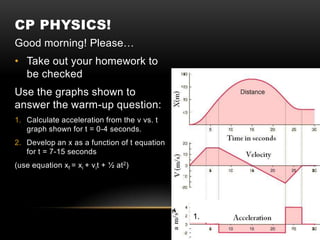
1. CP PHYSICS!
Good morning! Please…
• Take out your homework to
be checked
Use the graphs shown to
answer the warm-up question:
1. Calculate acceleration from the v vs. t
graph shown for t = 0-4 seconds.
2. Develop an x as a function of t equation
for t = 7-15 seconds
(use equation xf = xi + vit + ½ at2)
1.
3. HOUSEKEEPING!
• ***LAST DAY TO MAKE UP WORK, HAND IN LATE WORK IS
10/26***
• Word Wall!
• Catapults coming soon! Launching is on 10/26
• Rules/grading are posted online
• Due today:
• A status update on your progress
• Your plans for how you will construct & test your catapult
• Coming up…
• Formal lab report will be due Monday 10/24
• Quiz will be Monday 10/24
• There will be a unit 2 test on 10/31
4. WORD WALL
Period 2 Period 6
• Wendy - physics • Hunter – dependent variable
• Doug – free-fall • Kaniz – independent variable
• Dylan – acceleration due to • Ethenne - hypothesis
gravity
• Alejandra – controlled
• Calyah – dependent variable experiment
• JJ – independent variable • Jimmy – scientific method
• Karol – hypothesis
• Catie
Some words are in the book…others are not…you may have to
google it to get all the information you need
5. HOMEWORK SOLUTIONS
Pg. 72 # 34-36, 38, 39
34. Ball thrown vertically upward.
What happens to the ball’s velocity…
(a) … while it is in the air?decreases as it goes up, increases as it goes down
(b) … at maximum altitude? It is zero
What is the ball’s acceleration…
(c) … when it reaches its maximum altitude? It is -9.81m/s2
(d) … Just before it hits the ground? It is -9.81m/s2
(e) does its acceleration increase, decrease, or stay constant? It stays the same
35. The velocity of the solid ball (left side) is greater, and so is its
acceleration.
36. Accelerations of the two pins are both the same, even if one is going up
and the other is going down!
38. 39.6 m/s
39. t=3.9 sec
6. • In this lab, we will use a dot timer to
calculate gravity in two ways
G WHIZ LAB
• Graphically - but how?
Yf = yi + vit + 0.5at2
• Using equations: Which can be simplified to…
• What equation can you use to
calculate gravity if given: Yf = 0 + 0 + 0.5at2
• Yi = 0 m
• Yf = gathered data Yf = 0.5at2
• Vi = 0 m/s
• Vf = ?
• a = ? (what we are solving
for)
• t = gathered data
7. G WHIZ LAB
On “ticker tape computer graphing”
Lab Instructions instructions…
• Answer questions 1,3,4,5 • Change all references to “Time
(1/60 sec)” to “Time (1/30 sec)”
• On back…
• In table headers and in
• For your analysis, you will
instructions
measure the distance
between every other dot • When generating the velocity
calculation…
• Last sentence of paragraph
2… • In instructions…
• “each time interval is • In cell I4, type =C4*30
1/30th of a second”… instead of =C4*60
8. FORMAL LAB REPORT WRITE-UP
• Lab report should be in paragraph form, broken up into sections as
required
• Sections to include (which are listed on rubric)
• Problem definition
• What question(s) are you trying to answer?
• Include any preliminary observations or background information
about the subject
• Experimental design
• Data presentation
• Conclusion & discussion
9. PROBLEM DEFINITION
• Statement of the problem
• Hypothesis
• What do you think the value of acceleration will be?
• Do you think the number of washers (or the mass) attached
at the end will make a difference in the value of
acceleration? Why or why not?
• Identify Independent variable: the variable we are in control of
changing
• Identify dependent variable: the variable we are measuring – its
results “depend on how the experiment goes”
10. EXPERIMENTAL DESIGN
• What materials are used in this lab?
• What safety notes need to be considered?
• How many trials were done?
• Were there any constants? Was there a control?
• Explain the procedure in enough detail so that someone could
repeat the experiment
11. Data Time (1/60 sec)
1
Distance (mm)
2
Presentation 2
3
1.5
1.5 Distance (cm) vs. Time Graph
4 2 250
• Clear data tables with 5 2.5
6 3 200
title, labels and units 7 3.5
Distance (cm)
8 4 150
• Sample calculations 9 3
included 10 3 100
11 3.5
50
• Equations used are
provided 0
0 50 100 15
Time (1/60 seconds)
• Graphs with
title, labels, and units Velocity vs. Time Graph for Ticker Tape
200
• Dependent variable is Lab
180 y = 1.312x
always on the y 160 R² = 0.936
axis, dependent variable 140
Velocity (cm/sec)
is on the x axis 120
100
80
60
40
20
0
0 20 40 60 80 100 120 140 160
Time (1/60 seconds)
12. CONCLUSION AND DISCUSSION
• Lab questions are answered Lab questions:
sufficiently 1. Was there a difference between the
accelerations for the different masses?
• Answered in a way so that Explain why this may occur.
the reader does not have to 2. What is the acceleration of gravity on the
know the question being moon? Why is it different than on the
Earth?
asked when reading your
response.
3. Did your graphs show a constant
acceleration? Explain.
4. Calculate and explain what is
represented by the area under your
velocity vs. time graph.
5. Would you expect your calculated values
for acceleration to be higher than, equal
to, or less than the accepted value for
accelerated due to gravity (9.8 m/s 2)?
Why? Calculate the relative error.
Relative Error = your result– accepted value (9.80) x100
accepted value (9.80)
13. CONCLUSION AND DISCUSSION
• The lab conclusion is discussed
• What effect did the independent variable have on the dependent variable?
• Support your conclusion by referring to at least two references to graphs
and tables to show reader how you reached your conclusion
• Validity of experiment is discussed:
• Was there anything that you noticed while performing the lab which
could have affected your data?
• Were the number of trials adequate?
• Compare your results to your hypothesis – were the results what you
thought they would be? Why or why not?
• Possible sources of error are identified & suggestions are made to reduce
error
• Ideas for improvement and extension are provided.
• Wrap up conclusion, make connections to everyday situations.