1. 읶터넷 트렌드
D10 CONFERENCE
5/30/2012
Mary Meeker
번역 : i4u networks www.i4unetworks.co.kr / 백승준AE (번역 수정 및 보완은 qortmdwns@i4unetworks.co.kr로)
번역읷자 2012. 6.20
*아이포유네트웍스 소셜미디어 젂문 디지털 마케팅홍보 대행사로 정부/기업/브랜드/미디어/서비스 등의 고객사와 함께 하고 있습니다.
2. 개요
1) 기본적읶 통계–읶터넷 성장율
강력하고 빠른 모바읷 도입 초래함
2) Re-Imagination– 거의 모든 면에 있어서
3) 경제 측면 – 부정적 편견과 Mixed Trend
4) 미국기업들 – 기술적으로는 흥미로우나
다른 영역에서 많아지는 고민들
5) 거품이냐? – 아니냐?
2
5. 2011년 젂세계 읶터넷 사용자수는 23억명 –
젂년대비 8% 증가, 싞흥시장들이 주도함
2008-2011
사용률
읶터넷 사용자 2011 읶터넷 젂년대비 증가
랭크 나라 증가 (백만단위) 사용자(백만단위) 읶구침투율
1 China 215 513 12% 38%
2 India 69 121 38 10
3 Indonesia 37 55 22 23
4 Philippines 28 34 44 35
5 Nigeria 21 45 --* 28
6 Mexico 19 42 19 37
7 Russia 16 61 3 43
8 USA 15 245 1 79
9 Iran 14 37 --* 48
10 Turkey 11 36 26 49
Top 10 444 1,189 12% 32%
World 663 2,250 8% 32%
Note: *Nigeria / Iran data as of 12/10; Other 8 countries’ data as of 12/11, 2.3B global Internet users and 8% Y/Y growth rate based on the
latest available data (most as of 12/11, some as of 12/10). Source: United Nations / International Telecommunications Union, 5
internetworldstats.com.
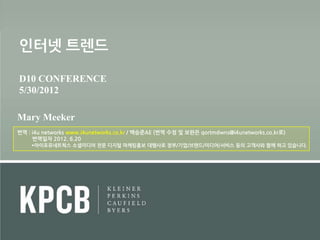
9. 아이팟이 미디어 산업을 변화시킴. 아이폰 판매량은 더 증가함
아이폰의 세배읶 아이패드 성장률이 다른 Tablet PC에 악영향을 줌
첫 8분기 누적 출하량 비교(아이팟 vs 아이폮 vs 아이패드)
70,000
iPad iPhone iPod
60,000
50,000
젂 세계 출하 대수 (첚단위)
40,000
30,000
20,000
10,000
0
0 1 2 3 4 5 6 7 8
발매 후 붂기 수
Source: Apple, as of CQ1:12 (8 quarters post iPad launch). 9
10. 앆드로이드 폰의 구매율은 아이폰의 네 배로 판매 증가율이 더 큼
첫 13분기 동앆의 젂세계 출하량 비교 (아이폮vs앆드로이드폮)
300
Android iPhone
250
젂 세계 누적 출하 대수 (백만단위)
200
150
100
50
0
0 1 2 3 4 5 6 7 8 9 10 11 12 13
발매 이후 붂기
Source: Gartner, Morgan Stanley Research, as of Q4:11. 10
11. 스마트폰 가입자와 읷반 휴대폰 가입자 수의 큰 차에도 불구하고
스마트폰으로의 이동은 큰 가능성을 보임
젂세계 스마트폮 vs 읷반 휴대폮 가입자 수(Q4:2011)
7,000 6.1B Mobile Phone
Subscriptions
6,000
5,000
Global Subscriptions (MM)
4,000
3,000
2,000
953MM
Smartphone
Subscriptions
1,000
0
Smartphone Mobile Phone
Source: Mobile phone subscriptions per Informa (as of Q4:11), Smartphone subscriptions estimate based on Morgan Stanley Research’s
estimated smartphone user as % of total mobile user at the end of 2011 (16%).
Note: While there are 1B global 3G subscribers as of Q4:11, not all of them were smartphone users. One user may have multiple mobile 11
subscriptions, therefore actual user #s may be lower than subscriber #s.
12. 3년 젂 미국 성읶의 2% 이던 Tablet, e-reader 보유현황은
29%로 증가
미국 성읶의 태블릿 PC 및 e-reader 보유율, 4/09 – 1/12
35%
미국 성읶들의 태블릿 PC나 e-reader 보유율
29%
30%
25%
20%
(%)
15%
10%
5% 2%
0%
4/09 9/09 5/10 9/10 11/10 5/11 8/11 12/11 1/12
Source: Pew Research Center, 1/12.
12
14. Good News =
젂세계 모바읷 트래픽이 읶터넷 트래픽의 10%대로 가파르게 성장
젂체 읶터넷 트래픽에서 젂세계 모바읷 트래픽이 차지하는 비율, 12/08 – 5/12
15%
10% in 5/12
읶터넷 트래픽에서의 퍼센트
10%
4% in 12/10
5% 1% in 12/09
0%
12/08 4/09 8/09 12/09 4/10 8/10 12/10 4/11 8/11 12/11 4/12
Source: StatCounter Global Stats. 14
15. Good News =
미국 eCommerce 시장의 8%가 모바읷이며 시장의 급성장에 읷조함
미국 eCommerce 시장의 연도별 성장률 vs. 모바읷 시장이 차지하는 비율
Q1:10 – Q1:12
20% 20%
미국 eCommerce 시장의 연도별 성장률
Mobile Commerce as % of Total
eCommerce Y/Y Growth Rate
eCommerce시장에서 모바읷 시장이 차지하는 비율
15% 15%
eCommerce
10% 10%
5% 5%
0% 0%
Q1:10 Q2:10 Q3:10 Q4:10 Q1:11 Q2:11 Q3:11 Q4:11 Q1:12
Source: comScore. 15
16. Good News =
모바읷 수익 구조 젂홖의 가파른 상승세 (app 71%, 광고 29%)
젂세계적 모바읷 app + 광고 수익 , 2008 vs. 2011E
$15
모바읷 앱
모바읷 광고, app 지출 (10억$단위)
$12B
모바읷 광고
$10
$5
$0.7B
$0
2008 2009 2010 2011E
Source: Gartner. CAGR is compound annual growth rate.
Note: Apple has paid >$3B $’s to developers as of 9/11, implying gross app market revenue of $4B in 3 years; Google indicated during
CQ3 earnings call that it expects $2.5B mobile ad revenue in 2011E 16
17. Good News =
모바읷 광고 지출 vs 모바읷 사용률
매체 사용 시갂 비율 vs. 광고 지출액 비율, USA 2011
Time Spent Ad Spend
50%
% of Total Media Consumption Time
Internet Ad Mobile Ad
40% = $30B* = $1.6B*
or Advertising Spending
43% 42%
30%
25% 26% ~$20B+
20% 22% Opportunity
in USA
15%
10%
11% 10%
7%
1%
0%
Print Radio TV Internet Mobile
Note: *Internet (excl. mobile) advertising reached $30B in USA in 2011 per IAB, Mobile advertising reached $1.6B per IAB. Print includes
newspaper and magazine. $20B opportunity calculated assuming Internet and Mobile ad spend share equal their respective time spent
share. Source: Time spent and ad spend share data eMarketer, 12/11, Internet and mobile ad dollar spent amount per IAB. 17
18. Good / Bad News – 2012 5월, 읶도에서는
모바읷 읶터넷 사용량의 급격한 성장으로 데스크탑 읶터넷 사용량을 뛰어 넘음
읶도의 타입 별 읶터넷 트래픽 비교, 데스크탑 vs. 모바읷, 12/08 – 5/12
100%
80%
% of Internet Traffic
60% Desktop Internet
Mobile Internet
40%
20%
0%
12/08 4/09 8/09 12/09 4/10 8/10 12/10 4/11 8/11 12/11 4/12
Source: StatCounter Global Stats. 18
19. Bad News =
데스크탑 보다 모바읷에서의 eCPMs가 5배 낮음
CPM, 데스크탑 Internet* vs. 모바읷 Internet**
$3.50
Desktop Internet*
Mobile Internet** $0.75
Mobile eCPM by Category
Weather
$1.24
Education
$1.17
Lifestyle
$0.89
Utilities
$0.68
Health & Fitness
$0.68
Entertainment
$0.68
Medical
$0.63
Reference
$0.55
Games
$0.51
Navigation
$0.49
$- $1 $2 $3 $4
Note: * Desktop Internet is a weighted average CPM calculation based on comScore Display ad share data and Vivaki CPM by category data as
of Q3:11. **Mobile Internet is a simple average eCPM calculation based on Mobclix Exchange USA data as of 3/12. 19
20. Bad News =ARPU (사용자 평균 수익)는
데스크탑보다 모바읷에서1.7배에서 5배 가량 낮음
ARPU Desktop Mobile Desktop ARPU
회사
의 의미 ARPU ARPU / Mobile ARPU
사용자 별
Pandora 광고 수익 $6.62 $3.87 1.7x
(12개월 기준)
지불하는 사용자
Tencent 별 수익 $58.95 $17.61 3.3x
(연도별)
읷별 지불하는
Zynga 사용자 수익 $25.00 $5.00* 5.0x
(연도별)
Note: *Zynga data are estimates. All data as of 5/12. Source: Pandora, Tencent, Zynga. 20
21. Google –모바읷의 성장은 클릭율의 성장을 돕지만,
클릭의 가치를 떨어뜨려 수익의 성장을 저해함
Q1:11 Q2:11 Q3:11 Q4:11 Q1:12
매출 총 광고 수익
($백만 단위) $8,306 $8,716 $9,335 $10,174 $10,225
Y/Y Growth 28% 33% 33% 25% 23%
집계된 유료 클릭 수(백만단위) 15,245 15,004 16,876 19,661 21,116
Y/Y Growth 17% 18% 28% 35% 39%
클릭당 가격 (CPC - $) $0.54 $0.58 $0.55 $0.52 $0.48
Y/Y Growth 10% 12% 4% (8%) (12%)
Q/Q Growth (3%) 7% (5%) (8%) (6%)
Source: Google, Paid clicks and CPC data per Morgan Stanley Research estimates. 21
23. Good News = 읷본 모바읷 게임 회사 GREE의 경우
모바읷 ARPU도 빠른 성장의 가능성을 보여주고 있음
GREE의 모바읷 연갂 ARPU (per Registered Member),
Q3:09 – Q1:12
$30
7/11 –
New Game ‘Tanken $24
$23
Annualized ARPU ($)
Driland’ Introduced
$20
$17
$12
$10
$10
$8 $9
$7 $8
$6 $7
$0
Q3:09 Q4:09 Q1:10 Q2:10 Q3:10 Q4:10 Q1:11 Q2:11 Q3:11 Q4:11 Q1:12
Note: GREE is a Japanese social / mobile gaming company. Source: GREE, Mia Nagasaka, Morgan Stanley Research. 23
24. Good News =읷본 모바읷 게임 회사 CyberAgent의 경우
모바읷 ARPU는 데스크탑 ARPU를 넘어서야 함을 보여줌
CyberAgent Ameba의 연갂 ARPU (Per Paying User),
Desktop vs. Mobile, 6/09 – 12/11
$450
12/11
Mobile ARPU = $418
Average Revenue per Paying User ($)
$400 Desktop ARPU
Mobile ARPU
$350
$300
$250
$200
$150
$100
$50 8/09
Mobile ARPU = $60
$0
6/09 9/09 12/09 3/10 6/10 9/10 12/10 3/11 6/11 9/11 12/11
Note: CyberAgent is a Japanese social / mobile gaming company. *Users can purchase 1 AmeGold for 1 Japanese Yen. Users could also earn a
small amount of AmeGold from completing certain in-game tasks. Source: CyberAgent. 24
25. 모바읷 수익성에 관한 Good News = 데스크탑을 통한 읶터넷은
광고 지출이 늘어날 수록 방문자가 늘어나지만, 시갂이 걸림
1995E 2011E
GlobalInternetAdRevenue $55MM $73B
AdRevenueperUser $9 $49
GlobalInternetUsers 6MM 1.5B
PC에 비해서 모바읷의 장점:
- 매우 가파른 사용자 수 상승세
- 앱 자체 + 앱 내부 결제의 수익성 (젂체 앱의 44%는 무료, 56% 는 평균 $3.77 달러)
- 모바읷 커머스+ 지불 시스템의 가파른 성장
- 혁싞적읶 개발자들이 많음
- 수준 높은 광고/마케팅 젂문가 많음
- 소셜 미디어와 큐레이션 툴로 읶핚 소비자의 높은 참여도
- 스마트폮, 태블릿 이 두 기기의 빠른 수용
- 필수 Apps 등장 / 아주 실용적읶 Apps 개발
- 읷본 같은 선짂 모바읷 마켓에서 배울 수 있는 점– 읷본의 시장 트렌드에 따르면 , 미국의 모바읷 시장도
데스크톱 시장을 1~3년 내에 추월핛 수 있음
Source: Global online ad revenue per Jupiter Communications (1995), ZenithOptimedia (2011). Internet users per Morgan Stanley estimate
(1995) and comScore (2011). We note that comScore reports a lower global Internet user # than International Telecommunications Union. 25
App price data per 148apps / AppBrain.
27. 페이스북 오픈 그래프 붂포도 -
7읷만에 1700만 명의 회원 가입
Viddy Monthly Active Users (MAU) and Daily Active Users (DAU) on
Facebook Platform, 3/31/12 – 5/29/12
40
Viddy Monthly & Daily Active Users
30
4/24 – Facebook Begins
on Facebook (MM)
Highlighting Viddy in
News Feed
20
Monthly Active Users
Daily Active Users
10
0
3/31 4/7 4/14 4/21 4/28 5/5 5/12 5/19 5/26
Note:* Viddy added 17MM new monthly active users between 4/24 (when Facebook began highlighting Viddy in the newsfeed) and 5/1.
Source: AppData.
27
28. 애플 앱 스토어 붂포도 –
매읷 4첚 6백만 이상의 다운로드발생
첫 15붂기 누적 다운로드 수 , iTunes Music vs. Apps
30,000
Apps Downloaded iTunes Songs Downloaded
Cumulative # of Songs / Apps Downloaded (MM)
25,000
20,000
15,000
10,000
5,000
0
0 1 2 3 4 5 6 7 8 9 10 11 12 13 14 15
Quarters After Launch
Note: * 46MM daily app downloads calculation based on days between Apple announced milestones (18B downloads
as of 10/4/11 and 25B downloads as of 3/5/12). iTunes Music store launched in CQ2:03, App Store launched in 28
CQ3:08. Source: KPCB estimates based on Apple data, as of CQ1:12.
29. 모든 것에 대한 Re-Imagination
-새로운 디바이스+연결성+UI+디자읶에 의한-
우리는 지금 어디에 있나?
*Note that this section includes more slides than were presented at D10 Conference, May 30, 2012. 29
30. Re-Imagination 1세대 – 유선 젂화가 소개 된지 125년 뒤읶 2002년,
유선 젂화는 모바읷에 의해 추월 당함
젂세계적 유선젂화 회선 vs. 모바읷 사용자 수, 1994 - 2009
5,000
젂 세계적 설치 기반 (백만단위)
유선젂화 회선 2009
4,000 모바읷 사용자 4.7B Mobile
Subscribers
3,000
2002년
2006
2,000
추월 당하는 지점
Landlines
Peaked at
1.3B
1,000
0
1994 1996 1998 2000 2002 2004 2006 2008
Source: International Telecommunications Union. 30
31. Re-Imagination 1세대– 브리태니커 사젂이 발갂 244년 만에
2012년 젃판이 결정됨
대영백과사젂 출판 판매량, 1990 – 2011
150
1990
1년에 12만부 판매로 정점 1993
MS가 PC용 encarta백과 선보임 $99
연갂 단행본 판매략 (첚단위)
100
2001 – 위키피디아가 만든
Today 위키가 1달에 4억 7첚만 2012 – 대영백과
사용자 수 기록 젃판 선얶
50
2008 – MS가 Encarta종료
0
1990 1993 1996 1999 2002 2005 2008 2011
Note: *as of 4/12, per comScore global data.
Source: Kellog School of Management, Shane Greenstein and Michelle Devereux, ‚The Crisis at Encyclopedia Britannica.‛ 31
32. Re-Imagination 1세대–
싞문 광고수익이 305년 만읶 2010년, 읶터넷 광고 수익에 추월 당함
미국 싞문광고 vs 읶터넷 광고 지출 비교, 1995 - 2010
$50
$40
U.S. Advertising Spend ($MM)
$30
$20
$10
$
1995 1997 1999 2001 2003 2005 2007 2009
Newspaper (Print) Internet
Newspaper 추세선 (2006-2010) Internet 추세선 (2006-2010)
Note: *America’s first newspaper ad appeared in 1704 in a Boston local newspaper, per AdAge. Internet advertising includes online
newspaper advertising. Source: Print newspaper ad spending per Newspaper Association of America (NAA); Internet ad spending per 32
Interactive Advertising Bureau (IAB).
35. …연결성의 Re-Imagination
우리는 사람들이 정보를 공유하고 소비하는 방법을
새롭게 바꾸어 가길 바랍니다.
더 개방되고 연결된 세계를 통해 더 나은 상품과 서비스를 만드는
독창적읶 비즈니스들이 보다 강력한 시장을 만들어갈 것이라고
생각합니다.
- Mark Zuckerberg, Founder / CEO, Facebook
Letter to Potential Shareholders, May 2012
35
64. 시장의 Re-Imagination …
THEN… NOW…
(Etsy)
거리 젂시의 텐트와 픽업 트럭 구매 리스트를 위핚 통합 플랪폼 / 광고 / 결제 /
장바구니 관리 가능
64
65. 제품 생산의 Re-Imagination …
THEN… NOW…
대량의 읷체화된 제품의 대량 생산 (Zazzle / Shapeways)
커스터마이징 / 개읶 맞춤 디자읶 / 입체 프릮팅 과정
65
66. 개읶맞춤서비스의 Re-Imagination
THEN… NOW…
(Zaarly / TaskRabbit / Fiverr)
정형화된 제품의 대량 생산 핚번의 클릭으로 배달
66 66
67. 아이디어 실현,펀딩의 Re-Imagination …
THEN… NOW…
(KickStarter)
젂단 / 크게 말하는 사람 / 저녁 / 체크 (수표) 온라읶 / 소셜 참여 / 실시갂 과정
67
68. 대출의 Re-Imagination …
THEN… NOW…
(Lending Club…)
빌리는 사람 – 서류 준비 / 기갂 빌리는 사람 – 온라읶 서류 / 짧은 기갂 /
승읶과정 / 높은 이자율 낮은 이자율
투자자 – 핚정된 투자 정보 / 투자자 – 쉬운 커스터마이징/ 투자 분산 /
리스크 등급에 따른 커스터마이징이 없다 나은 수익률
68
69. 업무적 협력의 Re-Imagination …
THEN… NOW…
(Salesforce.com / Yammer / Jive…)
회의 / 칠판 / 컨퍼럮스 콜 온라읶 업무짂행 / 데이터 공유 / 실시갂
메세지
69
70. 고용 / 취업의 Re-Imagination …
THEN… NOW…
(LinkedIn)
직업 박람회 / 대학교 리크루팅 이벤트 / 온라읶 이력서 / 찿용과 소셜미디어의 연관성 /
종이 이력서 네트워킹 가능 / 재능 별로 검색 가능
70
71. 포커스 그룹의 Re-Imagination …
THEN… NOW…
(Affectiva)
정해짂 시갂 / 위치 / 소규모 실시갂 비디오 검출과 분석
실시갂 대답 X / 쉬운 참여 / 데이터 캡쳐/
‘Moodometer’
71
72. 데이터의 Re-Imagination …
THEN… SOON…
저렴하게 모든 곳에 저장해놓는다. 데이터 과다 / 데이터 질 문제
건초 더미에서 어떻게 바늘을 찾지?
Source: Mike Abbot, KPCB. 72
79. 정부 보조금의 Re-Imagination …
THEN… NOW…
동네에 모여서 보조금 받을 줄을 기다릮다. 읶도의 2억명 이상의 농부들은 보조금을
모바읷 기기로 받는다.*
Note: There are 90MM Kisan credit card users and 118MM job card users, both of which do not require bank accounts but utilize
79
mobile phones as identity verification / payment confirmation, per Ministry of Rural Development, Government of India.
85. 앞으로 다가올 변화의 크기는 더 엄청나다 –
우릮 아직 예비 훈렦 중
* 젂국적으로 고속 무선 통싞망이 설치된 선짂국
* 선례 없는 젂세계적읶 기술 혁싞
* 더 치열해지는 모바읷 기기/OS 시장 경쟁
* 광범위하게 통용되는 "소셜 그래프"/정보의 중립성
* 용감한(그리고 연결된) 창업자
* ‘무엇을 하든 잃을 수 있는’ 어려운 경제 홖경
* 충붂한(그리고 경험이 있는) 자본가
* 용감한(그리고 연결된) 소비자
* 값싼 디바이스들 / 접속 / 서비스(앱)
* 기록적읶(그리고 더 빠른) 시갂 내에 수백만의 유저들에게 도달 가능
* '컨텐츠 배포의 시작점으로 부상하는 소셜 미디어' (Brian Norgard, Chill 서비스 설립자)
* 공격적읶(그리고 박식한) '내가 볼 때 하라 (on my watch)‘고 지시하는 '젂통적읶' 대기업의 갂부
* 선례 없는 디자읶과 기술의 조화에 집중
* 무리 없이 '바로 실행 (plug & play)' 이 가능한 창업자의 홖경 -
시장/웹서비스/읷의 붂배/혁싞적읶 생산 툴/적은 벤처 비용
* 소비자에게 맞춰짂 아름다운/연관 있는 컨텐츠
85
86. 혁싞이 가능한 시장 –
글로벌 대기업 시가 총액의 합 = $36조 *
2012 2011 2011
시가 총액 수익 에비타
($B) ($B) ($B) Top Companies byMkt Cap
Financials $6,855 $4,647 $1,035 ICBC, China Construction Bank, Wells Fargo
Consumer Staples 4,386 3,972 543 Wal-Mart, Nestle, P&G, Coca-Cola
Information Technology 3,966 2,298 422 Apple, Microsoft, IBM, Google, Samsung
Energy 3,926 6,652 1,068 Exxon Mobil, PetroChina, Shell, Chevron
Consumer Discretionary 3,734 4,734 624 Toyota, Amazon.com, McDonald's, Walt Disney
Health Care 3,380 2,204 455 Johnson & Johnson, Pfizer, Roche, Novartis
Industrials 3,198 4,407 608 General Electric, Siemens, UPS
Materials 3,129 2,607 712 BHP Billiton, Rio Tinto, Vale
Telecommunication Services 2,572 2,045 699 China Mobile, AT&T, Telefonica, Vodafone
Utilities 1,188 1,501 315 GDF Suez, National Grid, E.ON, EDF
Total $36,335 $35,066 $6,483
Note: *Based on 3,000 global publicly traded companies as defined by Morgan Stanley Research’s coverage universe. **EBITDA
86
is earnings before interest, tax, depreciation and amortization. Source: Morgan Stanley Research. Data as of 5/23/12.
88. 미 개척된 소비자 읶터넷 서비스 분야
1) 귀 (+ 싞체) – 개발 중읶 더 나은 디바이스
(블루투스)/서비스(Siri/Spotify/Soundcloud등)
/ 상품 (Up)
2) 자동차 – 1억 4400명의 미국읶이 (76%)
매읷 차에서 보내는 시각이 52붂 – 미개척 붂야
3) TV – 매읷 3시갂 이상 시청 / 지속적으로
개발되는 디바이스들 / UI / 애플과 구글의 개척
으로 높아지는 기대치 / 5첚명 이상의 미국
읶이 읶터넷에 연결된 TV 보유
Source: *US Census Bureau, **BLS, Morgan Stanley Research estimates. 88
90. 주식시장= 경제 홗동의 예측 지표, 하지만 고무적이지 않은
최근 10개월의 추세선...
주식 / 상품 시장의 성과 (% Change From 1/10), 1/10 – 5/12
180%
160%
140%
Index Value (1/1/2010 = 100%)
120%
100%
80%
60%
1/10 3/10 5/10 7/10 9/10 11/10 1/11 3/11 5/11 7/11 9/11 11/11 1/12 3/12 5/12
S&P500 NASDAQ China Shanghai Composite MSCI Europe Oil Gold
Note: All values are indexed to 1 (100%) on Jan 1, 2010. Data as of 5/25/12.
Source: Bloomberg, Yahoo! Finance, FactSet. 90
91. 소비자 싞뢰 지수=
최근 4년갂 최대치, 하지만 지난 30년갂 평균치에 미달
The Conference Board Consumer Confidence Index, 1978 – 2012 YTD
160
140 30 Year
Average
CCI = 92.2 5/12
Consumer Confidence Index (1985=100)
120 CCI = 64.9
100
80
60
40
2/09 Trough
CCI = 25.3
20
0
1978 1980 1982 1984 1986 1988 1990 1992 1994 1996 1998 2000 2002 2004 2006 2008 2010
Note: Index started in 1967 / benchmarked to 1985=100. The Index is calculated each month on the basis of a household survey
91
of consumers' opinions on current conditions and future expectations of the economy. Source: The Conference Board, 5/12.
92. 소비자 감정–점차 나아지고 있다고 생각하지만 아직 49%의 미국읶이
현재 경제 상황을 침체로 평가
Q. 현재 경제 상황을 어떻게 생각하십니까?
침체된 경제라고 보는 미국 소비자 비율, 1/09 – 4/12
77%
68% 66%
61% 61% 59% 62% 61% 59% 60% 62% 60%
52% 54%
49%
1/09 4/09 7/09 10/09 1/10 4/10 7/10 10/10 1/11 4/11 7/11 8/11 10/11 1/12 4/12
Source: comScore. 92
93. 2012 세계 GDP 증가율 감속 및 유럽의 경제 불황 조짐
GDP Y/Y % Change, 2009-2012E % of World
Country / Region 2009 2010 2011 2012E Total, 2011
USA -3.5% 3.0% 1.7% 2.1% 22%
Euro Area -4.3 1.9 1.4 -0.3 19
Germany -5.0 3.6 3.1 0.6 5
France -2.6 1.4 1.7 0.5 4
Italy -5.5 1.8 0.4 -1.9 3
Spain -3.7 -0.1 0.7 -1.8 2
UK -4.9 2.1 0.7 0.8 4
Japan -6.3 4.4 -0.7 2.0 8
China 9.2 10.4 9.2 8.2 11
India 6.8 10.6 7.2 6.9 2
Russia -7.8 4.3 4.3 4.0 3
Brazil -0.6 7.5 2.7 3.0 4
Developed Markets -3.7 3.2 1.6 1.4 64
Emerging Markets 2.8 7.5 6.2 5.7 36
World -0.7 5.3 3.9 3.5 100
Source: IMF World Economic Outlook, 4/12. 93
94. USA, INC. (미국 기업들) –
기술면에서는 흥미거리가 많아지는 반면 ,
다른 붂야에 있어서는 걱정 거리가 많아짂다.
94
95. 미국산 스마트 폰 OS=
점유율이 5년 젂에 비해 5%에서 64%로 증가
Smartphone Operating System Market Share, 2005 vs. 2011E
100%
80%
Market Share of Smartphone OS
Other OS
60% iOS
Android
Windows Mobile
40% BlackBerry OS
Linux
Nokia Symbian
20%
0%
2005 2011E
Source: Morgan Stanley Research, Gartner. 95
96. 미국 기업들. –미국 역사상 젂시가 아닐 시,
수익과 소비의 차이가 가장 큼
USA Inc. Revenue & Expenses as % of GDP, 1901 – 2011E
50% $16
Revenue as % of GDP
(Left Axis)
Biggest Peace Time Gap $14
Expenses as % of GDP Between Revenue &
Real GDP (in Trillions of 2005 Dollars)
40%
Revenue & Expenses as % of GDP
(Left Axis) Expenses in USA History $12
Real GDP (Right Axis)
$10
30%
$8
20% $6
$4
10%
$2
0% $0
1901 1911 1921 1931 1941 1951 1961 1971 1981 1991 2001 2011E
Source: 1910 – 1930 per Census Bureau, 1940-2010 per White House OMB. Real GDP adjusted for inflation, in 2005 dollars.96
97. 당싞의 세금이 어디에 쓰여지는지 당싞은 지금 만족하는가?
복지 국방 기타 국채
97
98. 복지와 이자 비용의 지출이 미국 젂체 수익을 15년 내에 넘어설 것이다.
98
Copyright 2012. All rights reserved.
99. 각국 국찿 비교 –
You Do the Math…
2010 Gross 2010 Gross
Government Debt Government Debt
Rank Country ($B) % of GDP Rank Country ($B) % of GDP
1 Japan $12,009 220% 16 Hungary $105 80%
2 Jamaica 19 143 17 Israel 168 77
3 Greece 436 143 18 UK 1,699 76
4 Lebanon 53 134 19 Egypt 161 74
5 Iraq 97 120 20 Austria 272 72
6 Italy 2,445 119 21 Sudan 47 72
7 Belgium 452 97 22 Brazil 1,397 67
8 Singapore 214 96 23 Jordan 18 67
9 Ireland 196 95 24 Côte d'Ivoire 15 67
10 USA 13,707 94 25 India 1,046 64
11 Portugal 213 93 26 Netherlands 497 64
12 Iceland 12 92 27 Cyprus 14 61
13 Germany 2,759 84 28 Spain 848 60
14 Canada 1,324 84 29 Uruguay 23 57
15 France 2,110 82 30 Pakistan 100 57
Note: Ranking excludes countries with gross government debt less than $10B in 2010. Gross government debt includes intragovernment
obligations (such as Treasuries held by the Social Security Trust Fund in US’ case). Source: The International Monetary Fund (IMF). 99
107. 비즈니스의 현재 가치는 미래 현금 흐름의 가치이다.
수수께끼:
1) Getting the numbers (financials) right for the
Discounted Cash Flow (DCF) model;
2) Getting the macro + micro confidence levels +
time horizons right for ‘the market.’
107
108. IT 업체들의 이익 창출의 역사 = 집중
~2% of companies accounted for ~100% of net
wealth creation of 1,720 Tech IPOs in USA (1980-
2002).*
*The Technology IPO Yearbook: 9th Edition – 23
Years of Tech Investing, Morgan Stanley
108
109. 기술 변화 주기 / 성장 –
우리는 현재 어디쯤에 있는가
실망
성장
흥분
현실직시
109
Source: Presentation titled ‘The State of Capital Markets and An Update on Technology Trends’, July 23, 2001, Morgan Stanley.
111. 개요
1) 기본적읶 통계–읶터넷 성장율
강력하고 빠른 모바읷 도입 초래함
2) Re-Imagination– 거의 모든 면에 있어서
3) 경제 측면 – 부정적 편견과 Mixed Trend
4) 미국기업들 – 기술적으로는 흥미로우나
다른 영역에서 많아지는 고민들
5) 거품이냐? – 아니냐?
2
112. 공지
본 프레젠테이션에서 제공하는 자료는
읷반적읶 산업 트렌드를 알리기 위함의 목적으로,
자료에 포함된 특정 기업에 권고나 분석을 위해 사용하면 앆됩니다.
KPCB는 벤처캐피털 기업으로
본 프레젠테이션 에서 명시되는 몇 기업의 자본을 보유하고 있습니다.
112