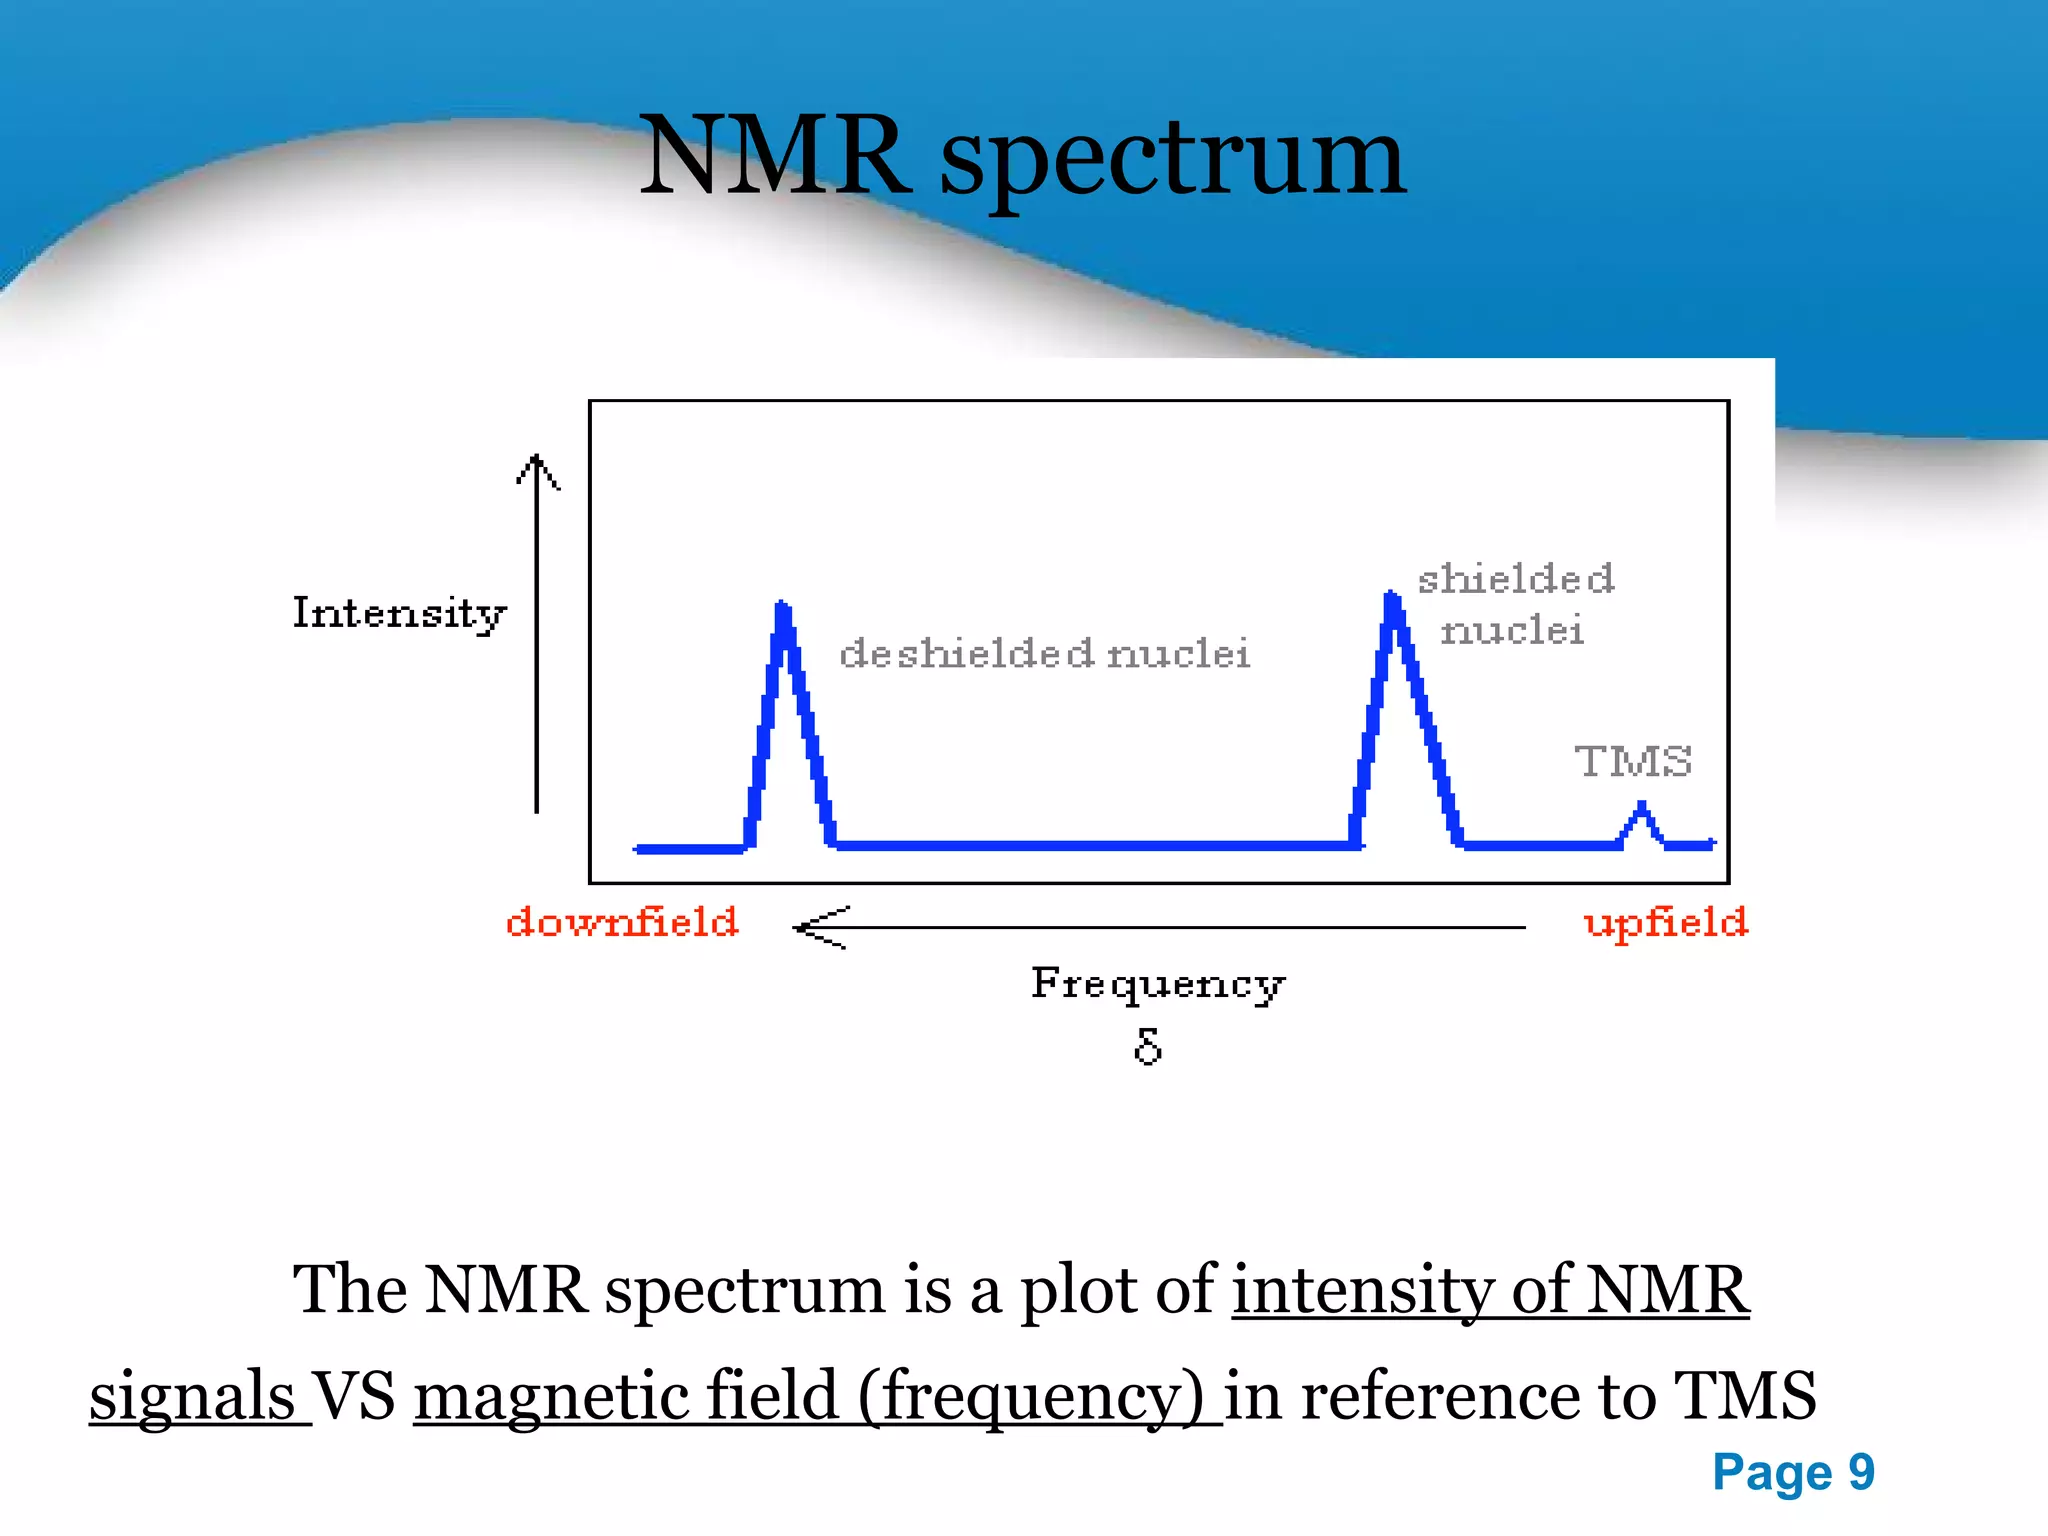
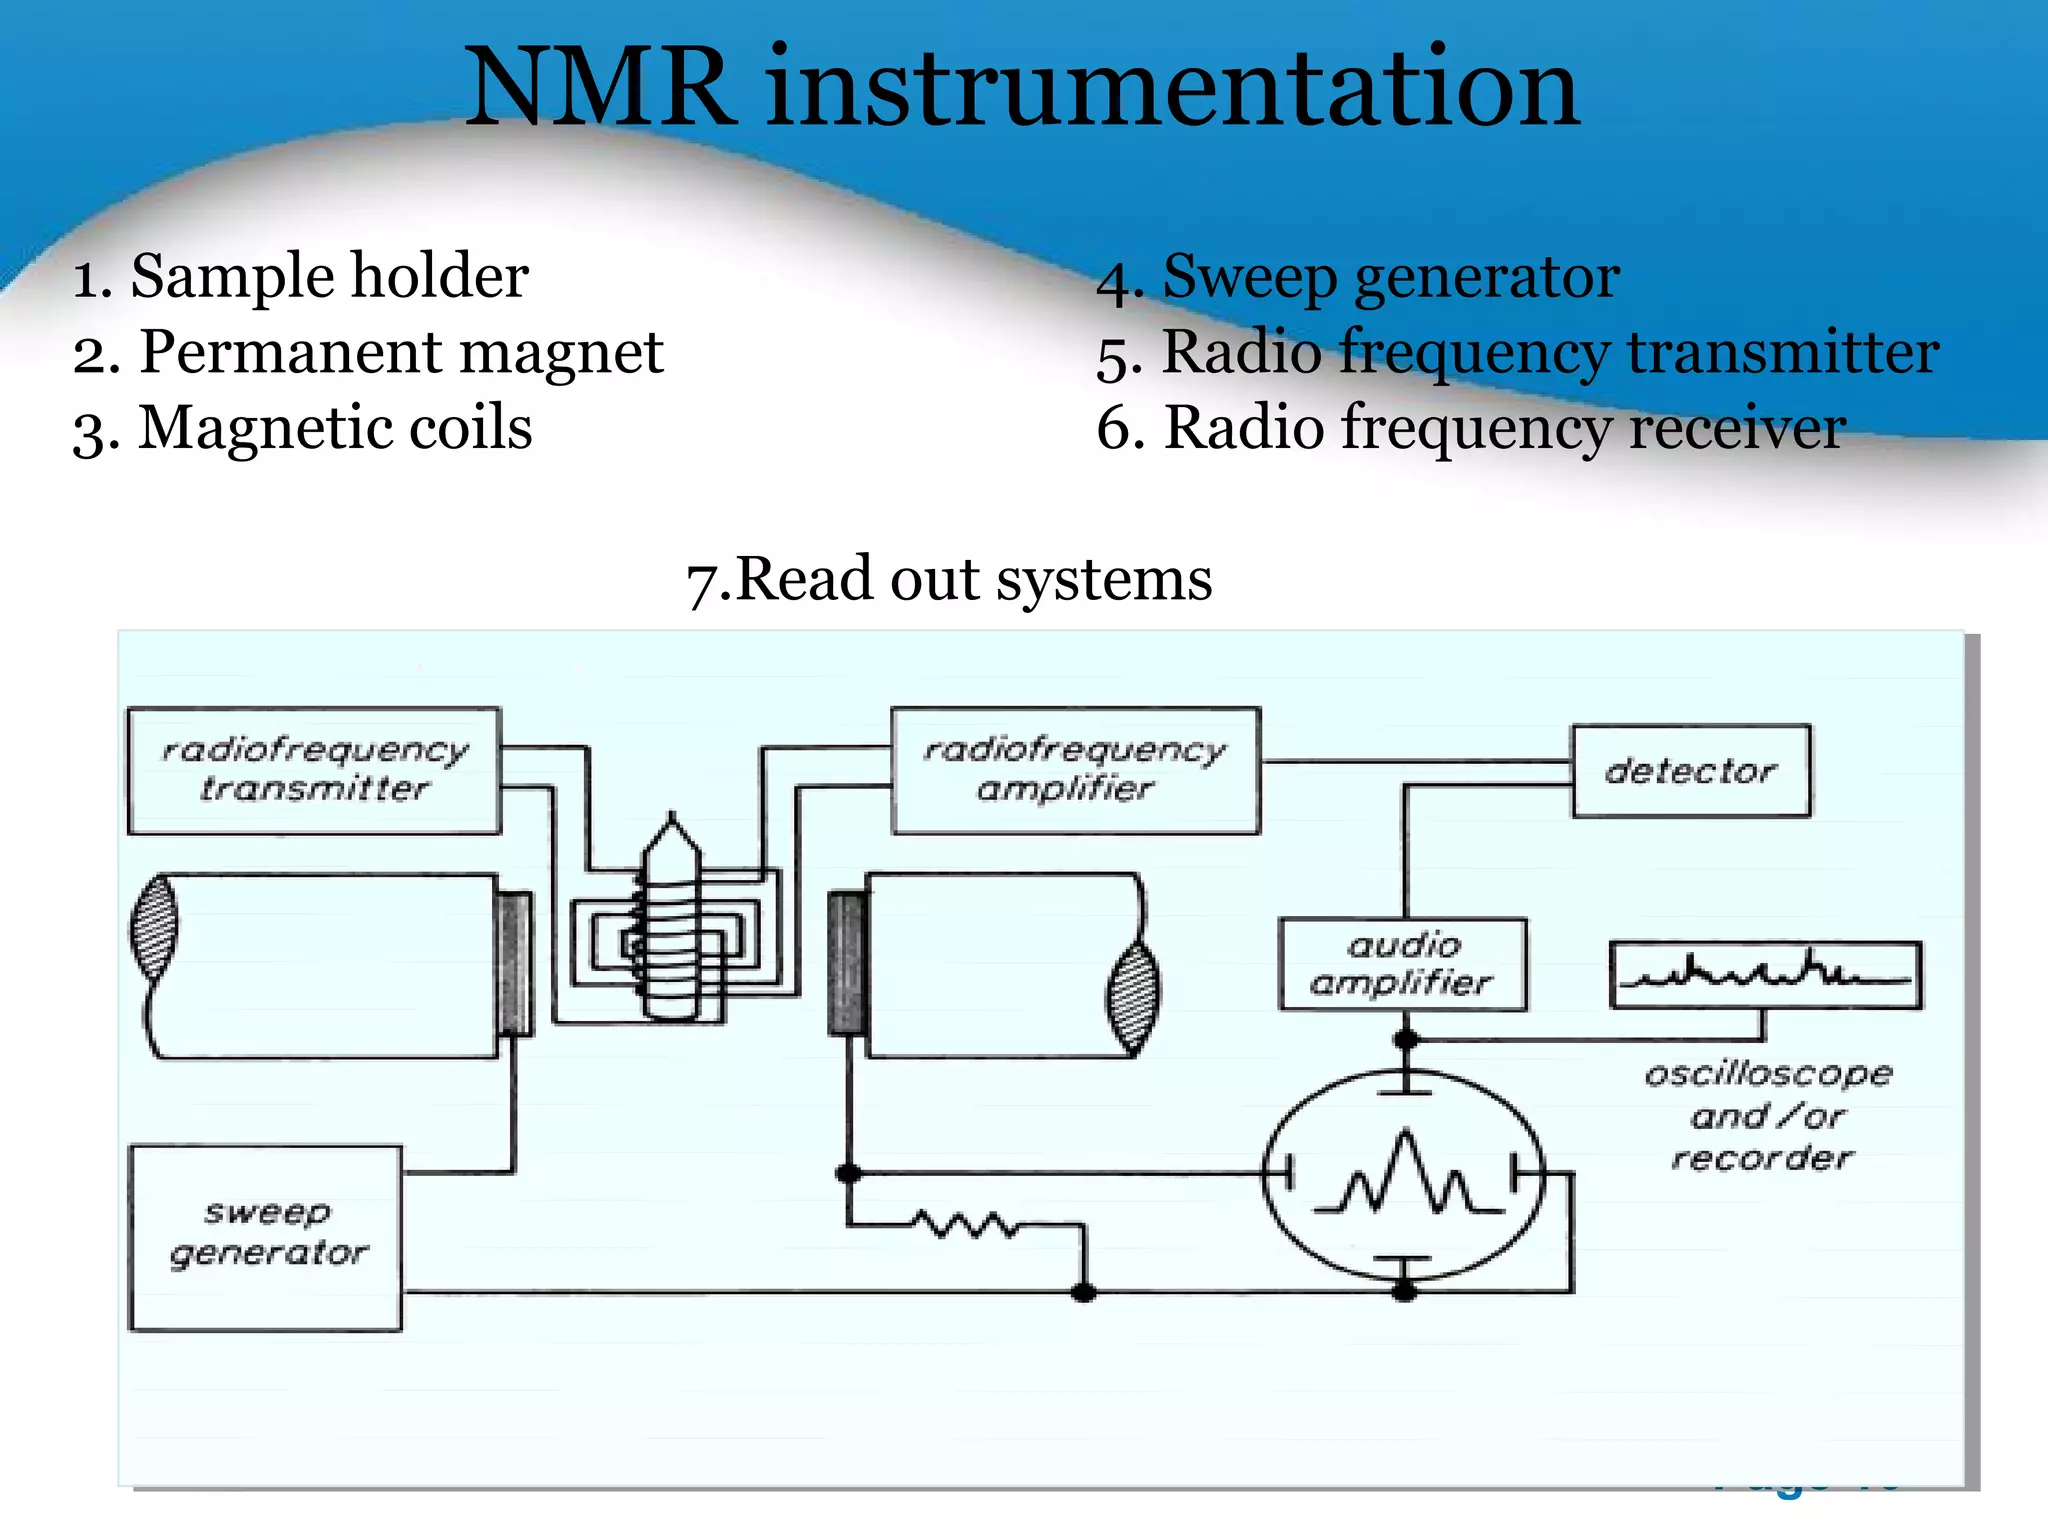
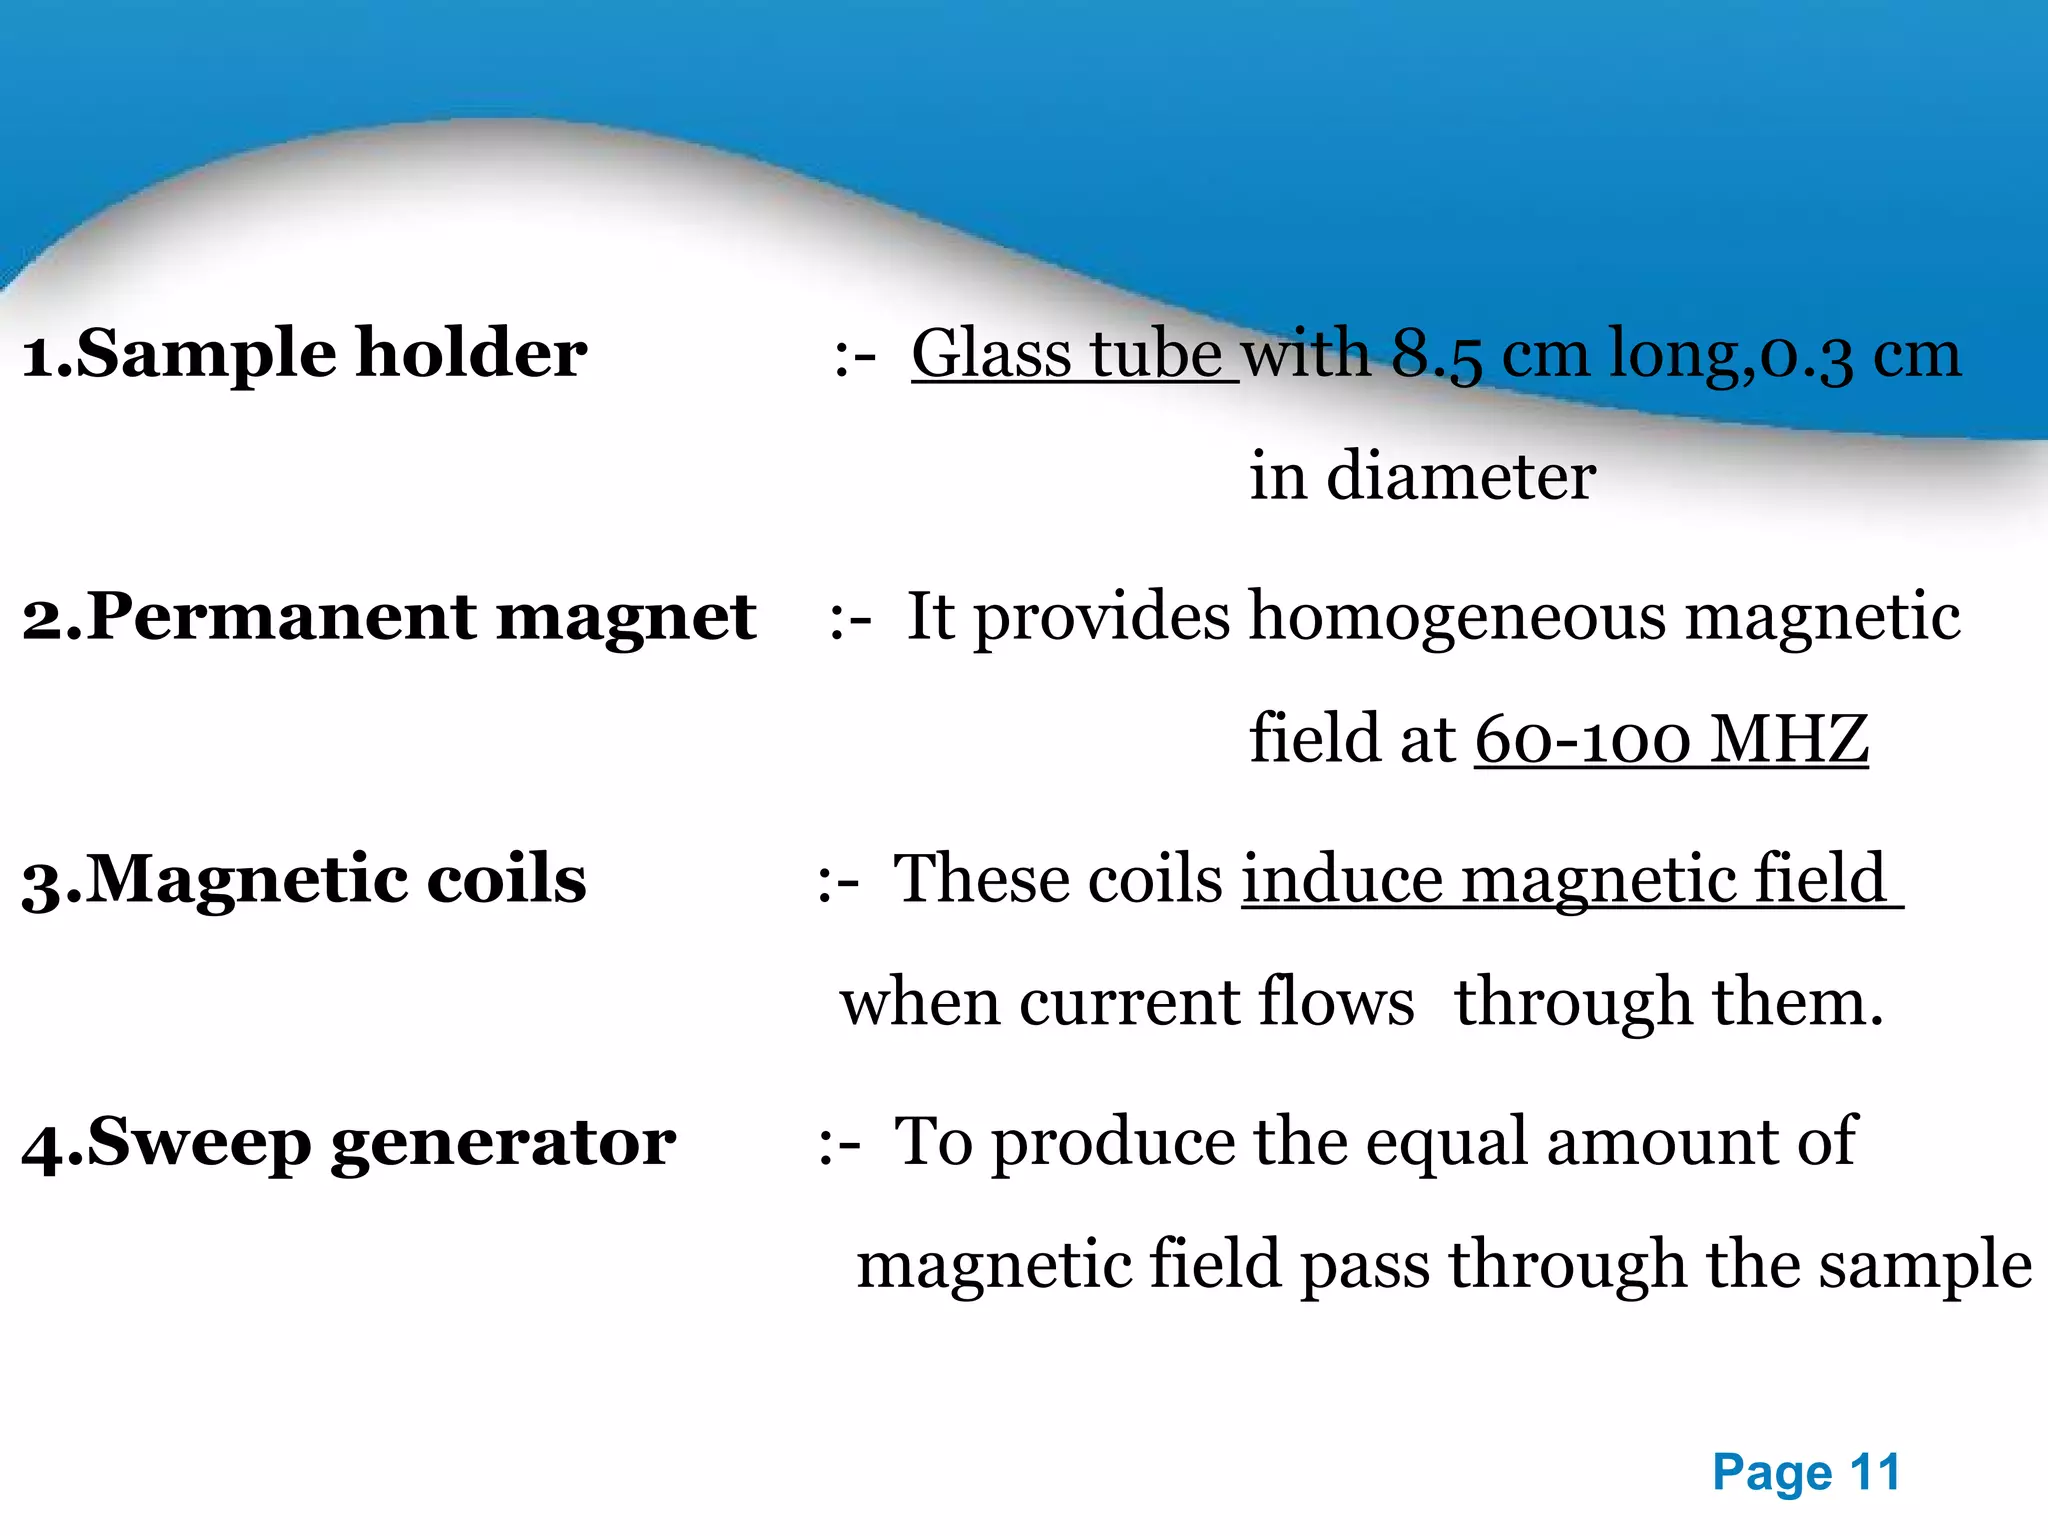
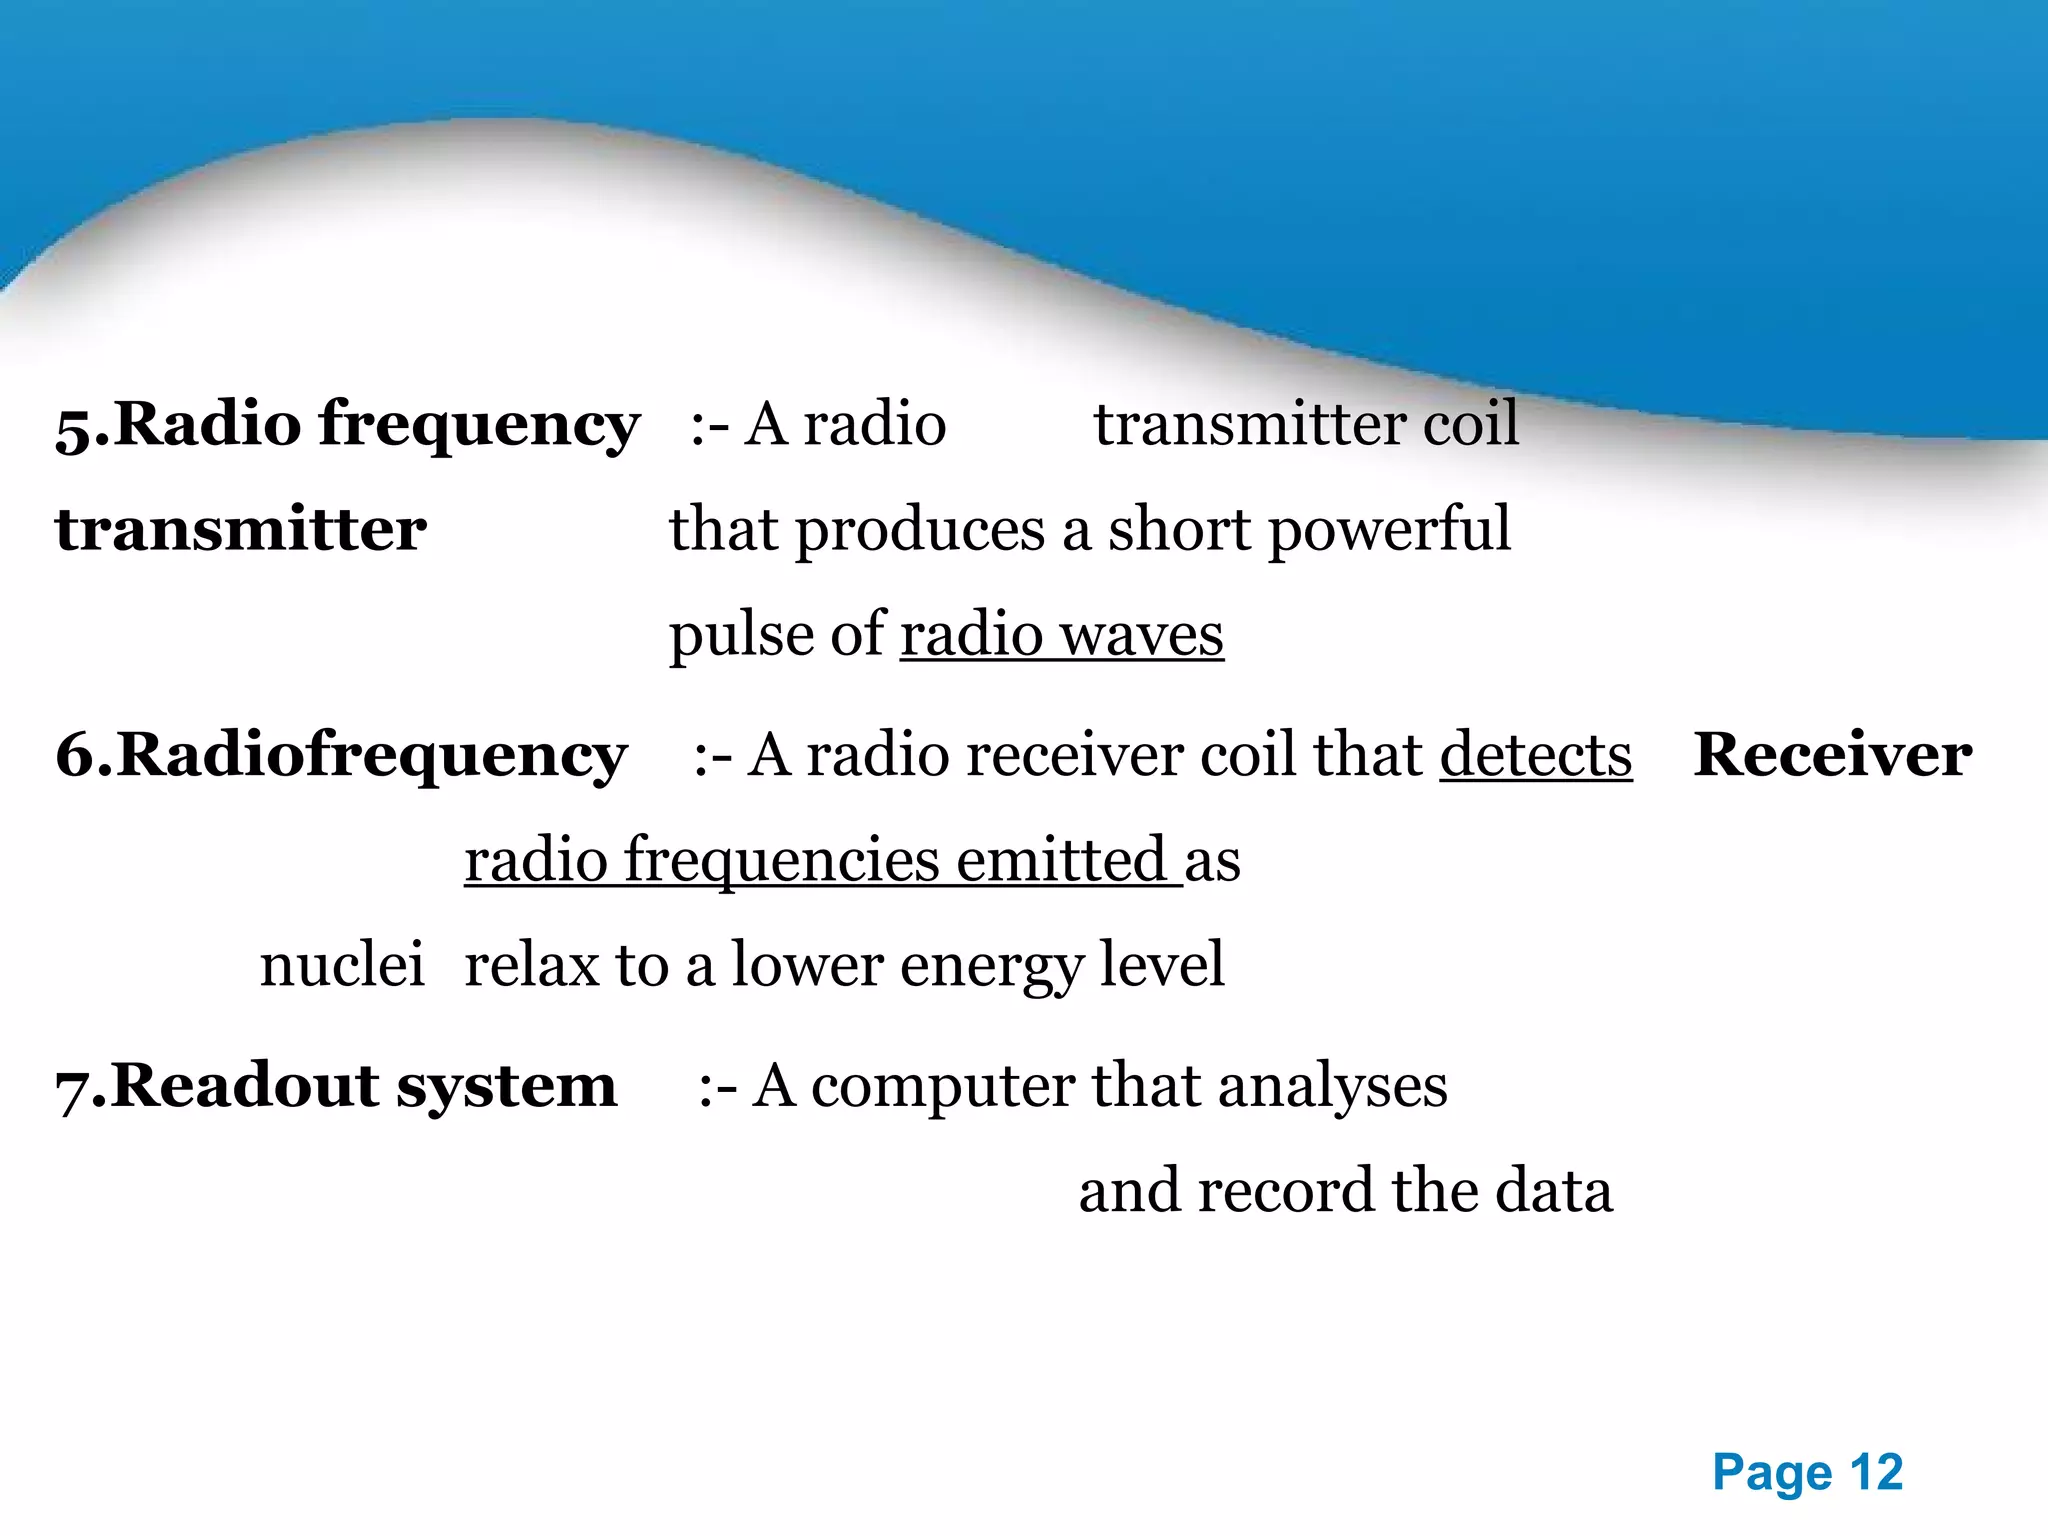
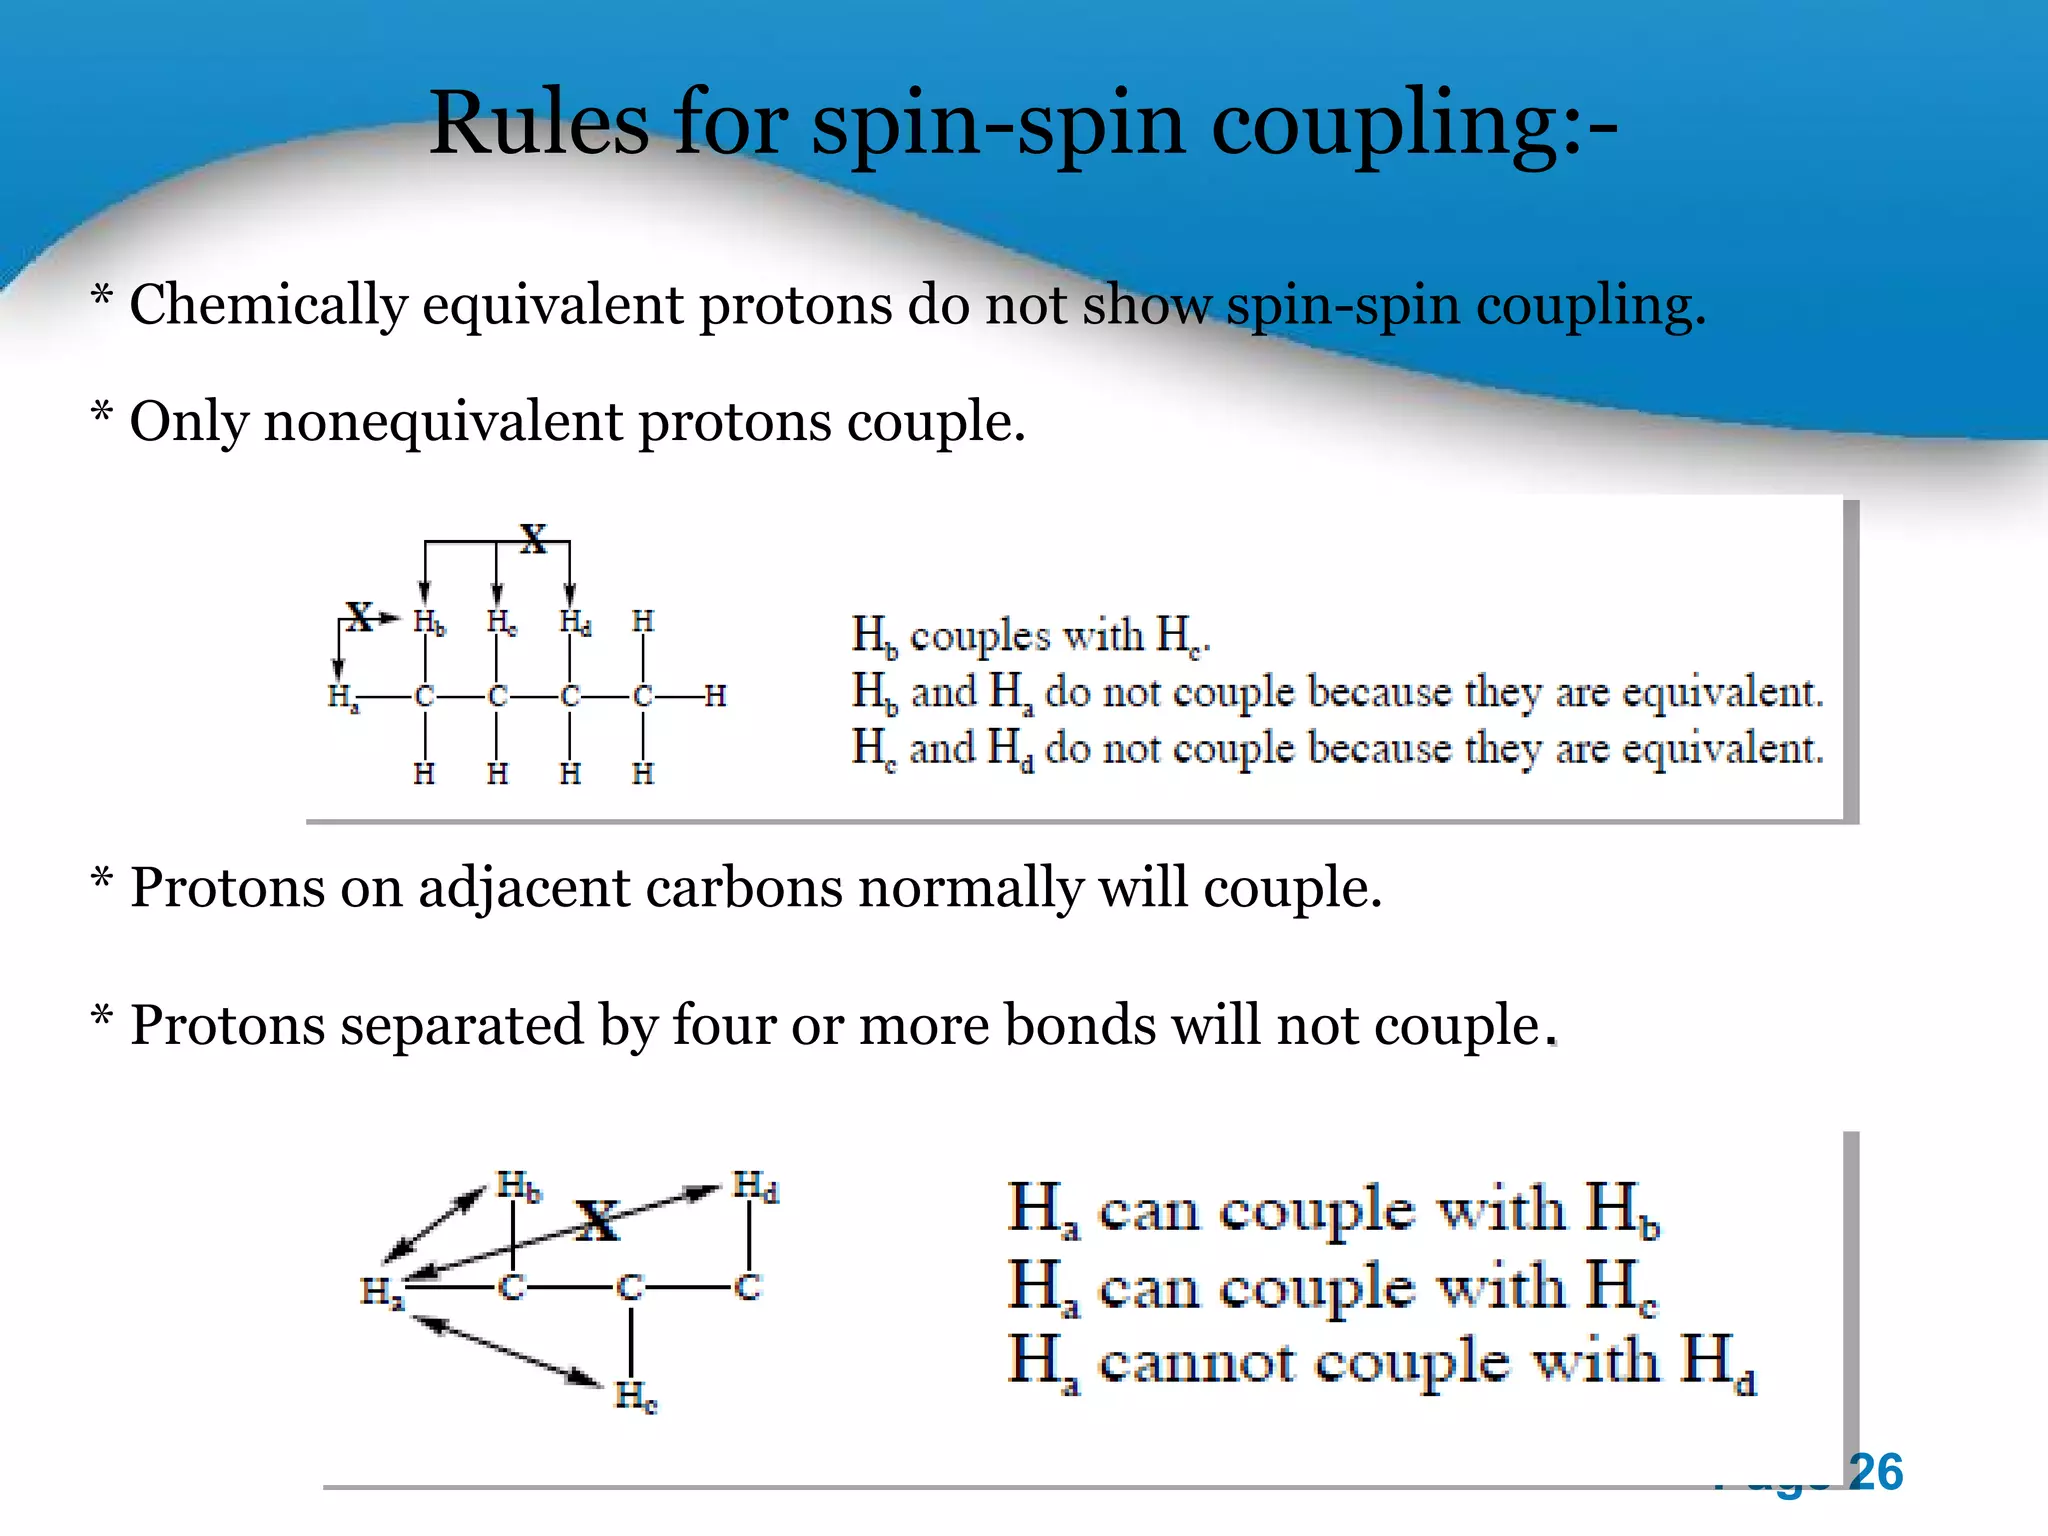
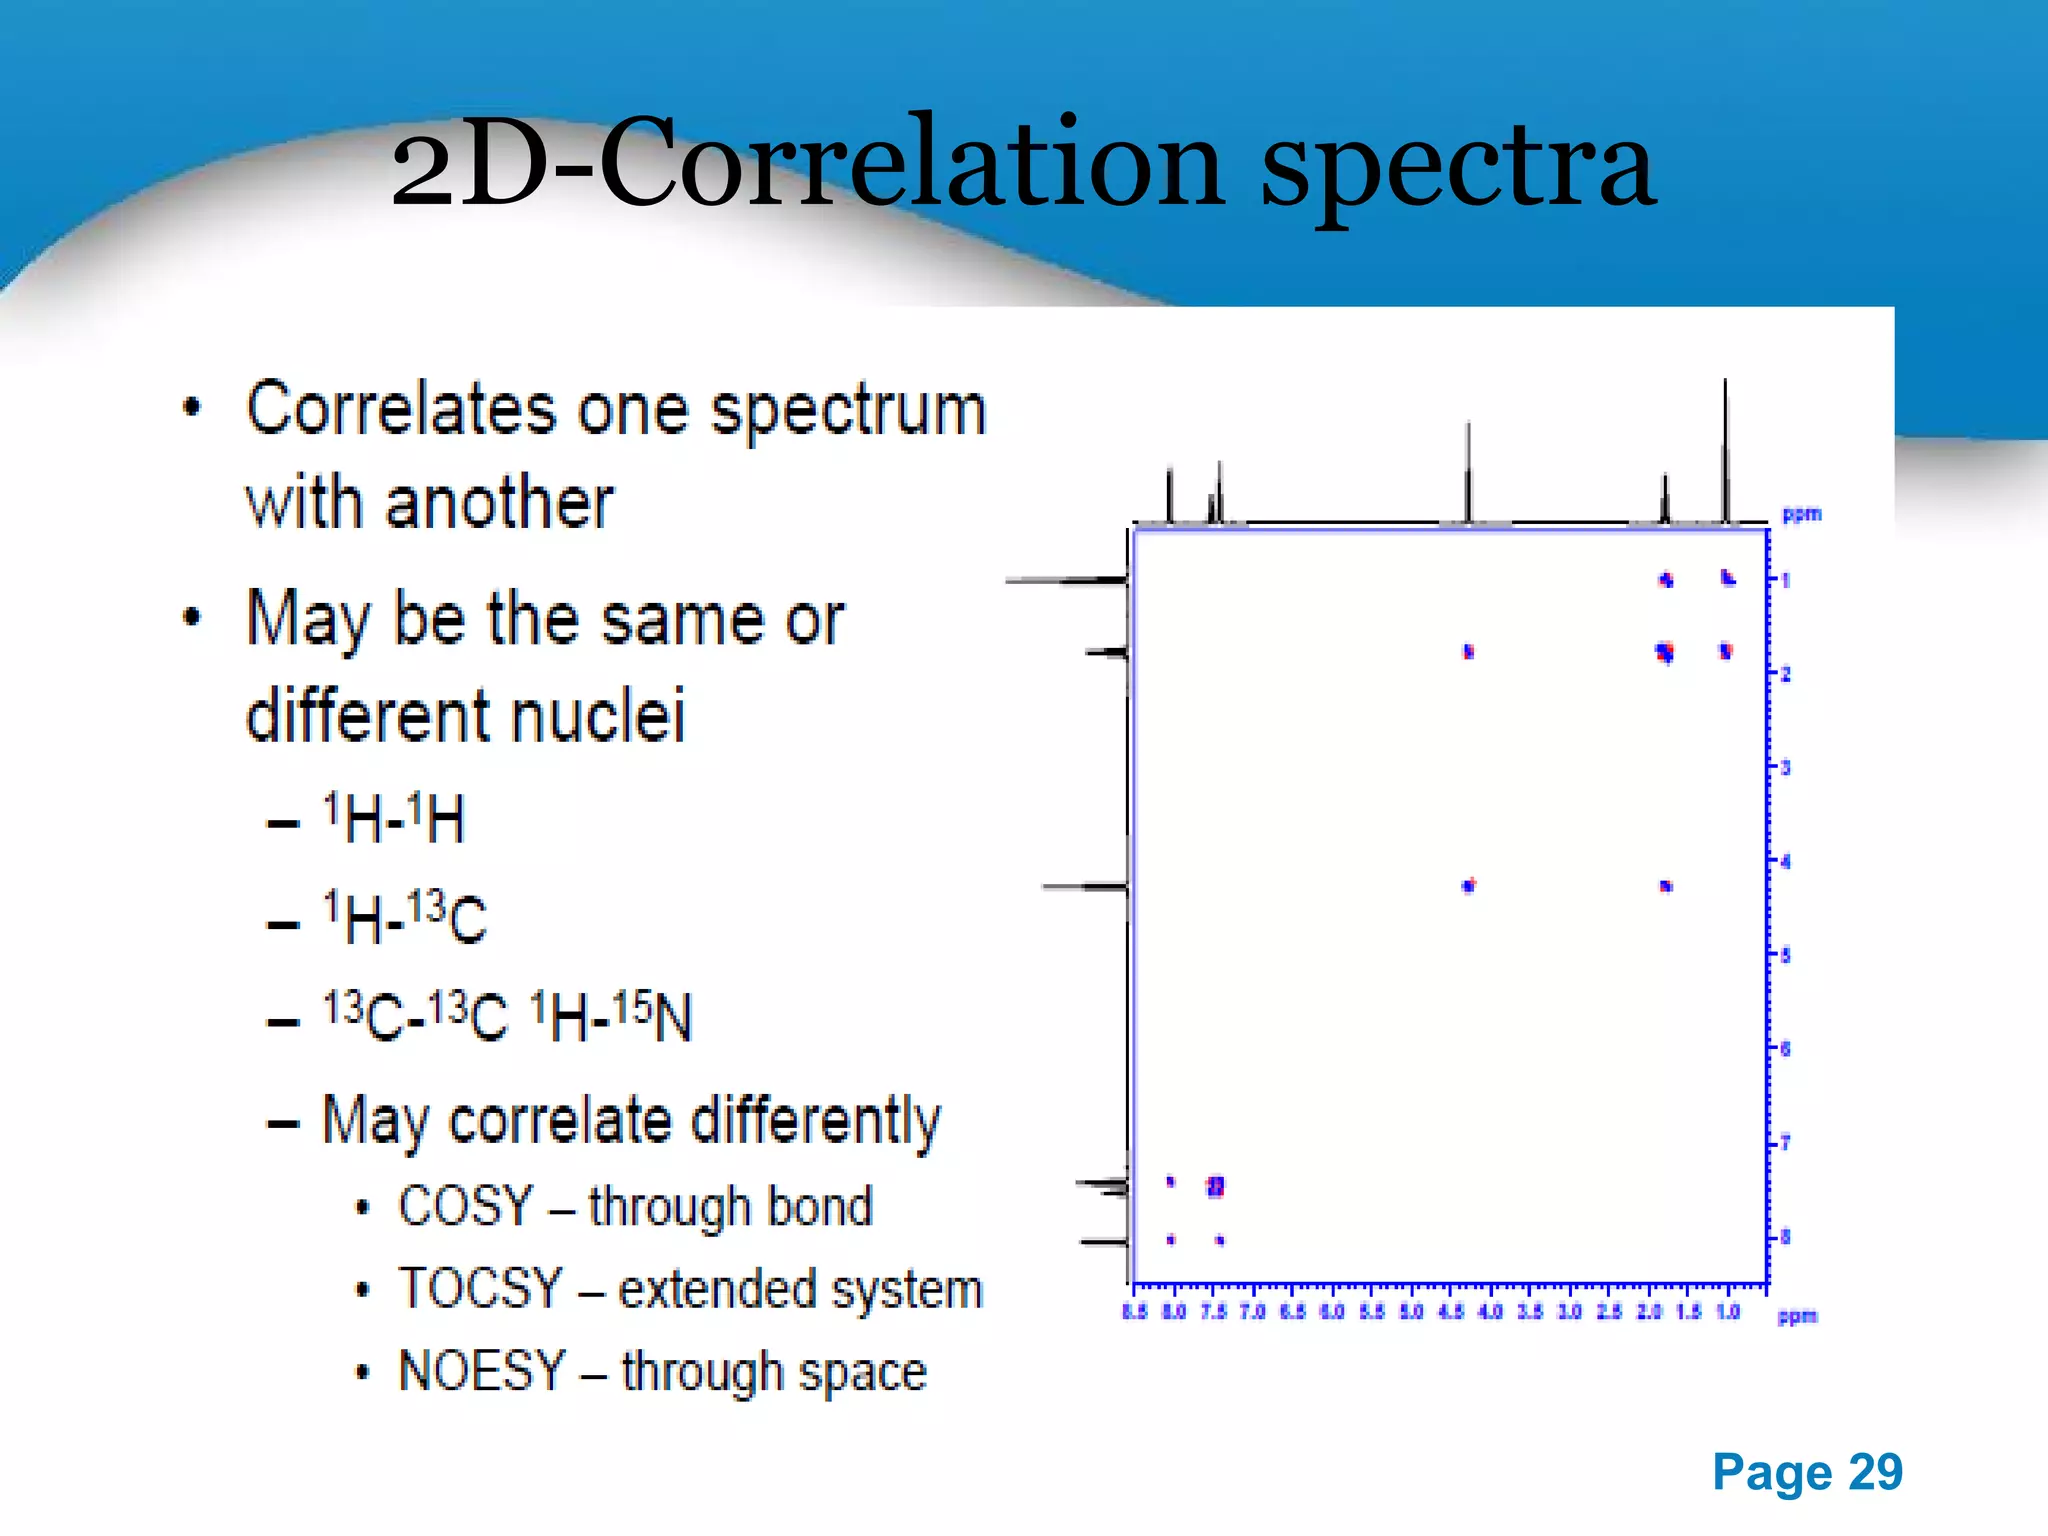
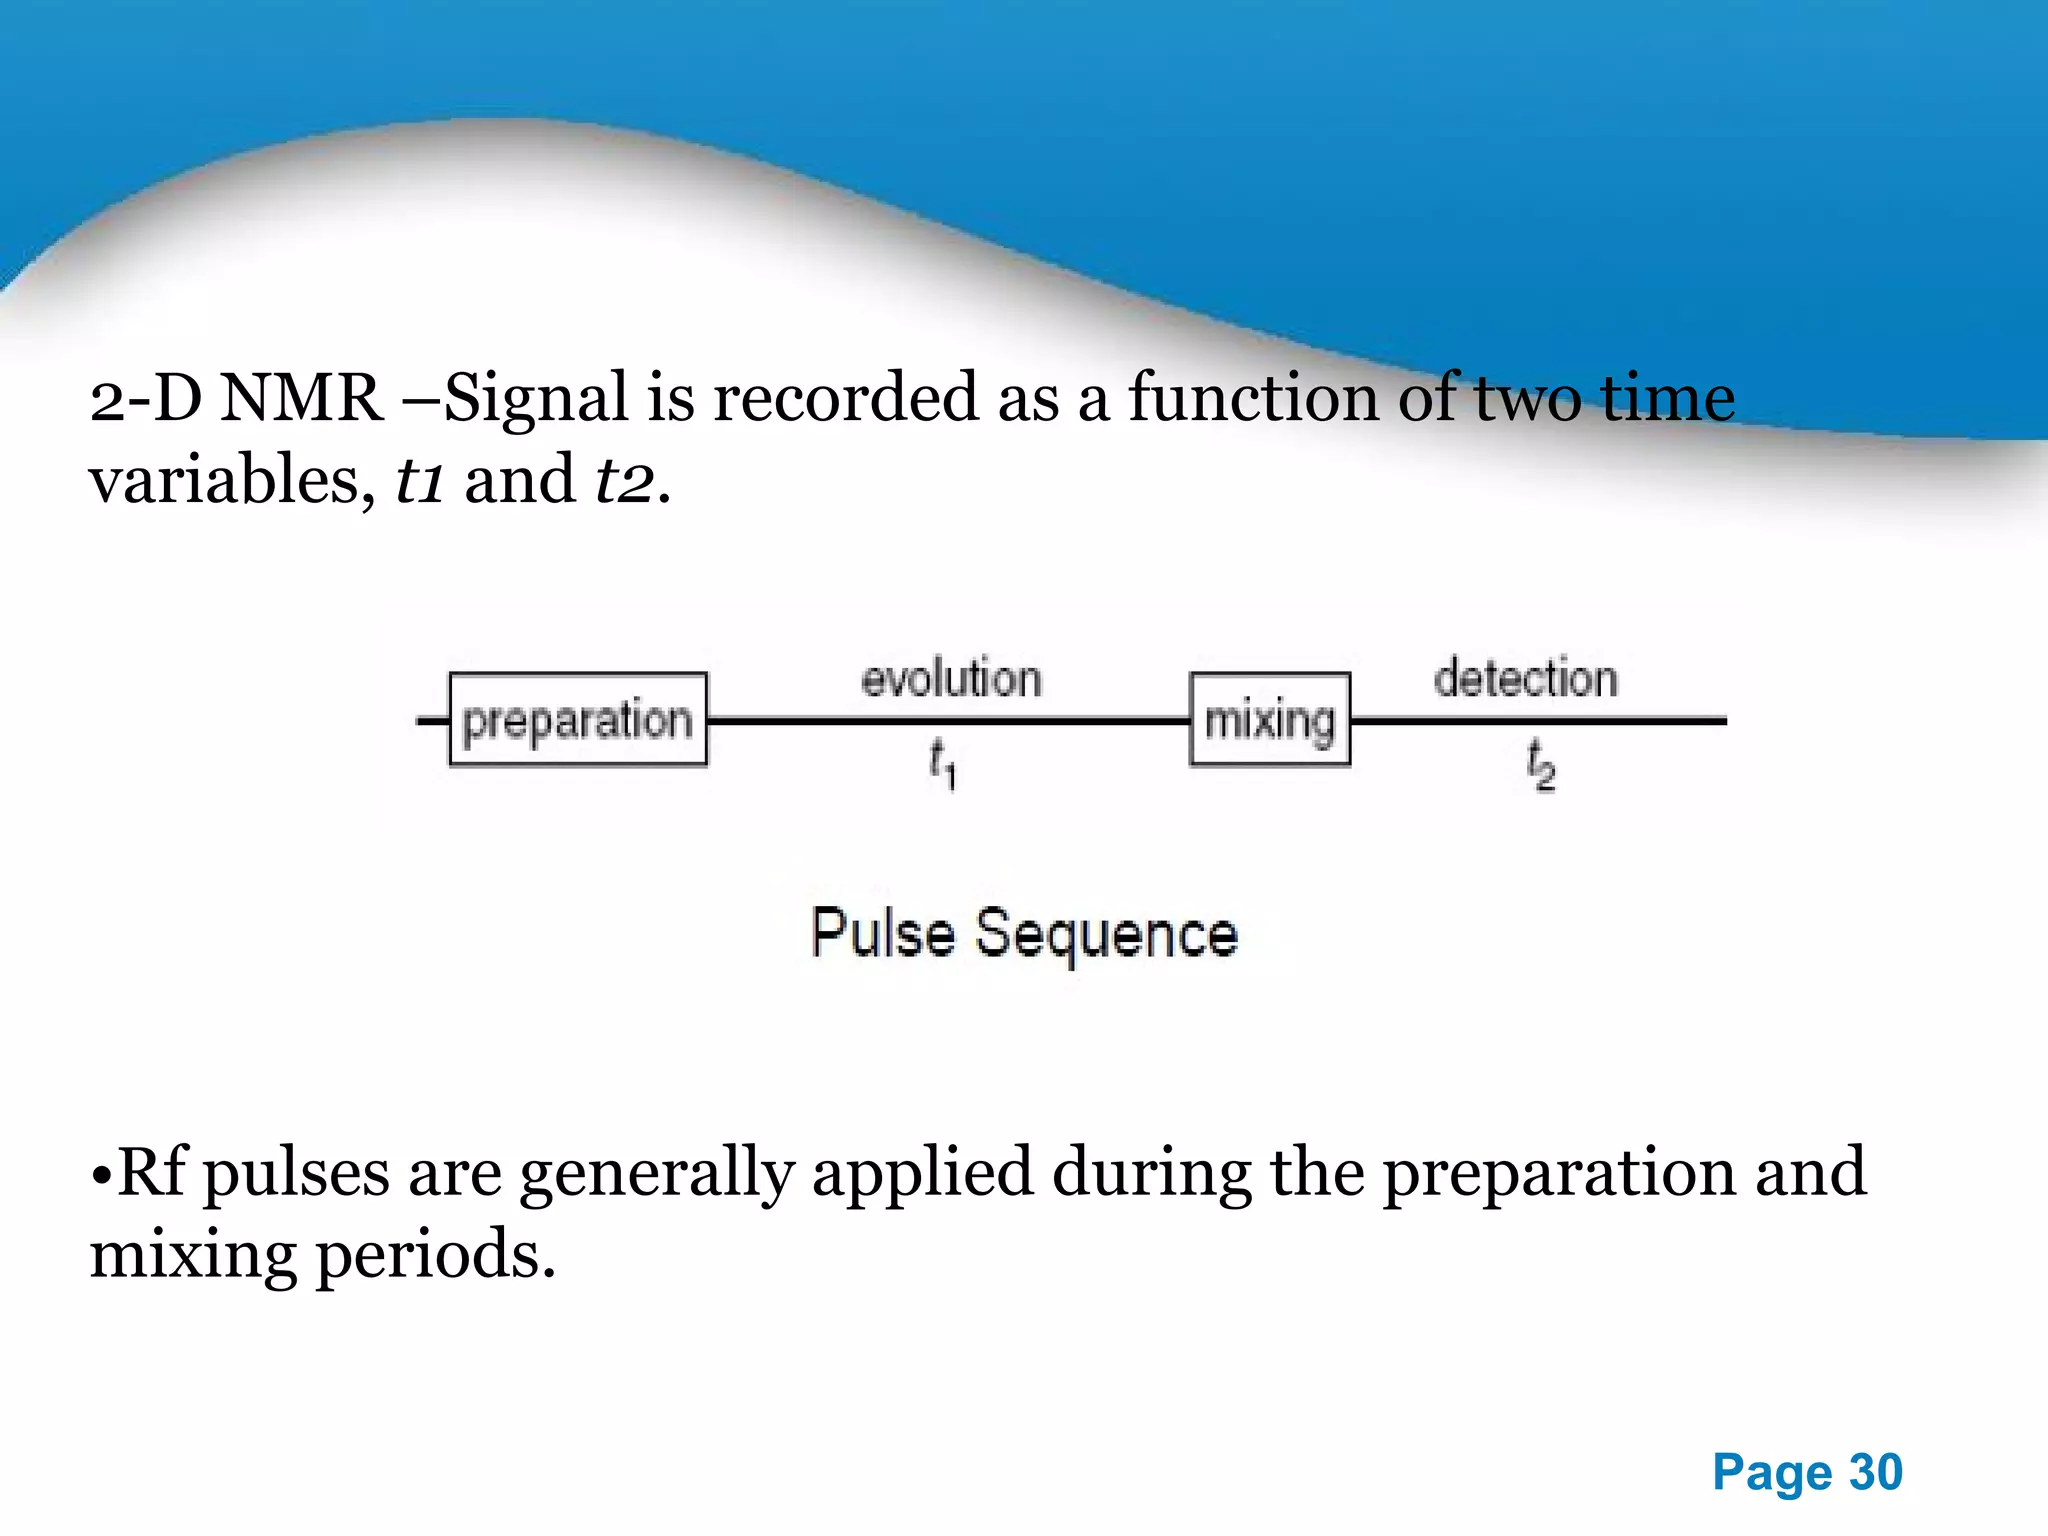
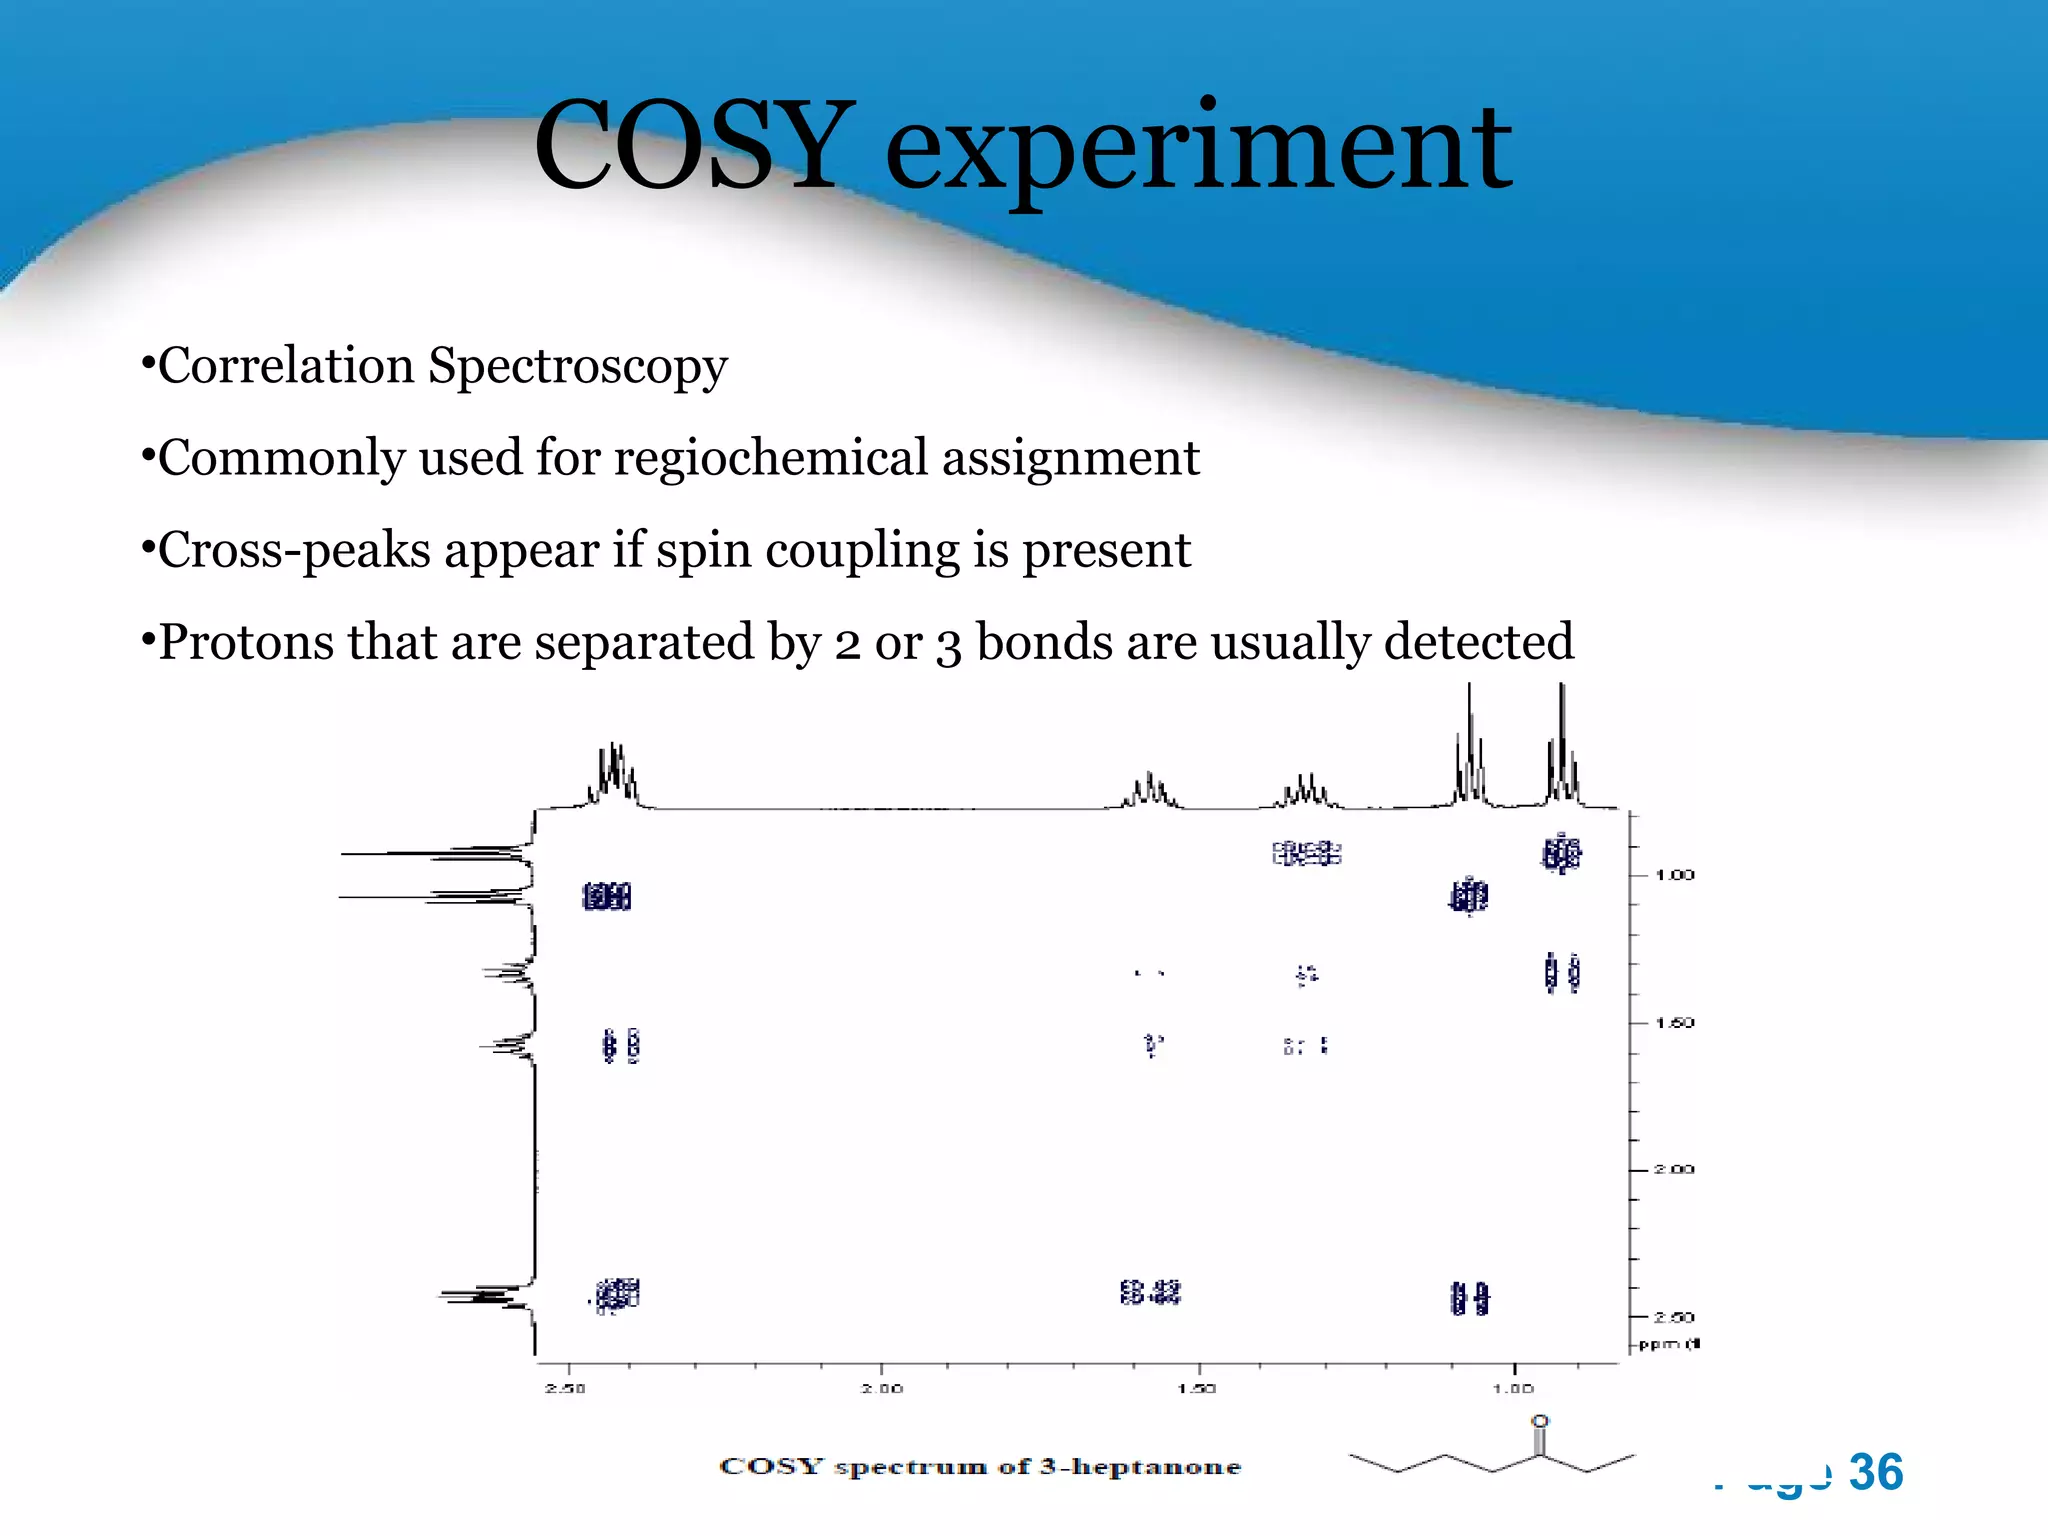
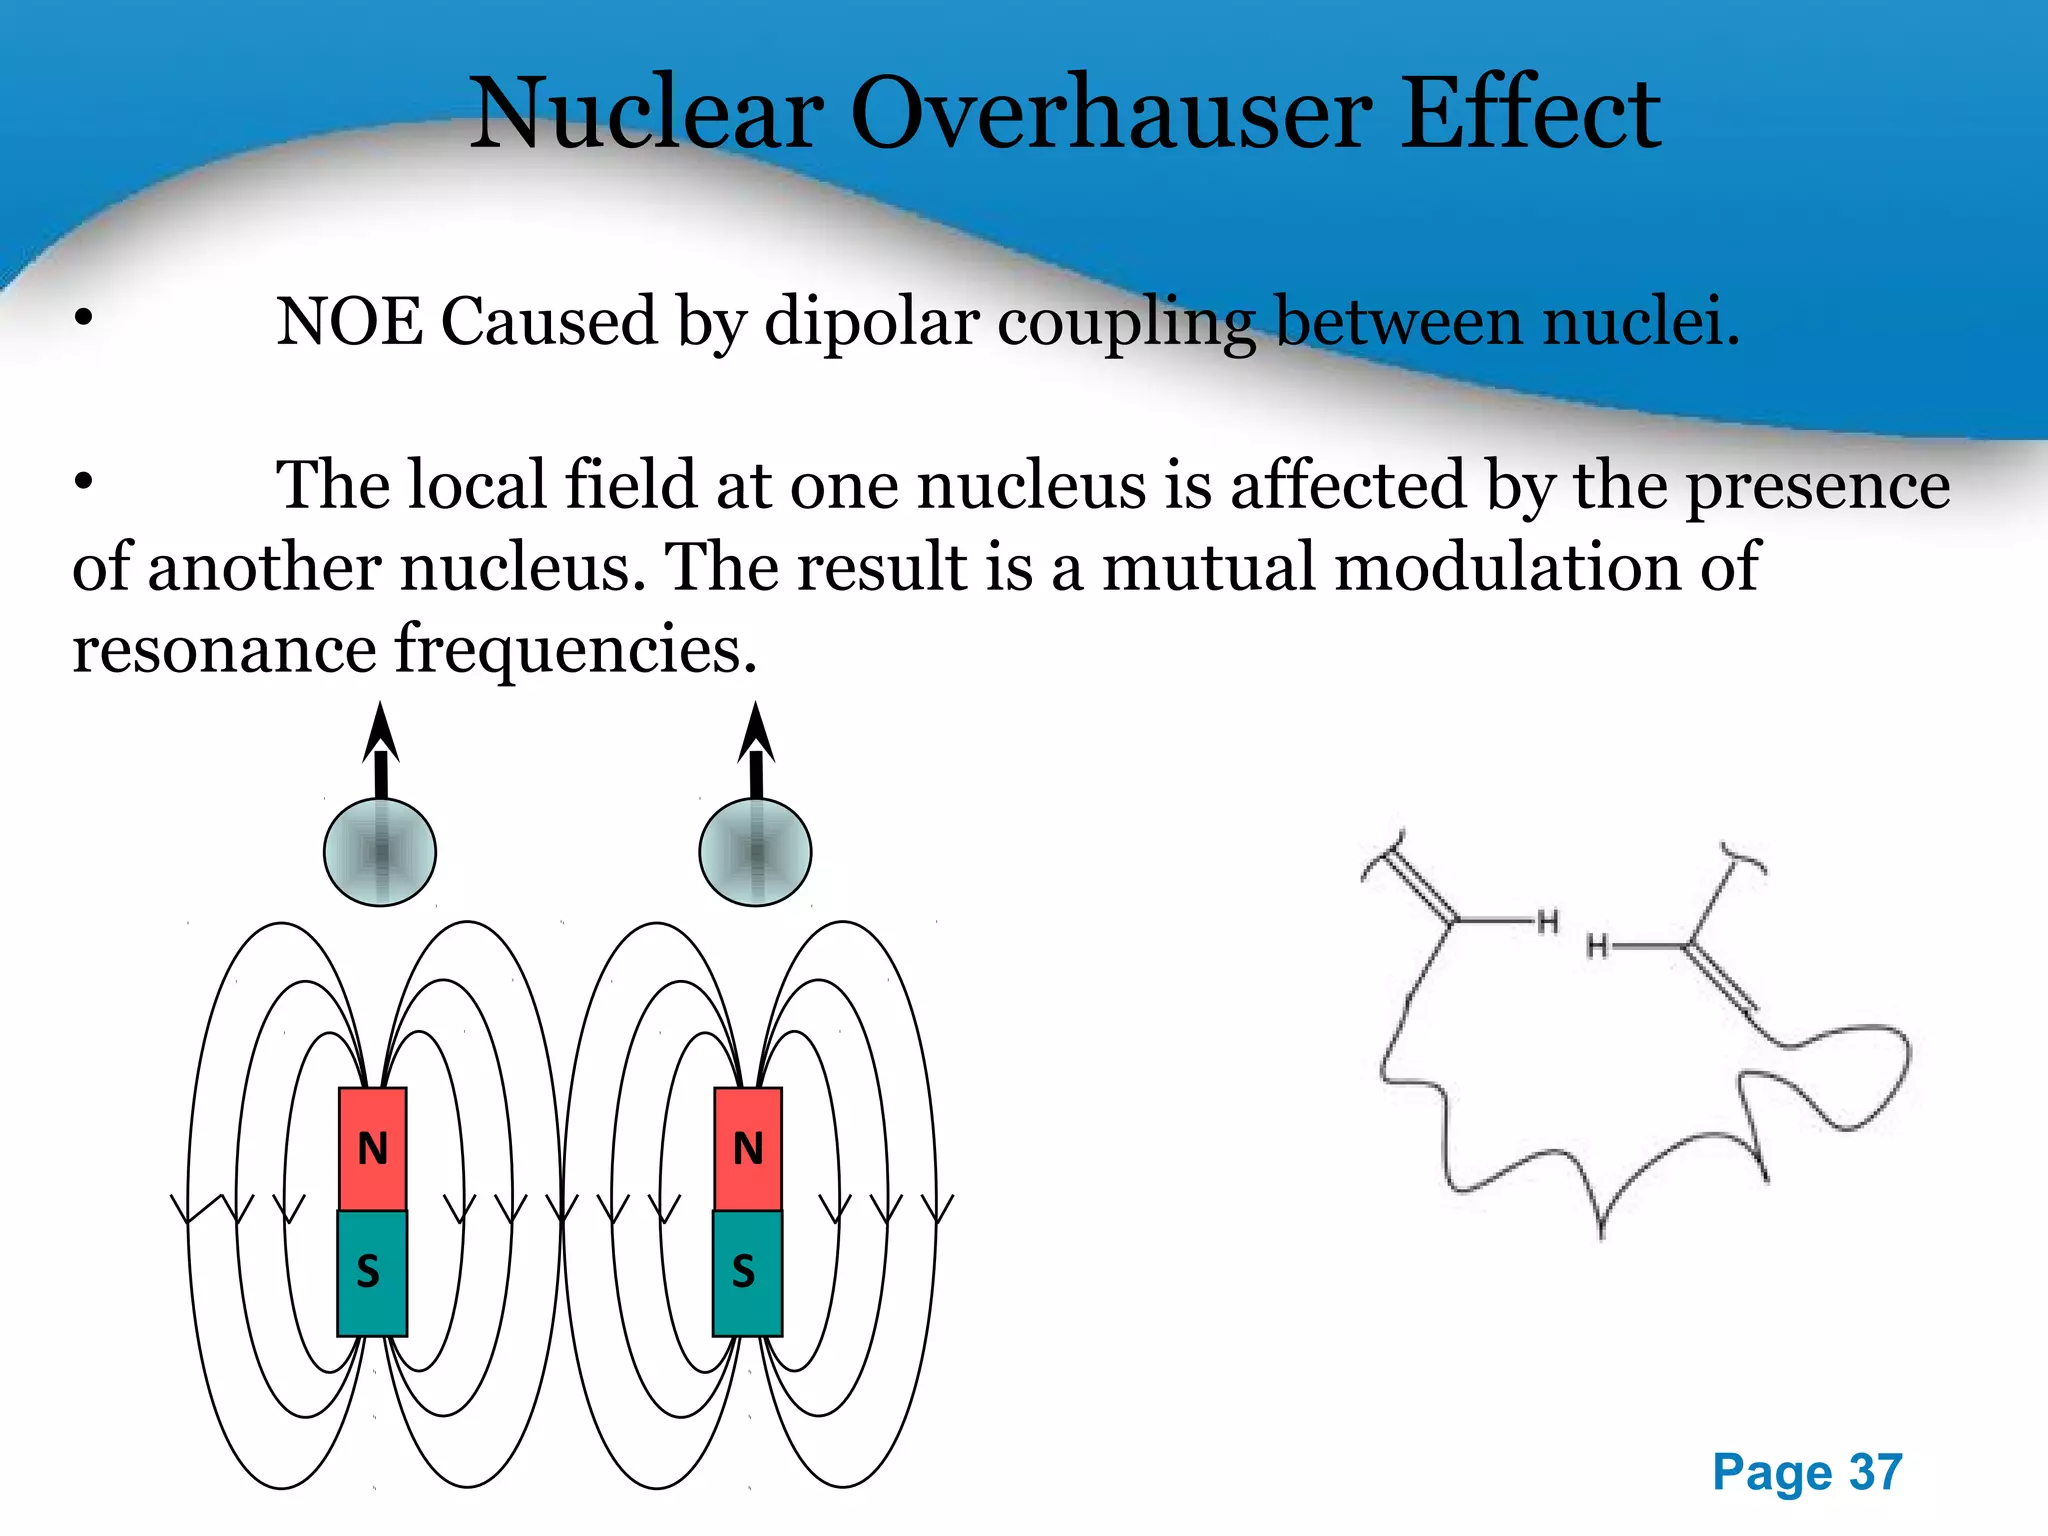
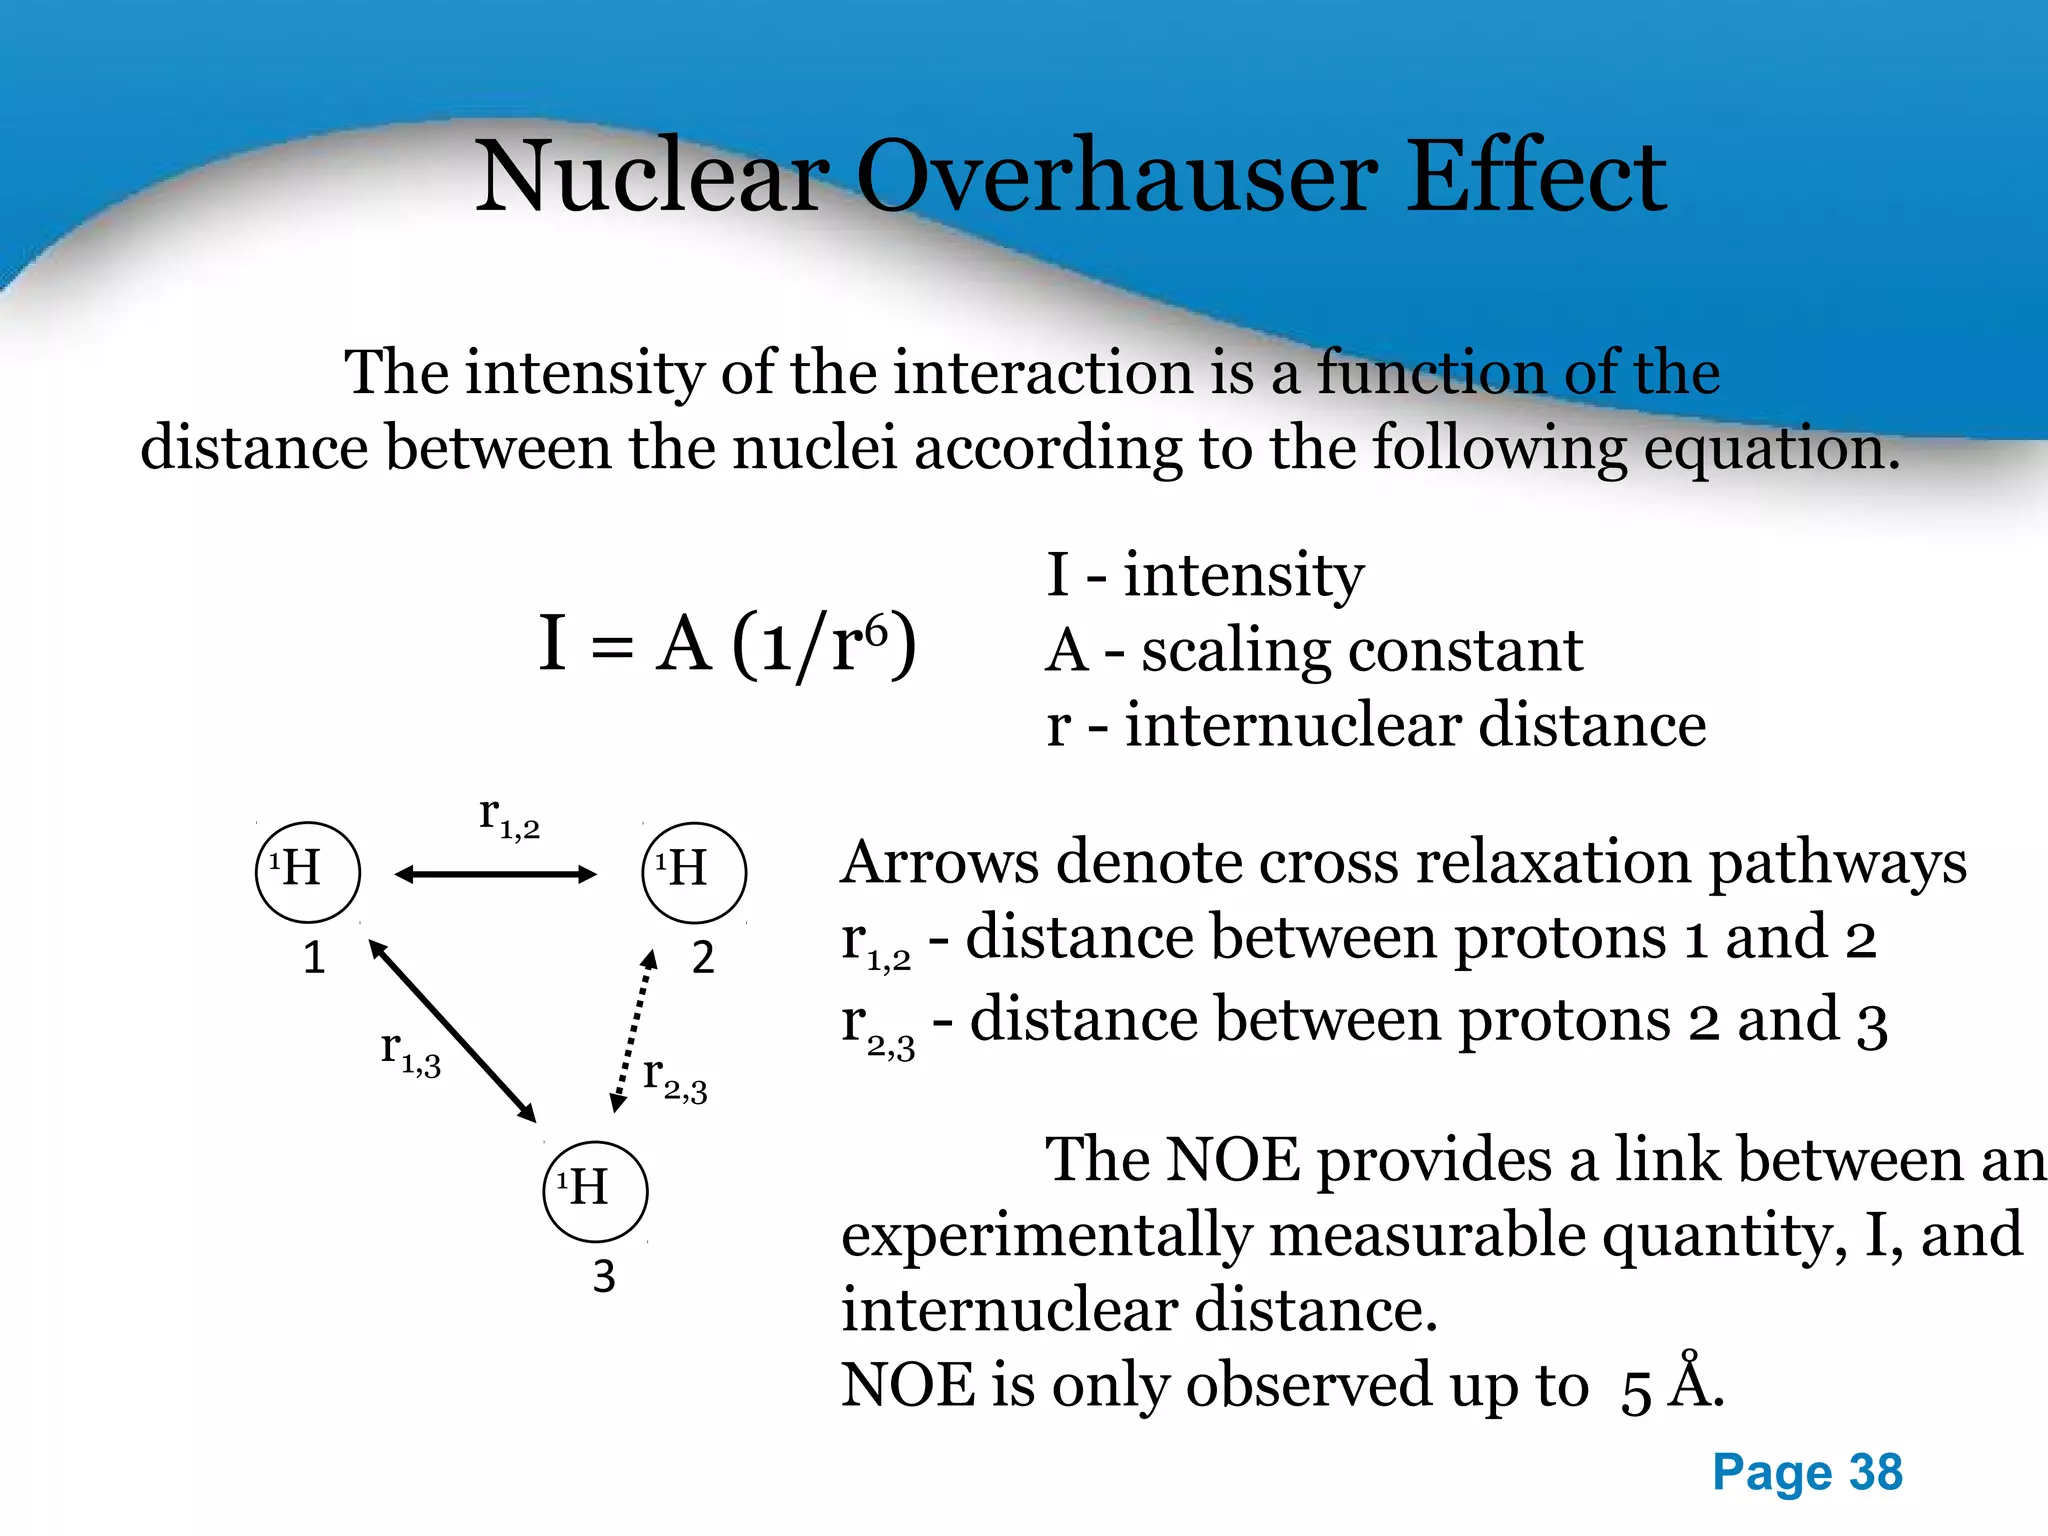
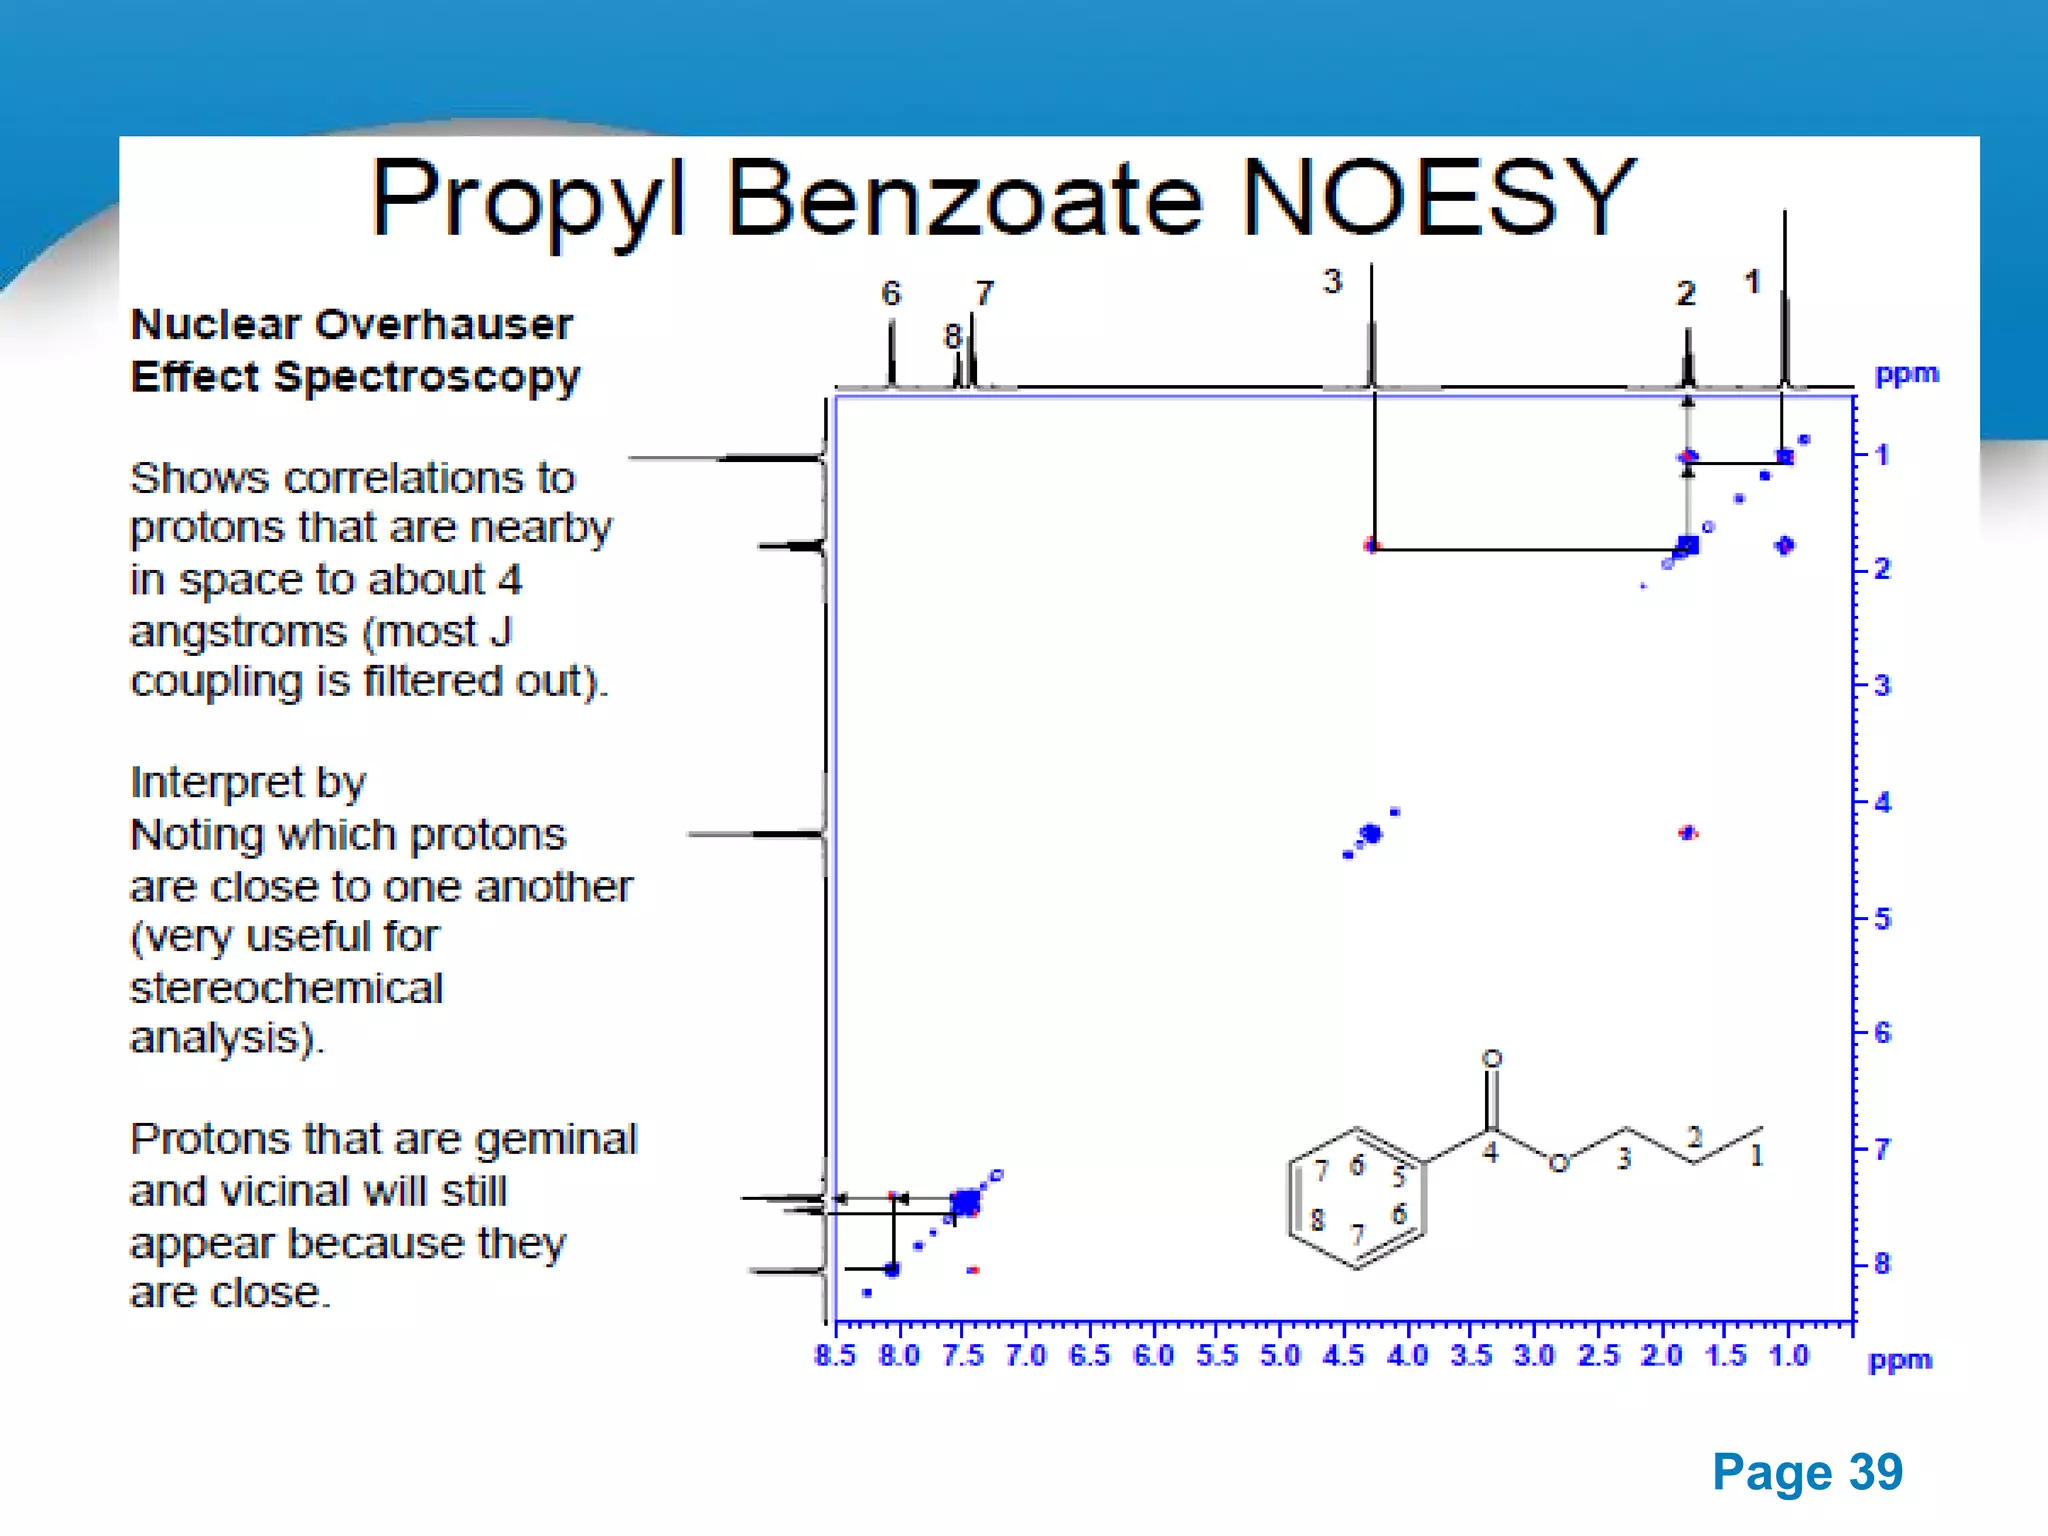
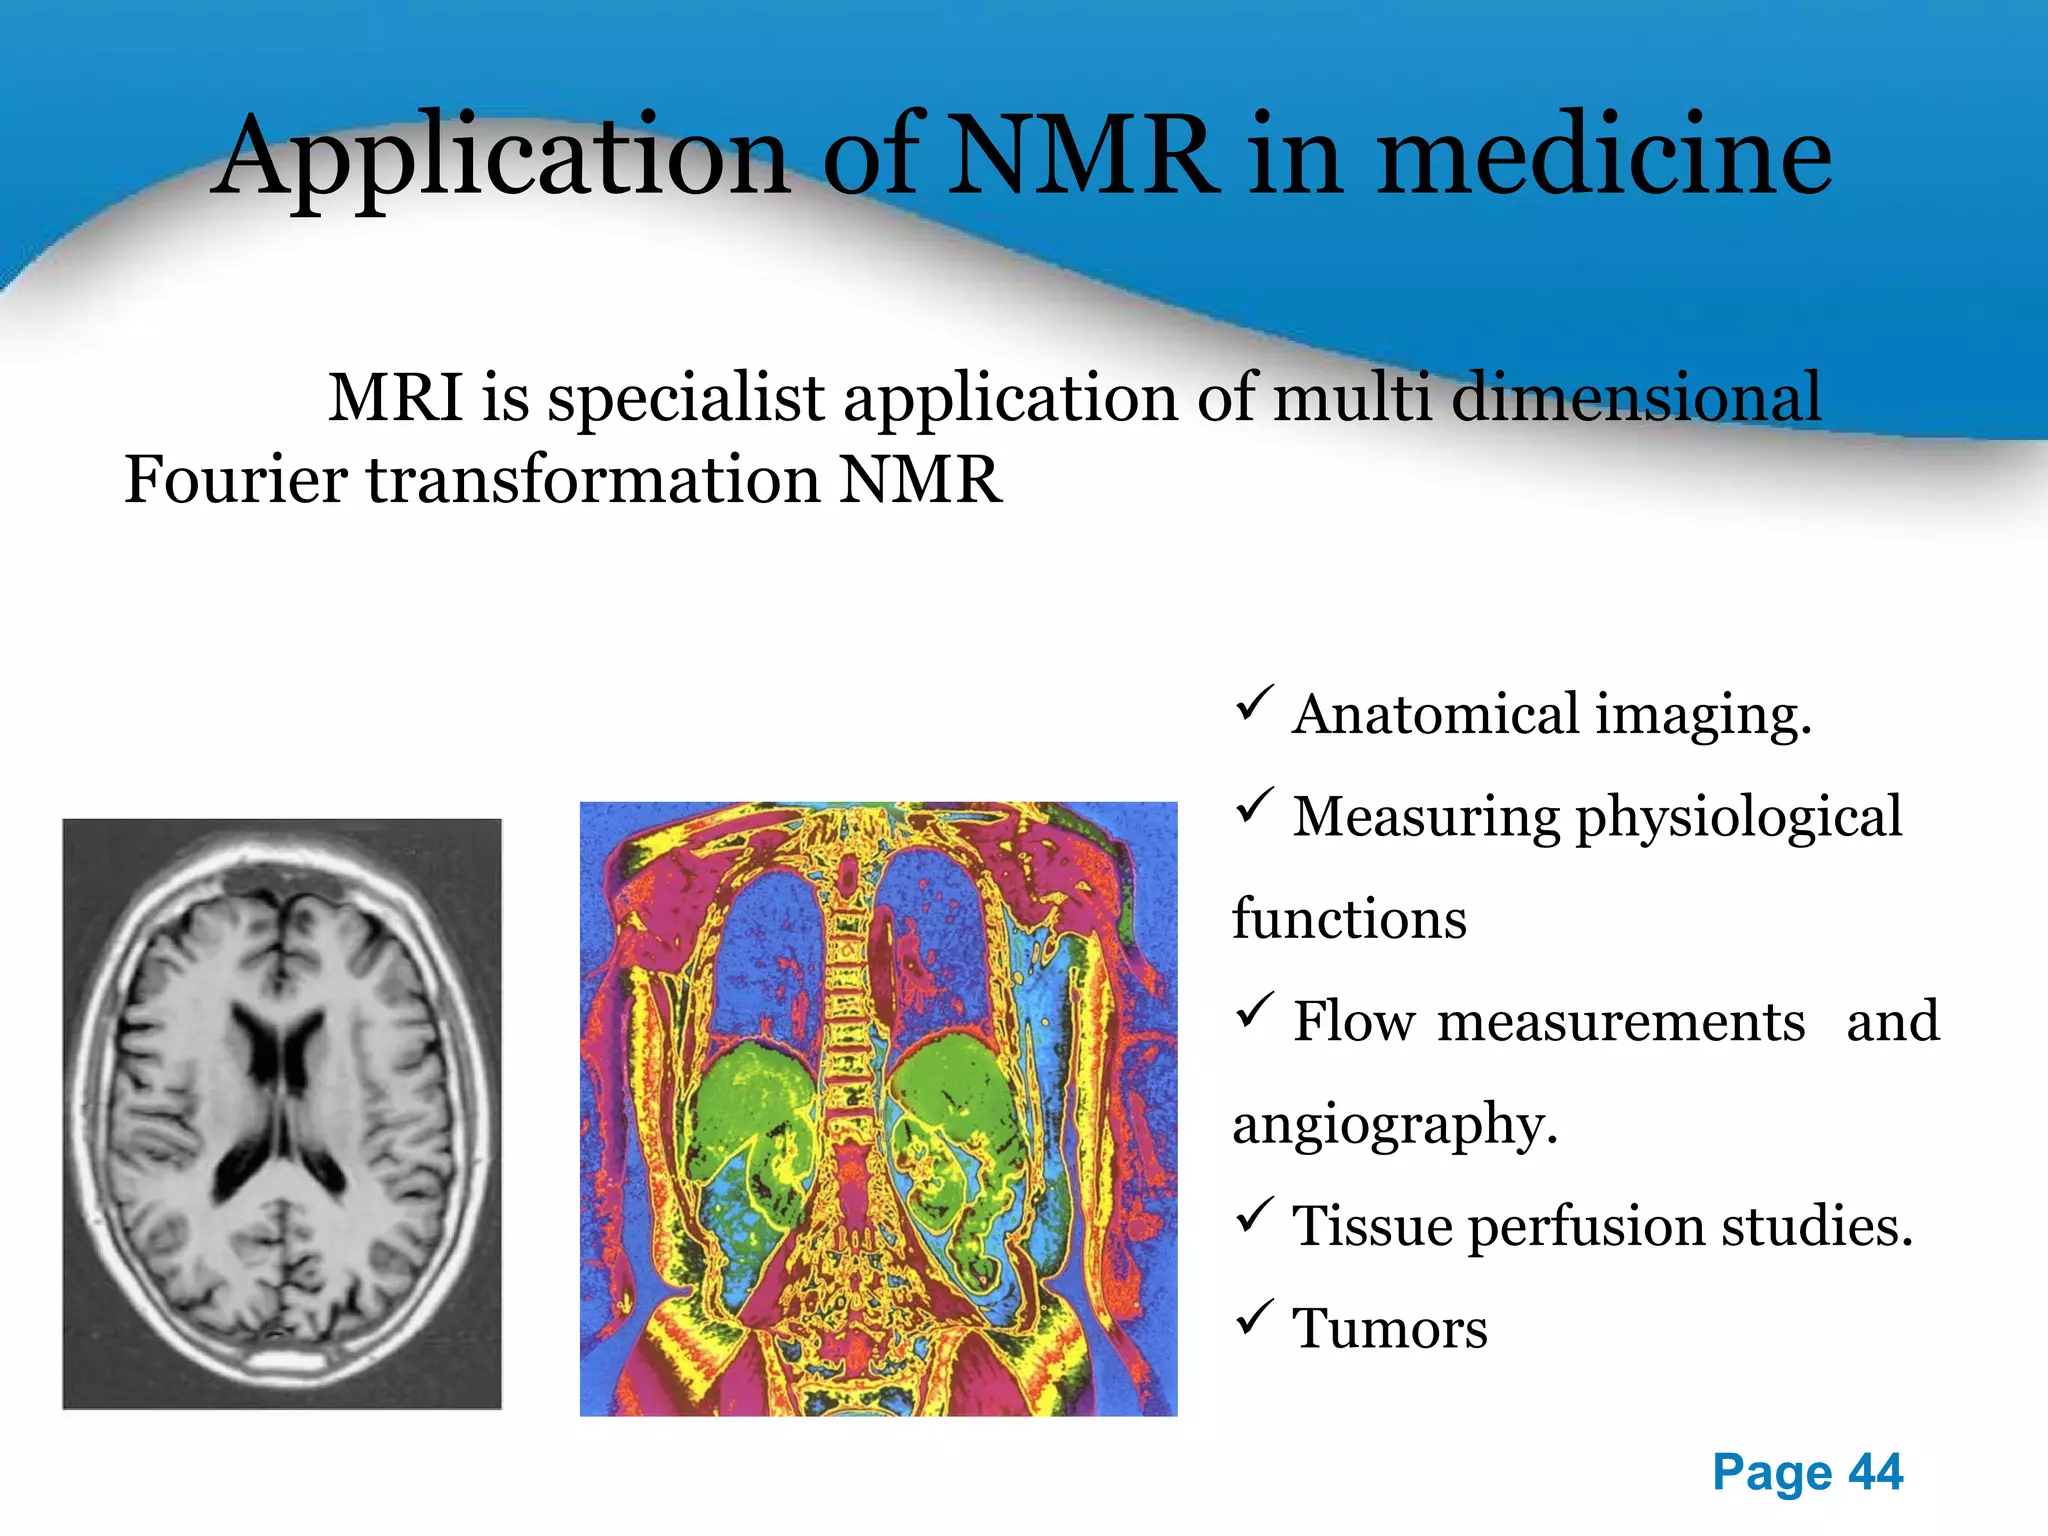
Advertisement

Nmr spectroscopy

Research Scientist at SUN PHARMA
Aug. 6, 2012
Advertisement

More Related Content

Advertisement

Nmr spectroscopy

  1. Powerpoint Templates Page 1 A.Solairajan 1st year M.pharm(analysis)
  2. Presentation outline •Introduction -Spin-spin Coupling •Fundamental principles and theory -Coupling constant Powerpoint Templates Page 2 •Instrumentation -2D-NMR •Solvents -NOE •Chemical shift -NOESY •Factors affecting chemical shift -COSY •Interpretation of proton -Applications NMR spectra •Proton chemical shifts
  3. Powerpoint Templates Page 3 Introduction:- Nuclear Magnetic Resonance (NMR) is a spectroscopy technique which is based on the absorption of electromagnetic radiation in the radio frequency region 4 to 900 MHz by nuclei of the atoms. Proton Nuclear magnetic resonance spectroscopy is one of the most powerful tools for elucidating the number of hydrogen or proton in the compound. It is used to study a wide variety of nuclei: • 1H 15N • 19F 19F •13C 31P
  4. Powerpoint Templates Page 4 Theory of NMR:- Spin quantum number (I) is related to the atomic and mass number of the nucleus. Elements with either odd mass or odd atomic number have the property of nuclear “spin”.
  5. If an external magnetic field is applied, the number of Powerpoint Templates Page 5 possible orientations calculated by (2I+1). Hydrogen has spin quantum number I=1/2 and possible orientation is (2*1/2+1=2) two +1/2 and -1/2.
  6. Principles of NMR Powerpoint Templates Page 6 The theory behind NMR comes from the spin of a nucleus and it generates a magnetic field. Without an external applied magnetic field, the nuclear spins are random in directions. But when an external magnetic field(Bo), is present the nuclei align themselves either with or against the field of the external magnet.
  7. Powerpoint Templates Page 7 If an external magnetic field is applied, an energy transfer (ΔE) is possible between ground state to excited state. when the spin returns to its ground state level, the absorbed radiofrequency energy is emitted at the same frequency level. The emitted radiofrequency signal that give the NMR spectrum of the concerned nucleus. .
  8. The emitted radio frequency is directly proportional Powerpoint Templates Page 8 to the strength of the applied field. γBo 2П v = Bo= External magnetic field experienced by proton γ = Magnetogyric ratio ( The ratio between the nuclear magnetic moment and angular moment)
  9. Powerpoint Templates Page 9 NMR spectrum The NMR spectrum is a plot of intensity of NMR signals VS magnetic field (frequency) in reference to TMS
  10. Powerpoint Templates Page 10 NMR instrumentation 1. Sample holder 4. Sweep generator 2. Permanent magnet 5. Radio frequency transmitter 3. Magnetic coils 6. Radio frequency receiver 7.Read out systems
  11. 1.Sample holder :- Glass tube with 8.5 cm long,0.3 cm Powerpoint Templates Page 11 in diameter 2.Permanent magnet :- It provides homogeneous magnetic field at 60-100 MHZ 3.Magnetic coils :- These coils induce magnetic field when current flows through them. 4.Sweep generator :- To produce the equal amount of magnetic field pass through the sample
  12. Powerpoint Templates Page 12 5.Radio frequency :- A radio transmitter coil transmitter that produces a short powerful pulse of radio waves 6.Radiofrequency :- A radio receiver coil that detects Receiver radio frequencies emitted as nuclei relax to a lower energy level 7.Readout system :- A computer that analyses and record the data
  13. Powerpoint Templates Page 13 Solvents used in NMR The following solvents are normally used in which hydrogen replaced by deuterium. CCl4 - carbon tetrachloride CS2 - carbon disulfide CDCl3 - Deuteriochloroform C6D6 - Hexa deuteriobenzene D2O - Deuterium oxide
  14. Powerpoint Templates Page 14 Chemical shift A chemical shift is defined as the difference in parts per million (ppm) between the resonance frequency of the observed proton and tetramethylsilane (TMS) hydrogens. TMS is the most common reference compound in NMR, it is set at δ=0 ppm
  15. Powerpoint Templates Page 15 Shielding of protons:- High electron density around a nucleus shields the nucleus from the external magnetic field and the signals are upfield in the NMR spectrum Deshielding of protons:- Lower electron density around a nucleus deshields the nucleus from the external magnetic field and the signals are downfield in the NMR spectrum
  16. Factors affecting chemical shift:- Powerpoint Templates Page 16 • Electronegative groups • Magnetic anisotropy of π-systems • Hydrogen bonding Electronegative groups:- Electronegative groups attached to the C-H system decrease the electron density around the protons, and there is less shielding (i.e.deshielding) and chemical shift increases Compound Chemical shift CH3I 2.16 CH3Br 2.65 CH3Cl 3.10 CH3F 4.26
  17. Powerpoint Templates Page 17 Magnetic anisotropy of π-systems:-  The word "anisotropic" means "non-uniform". So magnetic anisotropy means that there is a "non-uniform magnetic field".  Electrons in π systems (e.g. aromatics, alkenes, alkynes, carbonyls etc.) interact with the applied field which induces a magnetic field that causes the anisotropy.  It causes both shielding and deshielding of protons.  Example:-Benzene Hydrogen bonding:-  Protons that are involved in hydrogen bonding are typically change the chemical shift values.  The more hydrogen bonding, the more proton is deshielded and chemical shift value is higher.
  18. Powerpoint Templates Page 18 Proton NMR The most common for of NMR is based on the hydrogen-1 (1H), nucleus or proton. It can give information about the structure of any molecule containing hydrogen atoms.
  19. Powerpoint Templates Page 19 1H NMR chemical shift
  20. Powerpoint Templates Page 20
  21. Powerpoint Templates Page 21 Proton NMR spectra of Ethanol:- 1H spectrum of Ethanol:- 3 types of proton CH3,CH2,OH
  22. Powerpoint Templates Page 22 1H NMR spectra of Benzene • Aromatic Hydrogen shows peak in the chemical shift scale 6.5-8.0 ppm. • From the above spectrum Benzene has same type of protons and it shows single peak at 7.26
  23. Powerpoint Templates Page 23 Interpretation of 1HNMR spectra:- Number of signals - Indicates how many "different kinds" of protons are present. Position of signals - Indicates something about (chemicalshift) magnetic (electronic) environment of protons Relative intensity of - Proportional to number of protons present signals Splitting of signals - Indicates the number of nearby nuclei (spin spin coupling) usually protons
  24. Powerpoint Templates Page 24 n+1 rule:-  The multiplicity of signal is calculated by using n+1 rule.  This is one of the rule to predict the splitting of proton signals. This is considered by the nearby hydrogen nuclei. Therefore, n= Number of protons in nearby nuclei  Zero H atom as neighbour n+1=0+1=1(singlet)  One H atom as neighbour n+1=1+1 = 2(doublet)  Two H atom as neighbour n+1=2+1 =3(triplet)
  25. Powerpoint Templates Page 25 Spin-spin coupling (splitting) The interaction between the spins of neighbouring nuclei in a molecule may cause the splitting of NMR spectrum.This is known as spin-spin coupling or splitting. The splitting pattern is related to the number of equivalent H-atom at the nearby nuclei. Ethyl acetate
  26. Powerpoint Templates Page 26 Rules for spin-spin coupling:- * Chemically equivalent protons do not show spin-spin coupling. * Only nonequivalent protons couple. * Protons on adjacent carbons normally will couple. * Protons separated by four or more bonds will not couple.
  27. Powerpoint Templates Page 27 Coupling Constant • The distance between the peaks in a given multiplet is a measure of the splitting effect known as coupling constant. • It is denoted by symbol J, expressed in Hz. • Coupling constants are a measure of the effectiveness of spin-spin coupling and very useful in 1H NMR of complex structures.
  28. Powerpoint Templates Page 28 2D NMR Basics of 2D NMR Experiment:- Basis: Interaction of nuclear spins (1H with 1H, 1H with 13C, etc.) plotted in two dimensions • Normal spectra( 1D NMR) are plots of intensity Vs frequency. • In 2D NMR intensity is plotted as function of two frequencies called f1 & f2 • In general, 2D’s can be divided into two types, Homonuclear Heteronuclear • Each type can provide either through-bond (COSY-type) or through space (NOESY-type) coupling information
  29. Powerpoint Templates Page 29 2D-Correlation spectra
  30. Powerpoint Templates Page 30 2-D NMR –Signal is recorded as a function of two time variables, t1 and t2. •Rf pulses are generally applied during the preparation and mixing periods.
  31. Powerpoint Templates Page 31 Applications of 2D NMR:-  Simplifies analysis of more complex or ambiguous cases such as proteins.  Obtain structural information not accessible by one-dimensional NMR methods.
  32. Powerpoint Templates Page 32 Techniques include: • Correlation Spectroscopy (COSY) • Heteronuclear Correlation Spectroscopy (HETCOR) • Heteronuclear Multiple-Quantum Coherence (HMQC) • Nuclear Overhauser Effect Spectroscopy (NOESY) • Incredible Natural Abundance Double Quantum Transfer Experiment (INADEQUATE) • Many others
  33. Routine 2-D NMR Experiments:- Powerpoint Templates Page 33 COrrelationSpectroscopY(COSY) –Scalar Coupling »Identifies all coupled spins systems. Nuclear OverhauserEffect SpectroscopY(NOESY) –Dipolar Coupling »Identifies neighboring spin systems (≤5 Å) »Identifies chemical exchange. Heteronuclear Multiple/Single Quantum Correlation (HMQC/HSQC) –Scalar Coupling »Identifies coupling between heteronuclei(C-H, N-H)
  34. COSY: Homonuclear correlated spectroscopy. Correlation Powerpoint Templates Page 34 between protons that are coupled to each other TOCSY: Total Correlation Spectroscopy- Uses a spin-lock for coherence transfer. During the spin-lock all protons of a coupled system become "strongly coupled," leading to cross peaks between all resonances of a coupled system. HETCOR: Heteronuclear correlation, usually between 1H and 13C resonances mediated by JC-H.
  35. NOESY, ROESY: Proton-proton correlation mediated by dipolar coupling (NOE effect). Correlation between protons that are close in space. This is the single most powerful NMR technique for determining the 3- dimensional structure of molecules from conformations of small molecules to the 3-dimensional structure of small proteins. HOESY: Heteronuclear Overhauser Effect Spectroscopy. Correlation between protons and heteronuclei that are close in space. Powerpoint Templates Page 35
  36. Powerpoint Templates Page 36 COSY experiment •Correlation Spectroscopy •Commonly used for regiochemical assignment •Cross-peaks appear if spin coupling is present •Protons that are separated by 2 or 3 bonds are usually detected
  37. Powerpoint Templates Page 37 Nuclear Overhauser Effect • NOE Caused by dipolar coupling between nuclei. • The local field at one nucleus is affected by the presence of another nucleus. The result is a mutual modulation of resonance frequencies. N S N S
  38. Powerpoint Templates Page 38 Nuclear Overhauser Effect The intensity of the interaction is a function of the distance between the nuclei according to the following equation. I = A (1/r6) I - intensity A - scaling constant r - internuclear distance r1,2 1H 1H 1 2 r1,3 r2,3 1H 3 Arrows denote cross relaxation pathways r1,2 - distance between protons 1 and 2 r2,3 - distance between protons 2 and 3 The NOE provides a link between an experimentally measurable quantity, I, and internuclear distance. NOE is only observed up to 5 Å.
  39. Powerpoint Templates Page 39
  40. GENERAL APPLICATIONS OF Powerpoint Templates Page 40 NMR SPECTROSCOPY  NMR is used in biology to study the Biofluids, Cells, Per fused organs and biomacromolecules such as Nucleic acids(DNA, RNA), carbohydrates Proteins and peptides. And also Labeling studies in biochemistry.  NMR is used in physics and physical chemistry to study High pressure Diffusion ,Liquid crystals ,liquid Crystal solutions , Membranes, Rigid solids.  NMR is used in food science.
  41. Contd…  NMR is used in pharmaceutical science to study Pharmaceuticals and Drug metabolism.  NMR is used in chemistry to ; • Determine the Enantiomeric purity. • Elucidate Chemical structure of organic and Powerpoint Templates Page 41 NMR SPECTROSCOPY ECTROSCOPY SCOPY inorganic compounds. • Macromolecules –ligand interaction.
  42. Powerpoint Templates Page 42 1H-NMR SPECTROSCOPY applications 1H widely used for structure elucidation. Inorganic solids- In organic compounds are investigated by solid state 1H-NMR.eg CaSO4⋅H2O. Organic solids- Solid-state 1H NMR constitutes a powerful approach to investigate the hydrogen-bonding and ionization states of small organic compounds. • Direct correlation with hydrogen-bonding lengths could be demonstrated, e.g. for amino acid carboxyl groups.
  43. Polymers and rubbers- Examine hydrogen bonding and acidity. Peptides and proteins Clinical and scientific research In vivo NMR studies- • concerned with 1H NMR Powerpoint Templates Page 43 spectroscopy of human brain. • Many studies are concerned with altered levels of metabolites in various brain diseases. • To determine the spatial distribution of any given metabolite detected spectroscopically IS (image selected in vivo spectroscopy).
  44. Application of NMR in medicine MRI is specialist application of multi dimensional Powerpoint Templates Page 44 Fourier transformation NMR  Anatomical imaging.  Measuring physiological functions  Flow measurements and angiography.  Tissue perfusion studies.  Tumors
  45. Powerpoint Templates Page 45 References:-  Organic spectroscopy by William Kemp  Instrumental methods of chemical analysis by Chatwal  Instrumental methods of analysis by Willard  Wikipedia.org
  46. Powerpoint Templates Page 46
Advertisement