Summary and Comparisons with
the Global Results
The Worldcom
Confidence
Index
2019 Asia Report
THIS DOCUMENT SHOULD BE READ AS A COMPANION
DOCUMENT TO THE GLOBAL STUDY REPORT.
IT DRAWS OUT DIFFERENCES TO THE GLOBAL RESULTS
AND HIGHLIGHTS KEY TRENDS FROM THE ASIAN
PERSPECTIVE.
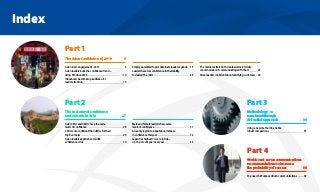
Index
The media matters but Asian leaders are mildly
concerned about communicating with them	 25
Asian leaders confident about satisfying customers	 26
Part 1
The Asian Confidence 6 | 2019	 5
Asian topic engagement - 2019	 6
Asian leaders’buck the confidence trend –
rising 5% since 2018	 10
Influencers become top audience for
leader attention 	 13
Employee-related topics dominate leaders’agenda	 15
Leaders have low confidence in their ability
to deal with a crisis	 24
Part 3
Methodology – a
new, breakthrough
AI-fuelled approach	 34
Using a new method to enable
robust comparisons	 35
Part 4
Worldcom’s seven communications
recommendations to increase
the probability of success	 38
The need for Purpose driven communications	 39
Part 2
The anatomy of confidence
and concern in Asia	 27
Asia’s CEOs and CMOs have the same
levels of confidence 	 28
CEOs more confident than CMOs for their
top five topics 	 29
Asian leaders experience mid life
confidence crisis 	 30
Male and female leaders share same
levels of confidence	 31
Asia only region to experience increase
in confidence this year	 32
Japan has highest CI score in Asia –
up 74 per cent year over year	 33
Artificial intelligence provides unrivalled view of trending
topics and leaders’confidence and concern in addressing them
In 2018 we created the first Worldcom Confidence Index – an
invaluable benchmark for the confidence levels of business leaders.
The report captured feedback from 540 business leaders in seven of the
world’s largest economies and across three regions – Asia, Europe and
America.
In this year’s report, we adopted a new and breakthrough way of
understanding the issues that concern leaders. We commissioned
Advanced Symbolics Inc. (ASI), a research company that uses artificial
intelligence (AI) to create a fully representative understanding of the
issues that concern leaders – and their confidence levels in addressing
them. By using ASI’s AI tool, and patented methodology, we have
produced a truly global perspective of 58,374 business leaders from
seven regions and 15 countries, on the issues of the moment and where
they rank in terms of leadership attention. We’ve also calculated the
confidence levels for every topic and audience and identify how these
change around the world. This global perspective was captured in the
2019 Global Worldcom Confidence Index.
Tom Van Blarcom,
Chair of Worldcom Asia
THE WORLDCOM CONFIDENCE INDEX 2019 | ASIA REPORT
3
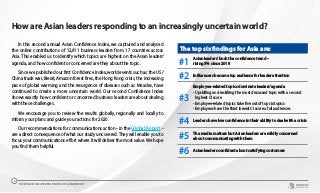
The top six findings for Asia are:
#1 Asian leaders’buck the confidence trend –
rising 5% since 2018
#2 Influencers become top audience for leader attention
#3
Employee-related topics dominate leaders’agenda
• Upskilling and reskilling the most discussed topic with a second
highest CI score
• Employee-related topics take five out of top six topics
• Employees have the third lowest CI score of all audiences
#4 Leaders have low confidence in their ability to deal with a crisis
#5 The media matters but Asian leaders are mildly concerned
about communicating with them
#6 Asian leaders confident about satisfying customers
How are Asian leaders responding to an increasingly uncertain world?
In this second annual Asian Confidence Index, we captured and analysed
the online contributions of 12,811 business leaders from 17 countries across
Asia. This enabled us to identify which topics are highest on the Asian leaders’
agenda, and how confident or concerned are they about the topic.
Since we published our first Confidence Index, world events such as: the US/
China trade war, Brexit, Amazon forest fires, the Hong Kong crisis, the increasing
pace of global warming and the resurgence of diseases such as Measles, have
continued to create a more uncertain world. Our second Confidence Index
shows exactly how confident or concerned business leaders are about dealing
with these challenges.
We encourage you to review the results globally, regionally and locally to
inform your plans and guide your actions for 2020.
Our recommendations for communications action - in the Global Report -
are a direct consequence of what our study uncovered. They will enable you to
focus your communications effort where it will deliver the most value. We hope
you find them helpful.
THE WORLDCOM CONFIDENCE INDEX 2019 | ASIA REPORT
4
PART1
The ASIAN
Confidence 6 | 2019
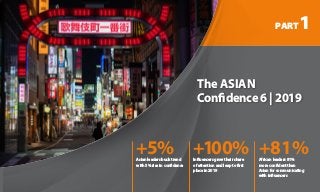
+5%Asian leaders buck trend
with 5% rise in confidence
+100%Influencers grow their share
of attention and leap to first
place in 2019
+81%African leaders 81%
more confident than
Asian for communicating
with influencers
Asian topic engagement - 2019
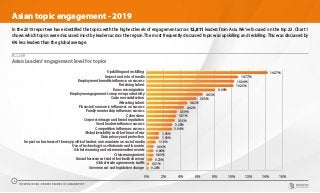
In the 2019 report we have identified the topics with the highest levels of engagement across 12,811 leaders from Asia. We’ve focused on the top 23. Chart 1
shows which topics were discussed most by leaders across the region. The most frequently discussed topic was upskilling and reskilling. This was discussed by
6% less leaders than the global average.
CHART 1
0% 2% 4% 6% 8% 10% 12% 14% 16%
Government and legislative change
Global trade agreements tariffs
Sexual harassment and other bad behaviour
Crisis management
Global warming and extreme weather events
Use of technology to collaborate and innovate
Impact on business of the way political leaders communicate on social media
Data privacy and protection
Global instability and the threat of war
Competition influences success
Good leaders influence success
Corporate image and brand reputation
Cybercrime
Family mentorship influences success
Financial /economic influences on success
Attracting talent
Customer satisfaction
Employee engagement to improve productivity
Economic migration
Retaining talent
Employment benefits influence on success
Impact and role of media
Upskilling and reskilling 14.27%
10.77%
10.34%
10.25%
8.09%
6.63%
5.93%
4.82%
4.42%
3.59%
3.51%
3.35%
3.05%
3.04%
1.50%
1.50%
1.10%
0.84%
0.83%
0.72%
0.86%
0.31%
0.28%
Asian Leaders’engagement level for topics
THE WORLDCOM CONFIDENCE INDEX 2019 | ASIA REPORT
6
0 5 10 15 20 25
Crisis management
Impact on business of the way political leaders communicate on social media
Global instability and the threat of war
Government and legislative change
Use of technology to collaborate and innovate
Global trade agreements tariffs
Financial /economic influences on success
Sexual harassment and other bad behaviour
Impact and role of media
Good leaders influence success
Family mentorship influences success
Employment benefits influence on success
Corporate image and brand reputation
Global CI average
Global warming and extreme weather events
Competition influences success
Economic migration
Employee engagement to improve productivity
Data privacy and protection
Attracting talent
Cybercrime
Customer satisfaction
Upskilling and reskilling
Retaining talent 24.36
23.66
22.61
22.19
22.07
21.77
21.52
20.91
20.66
20.14
19.92
19.79
19.78
19.62
19.25
19.21
18.67
18.29
18.29
18.05
18.53
18.02
17.86
17.71
2019 Asian Confidence Index by topics
CHART 2
Confidence by topics
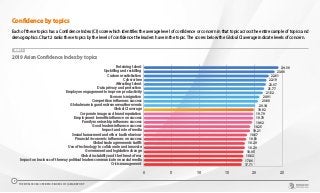
Each of these topics has a Confidence Index (CI) score which identifies the average level of confidence or concern in that topic across the entire sample of topics and
demographics. Chart 2 ranks these topics by the level of confidence the leaders have in the topic. The scores below the Global CI average indicate levels of concern.
THE WORLDCOM CONFIDENCE INDEX 2019 | ASIA REPORT
7
Leaders’engagement level for audiences – Asia v Global
CHART 3
0% 5% 10% 15% 20% 25% 30%
Suppliers need the most attention
Shareholders need the most attention
Government and legislators need the most attention
Employees need the most attention
Customers need the most attention
Influencers need the most attention
26.35%
23.35%
18.72%
13.90%
13.59%
4.09%
26.34%
23.02%
18.34%
14.98%
13.92%
3.40%
ASIA GLOBAL
Engagement by audience
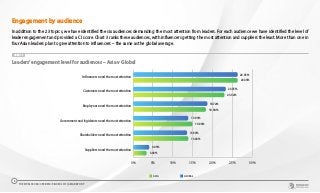
In addition to the 23 topics, we have identified the six audiences demanding the most attention from leaders. For each audience we have identified the level of
leader engagement and provided a CI score. Chart 3 ranks these audiences, with influencers getting the most attention and suppliers the least. More than one in
four Asian leaders plan to give attention to influencers – the same as the global average.
THE WORLDCOM CONFIDENCE INDEX 2019 | ASIA REPORT
8
0 5 10 15 20 25
Government and legislators need the most attention
Shareholders need the most attention
Employees need the most attention
Global CI average
Influencers need the most attention
Suppliers need the most attention
Customers need the most attention
19.71
19.21
17.91
17.75
19.88
18.34
22.24
20.54
19.94
19.92
19.88
19.59
16.13
ASIA GLOBAL
2019 Worldcom Confidence Index by audiences – Asia v Global
CHART 4
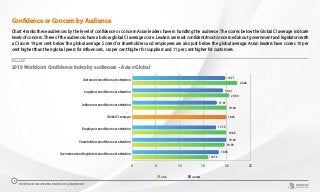
Confidence or Concern by Audience
Chart 4 ranks these audiences by the level of confidence or concern Asian leaders have in handling the audience. The scores below the Global CI average indicate
levels of concern. Three of the audiences have a below global CI average score. Leaders are least confident/most concerned about government and legislators with
a CI score 19 per cent below the global average. Scores for shareholders and employees are also just below the global average. Asian leaders have scores 10 per
cent higher than their global peers for influencers, six per cent higher for suppliers and 11 per cent higher for customers.
THE WORLDCOM CONFIDENCE INDEX 2019 | ASIA REPORT
9
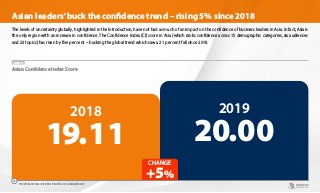
The levels of uncertainty globally, highlighted in the Introduction, have not had as much of an impact on the confidence of business leaders in Asia. In fact, Asia is
the only region with an increase in confidence. The Confidence Index (CI) score in Asia (which ranks confidence across 15 demographic categories, six audiences
and 23 topics) has risen by five per cent – bucking the global trend which saw a 21 per cent fall since 2018.
2018
19.11
2019
20.00
+5%
CHANGE
CHART 5
Asian Confidence Index Score
Asian leaders’buck the confidence trend – rising 5% since 2018
THE WORLDCOM CONFIDENCE INDEX 2019 | ASIA REPORT
10
0 5 10 15 20 25 30 35 40
Latin America and Caribbean
South America
North America
Africa
Average
Asia
Europe
Australasia 20.00
20.00
20.00
19.92
19.90
19.68
19.67
19.10
34.90
25.31
19.11
21.89
CONFIDENCE 2018 CONFIDENCE 2019 CONFIDENCE 2018 CONFIDENCE 2019
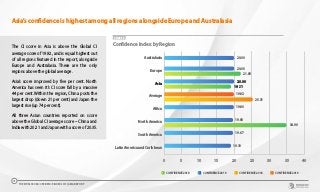
Confidence Index by Region
CHART 6
Asia’s confidence is highest among all regions alongside Europe and Australasia
The CI score in Asia is above the Global CI
average score of 19.92, and is equal highest out
of all regions featured in the report, alongside
Europe and Australasia. These are the only
regions above the global average.
Asia’s score improved by five per cent. North
America has seen it’s CI score fall by a massive
44 per cent. Within the region, China posts the
largest drop (down 21 per cent) and Japan the
largest rise (up 74 per cent).
All three Asian countries reported on score
above the Global CI average score – China and
India with 20.21 and Japan with a score of 20.35.
THE WORLDCOM CONFIDENCE INDEX 2019 | ASIA REPORT
11
CHART 7
18 19 20 21 22 23 24 25
Global CI Average
Attracting talent
Cybercrime
Customer satisfaction
Upskilling and reskilling
Retaining talent
21.36
19.55
21.83
20.93
21.31
24.36
23.66
22.61
22.19
22.07
19.92
ASIA GLOBAL
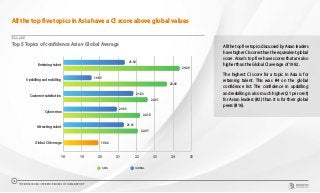
Top 5 Topics of confidence Asia v Global Average
All the top five topics in Asia have a CI score above global values
All the top five topics discussed by Asian leaders
have higher CI scores than the equivalent global
score. Asian’s top five have scores that are also
higher than the Global CI average of 19.92.
The highest CI score for a topic in Asia is for
retaining talent. This was #4 on the global
confidence list. The confidence in upskilling
and reskilling is also much higher (21 per cent)
for Asian leaders (#2) than it is for their global
peers (#16).
THE WORLDCOM CONFIDENCE INDEX 2019 | ASIA REPORT
12
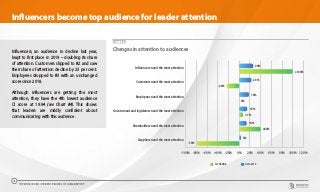
Influencers, an audience in decline last year,
leapt to first place in 2019 – doubling its share
of attention. Customers slipped to #2 and saw
their share of attention decline by 23 per cent.
Employees dropped to #3 with an unchanged
score since 2018.
Although influencers are getting the most
attention, they have the 4th lowest audience
CI score at 19.94 (see Chart #4). This shows
that leaders are mildly confident about
communicating with this audience.
CHART 8
-100% -80% -60% -40% -20% 0% 20% 40% 60% 80% 100% 120%
Suppliers need the most attention
Shareholders need the most attention
Government and legislators need the most attention
Employees need the most attention
Customers need the most attention
Influencers need the most attention
26%
23%
18%
15%
14%
3%
+100%
-23%
0%
+7%
+40%
-79%
% CHANGE ASIA 2019
Changes in attention to audiences
Influencers become top audience for leader attention
THE WORLDCOM CONFIDENCE INDEX 2019 | ASIA REPORT
13
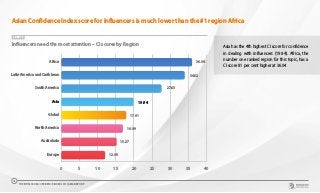
Asian Confidence Index score for influencers is much lower than the #1 region Africa
CHART 9
0 5 10 15 20 25 30 35 40
Europe
Australasia
North America
Global
Asia
South America
Latin America and Caribbean
Africa 36.04
34.02
27.63
19.94
17.91
16.99
15.27
12.09
Influencers need the most attention – CI scores by Region Asia has the 4th highest CI score for confidence
in dealing with influencers (19.94). Africa, the
number one ranked region for this topic, has a
CI score 81 per cent higher at 36.04
THE WORLDCOM CONFIDENCE INDEX 2019 | ASIA REPORT
14
Employee-related topics dominate leaders’agenda
• Upskilling and reskilling the most discussed topic with a second highest CI score
• Employee-related topics take five out of top six topics
• Employees has the third lowest CI score of all audiences
CHART 10
Employee-related topics dominate leader discussions
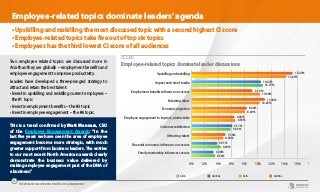
Two employee related topics are discussed more in
Asia than they are globally – employment benefits and
employee engagement to improve productivity.
Leaders have developed a three-pronged strategy to
attract and retain the best talent:
• Invest in upskilling and reskilling current employees –
the #1 topic
• Invest in employment benefits – the #3 topic
• Invest in employee engagement – the #6 topic.
0% 2% 4% 6% 8% 10% 12% 14% 16% 18%
Family mentorship influences success
Financial /economic influences on success
Attracting talent
Customer satisfaction
Employee engagement to improve productivity
Economic migration
Retaining talent
Employment benefits influence on success
Impact and role of media
Upskilling and reskilling 15.23%
10.47%
9.19%
11.06%
8.34%
6.63%
6.17%
5.14%
3.91%
3.34%
14.27%
10.77%
10.34%
10.25%
8.09%
6.48%
4.82%
4.42%
3.59%
5.93%
ASIA GLOBAL ASIA GLOBAL
This is a trend confirmed by Matt Manners, CEO
of the Employee Engagement Awards: “In the
last five years we have seen the area of employee
engagement become more strategic, with much
greater support from business leaders. The entries
to our most recent North American awards clearly
demonstrate the business value delivered by
making employee engagement part of the DNA of
a business.”
THE WORLDCOM CONFIDENCE INDEX 2019 | ASIA REPORT
15
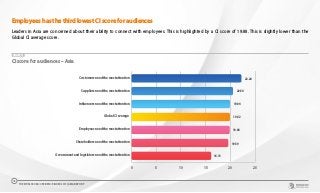
Employees has the third lowest CI score for audiences
Leaders in Asia are concerned about their ability to connect with employees. This is highlighted by a CI score of 19.88. This is slightly lower than the
Global CI average score.
CHART 11
CI score for audiences – Asia
0 5 10 15 20 25
Government and legislators need the most attention
Shareholders need the most attention
Employees need the most attention
Global CI average
Influencers need the most attention
Suppliers need the most attention
Customers need the most attention
20.54
19.94
19.92
19.88
19.59
16.13
22.24
THE WORLDCOM CONFIDENCE INDEX 2019 | ASIA REPORT
16
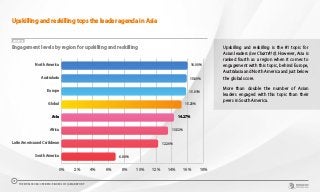
Upskilling and reskilling is the #1 topic for
Asian leaders (see Chart #10). However, Asia is
ranked fourth as a region when it comes to
engagement with this topic, behind Europe,
Australasia and North America and just below
the global score.
More than double the number of Asian
leaders engaged with this topic than their
peers in South America.
CHART 12
Engagement levels by region for upskilling and reskilling
0% 2% 4% 6% 8% 10% 12% 14% 16% 18%
South America
Latin America and Caribbean
Africa
Asia
Global
Europe
Australasia
North America 16.00%
15.89%
15.81%
15.23%
14.27%
13.52%
12.26%
6.88%
Upskilling and reskilling tops the leader agenda in Asia
THE WORLDCOM CONFIDENCE INDEX 2019 | ASIA REPORT
17
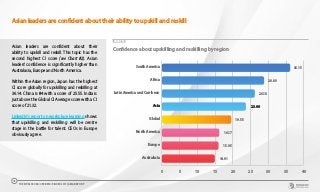
Asian leaders are confident about their ability to upskill and reskill
CHART 13
Confidence about upskilling and reskilling by region
0 5 10 15 20 25 30 35 40
Australasia
Europe
North America
Global
Asia
Latin America and Carribean
Africa
South America 36.15
28.80
26.18
23.66
19.55
16.17
15.95
14.91
Asian leaders are confident about their
ability to upskill and reskill. This topic has the
second highest CI score (see Chart #2). Asian
leaders’ confidence is significantly higher than
Australasia, Europe and North America.
Within the Asian region, Japan has the highest
CI score globally for upskilling and reskilling at
36.14. China is #4 with a score of 25.55. India is
just above the Global CI Average score with a CI
score of 21.32.
LinkedIn’s report on workplace learning shows
that upskilling and reskilling will be centre
stage in the battle for talent. CEOs in Europe
obviously agree.
THE WORLDCOM CONFIDENCE INDEX 2019 | ASIA REPORT
18
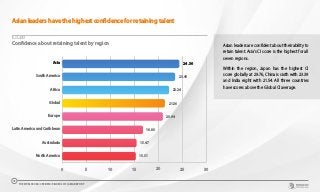
Asian leaders have the highest confidence for retaining talent
Asian leaders are confident about their ability to
retain talent. Asia’s CI score is the highest for all
seven regions.
Within the region, Japan has the highest CI
score globally at 29.76, China is sixth with 23.39
and India eight with 21.54. All three countries
have scores above the Global CI average.
CHART 14
Confidence about retaining talent by region
0 5 10 15 20 25 30
North America
Australasia
Latin America and Caribbean
Europe
Global
Africa
South America
Asia 24.36
23.49
22.24
21.36
20.94
16.80
15.47
15.31
THE WORLDCOM CONFIDENCE INDEX 2019 | ASIA REPORT
19
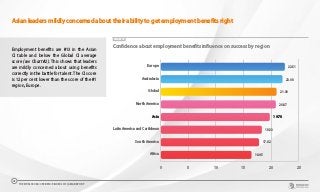
Asian leaders mildly concerned about their ability to get employment benefits right
Employment benefits are #13 in the Asian
CI table and below the Global CI average
score (see Chart #2). This shows that leaders
are mildly concerned about using benefits
correctly in the battle for talent. The CI score
is 12 per cent lower than the score of the #1
region, Europe.
CHART 15
Confidence about employment benefits influence on success by region
0 5 10 15 20 25
Africa
South America
Latin America and Caribbean
Asia
North America
Global
Australasia
Europe 22.51
22.08
21.00
20.87
19.78
18.33
17.82
16.45
THE WORLDCOM CONFIDENCE INDEX 2019 | ASIA REPORT
20
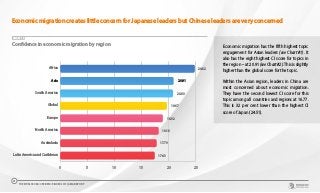
Economic migration creates little concern for Japanese leaders but Chinese leaders are very concerned
CHART 16
Confidence in economic migration by region
0 5 10 15 20 25
Latin America and Caribbean
Australasia
North America
Europe
Global
South America
Asia
Africa 24.82
20.91
20.80
19.67
18.92
18.16
17.79
17.43
Economic migration has the fifth highest topic
engagement for Asian leaders (see Chart #1). It
also has the eight highest CI score for topics in
the region – at 20.91 (see Chart #2).This is slightly
higher than the global score for the topic.
Within the Asian region, leaders in China are
most concerned about economic migration.
They have the second lowest CI score for this
topic among all countries and regions at 16.77.
This is 32 per cent lower than the highest CI
score of Japan (24.51).
THE WORLDCOM CONFIDENCE INDEX 2019 | ASIA REPORT
21
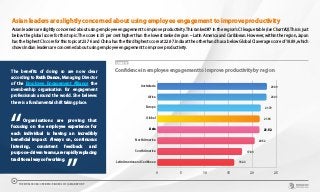
Asian leaders are slightly concerned about using employee engagement to improve productivity
Asian leaders are slightly concerned about using employee engagement to improve productivity. This ranked #7 in the region’s CI league table (see Chart #2). This is just
below the global score for this topic. The score is 35 per cent higher than the lowest ranked region – Latin America and Caribbean. However, within the region, Japan
has the highest CI score for this topic at 23.76 and China has the third highest score at 22.97. India at the other hand has a below Global CI average score of 18.89, which
shows Indian leaders are concerned about using employee engagement to improve productivity.
CHART 17
Confidence in employee engagement to improve productivity by region
0 5 10 15 20 25
Latin America and Caribbean
South America
North America
Asia
Global
Europe
Africa
Australasia 23.09
23.01
21.79
21.56
21.52
20.52
17.86
16.22
The benefits of doing so are now clear
according to Ruth Dance, Managing Director
of the Employee Engagement Alliance the
membership organisation for engagement
professionals around the world. She believes
there is a fundamental shift taking place.
	 Organisations are proving that
focusing on the employee experience for
each individual is having an incredibly
beneficial impact. Always on, continuous
listening, consistent feedback and
purpose-driven teams, are rapidly replacing
traditional ways of working.
THE WORLDCOM CONFIDENCE INDEX 2019 | ASIA REPORT
22
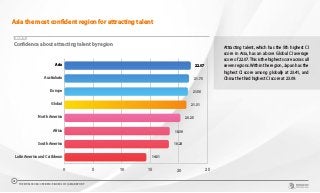
Asia the most confident region for attracting talent
Attracting talent, which has the 5th highest CI
score in Asia, has an above Global CI average
score of 22.07.This is the highest score across all
seven regions. Within the region, Japan has the
highest CI score among globally at 23.41, and
China the third highest CI score at 23.09.
CHART 18
Confidence about attracting talent by region
0 5 10 15 20 25
Latin America and Caribbean
South America
Africa
North America
Global
Europe
Australasia
Asia 22.07
21.75
21.56
21.31
20.25
18.39
18.24
14.31
THE WORLDCOM CONFIDENCE INDEX 2019 | ASIA REPORT
23
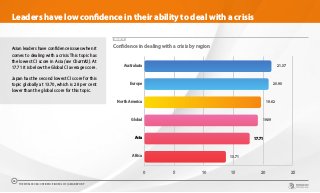
Asian leaders have confidence issues when it
comes to dealing with a crisis. This topic has
the lowest CI score in Asia (see Chart #2). At
17.71 it is below the Global CI average score.
Japan has the second lowest CI score for this
topic globally at 13.70, which is 28 per cent
lower than the global score for this topic.
CHART 19
Confidence in dealing with a crisis by region
0 5 10 15 20 25
Africa
Asia
Global
North America
Europe
Australasia 21.37
20.90
19.62
19.09
17.71
13.71
Leaders have low confidence in their ability to deal with a crisis
THE WORLDCOM CONFIDENCE INDEX 2019 | ASIA REPORT
24
0 5 10 15 20 25
South America
Latin America and Caribbean
Europe
Australasia
Global
Asia
North America
Africa 23.52
20.00
19.21
18.83
18.48
18.23
16.36
15.30
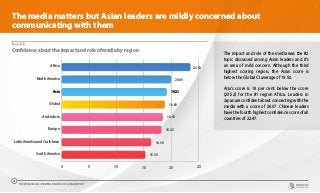
The impact and role of the media was the #2
topic discussed among Asian leaders and it’s
an area of mild concern. Although the third
highest scoring region, the Asian score is
below the Global CI average of 19.92.
Asia’s score is 18 per cent below the score
(23.52) for the #1 region Africa. Leaders in
Japan are confident about connecting with the
media with a score of 26.07. Chinese leaders
have the fourth highest confidence score of all
countries of 22.47.
CHART 20
Confidence about the impact and role of media by region
The media matters but Asian leaders are mildly concerned about
communicating with them
THE WORLDCOM CONFIDENCE INDEX 2019 | ASIA REPORT
25
Asian leaders confident about satisfying customers
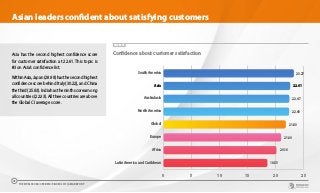
CHART 21
Confidence about customer satisfactionAsia has the second highest confidence score
for customer satisfaction at 22.61. This topic is
#3 on Asia’s confidence list.
WithinAsia,Japan(28.98)hasthesecondhighest
confidence score behind Italy (30.22), and China
thethird(25.83).Indiahastheninthscoreamong
all countries (22.33). All thee countries are above
the Global CI average score.
0 5 10 15 20 25
Latin America and Caribbean
Africa
Europe
Global
North America
Australasia
Asia
South America 23.27
22.61
22.47
22.43
21.83
21.00
20.16
18.55
THE WORLDCOM CONFIDENCE INDEX 2019 | ASIA REPORT
26
PART 2
The anatomy of
confidence and
concern in Asia
+16%CEOs more confident
than CMOs about
retaining talent
Zero difference
in confidence
between male
and female
leaders
Leaders in
Generation X
least confident
in Asia
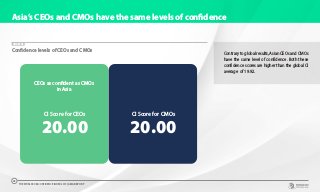
Asia’s CEOs and CMOs have the same levels of confidence
Contrary to global results, Asian CEOs and CMOs
have the same level of confidence. Both these
confidence scores are higher than the global CI
average of 19.92.
CHART 22
Confidence levels of CEOs and CMOs
CEOs as confident as CMOs
in Asia
20.00
CI Score for CEOs
20.00
CI Score for CMOs
THE WORLDCOM CONFIDENCE INDEX 2019 | ASIA REPORT
28
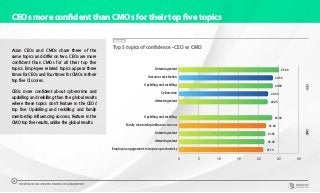
CEOs more confident than CMOs for their top five topics
Asian CEOs and CMOs share three of the
same topics and differ on two. CEOs are more
confident than CMOs for all their top five
topics. Employee related topics appear three
times for CEOs and four times for CMOs in their
top five CI scores.
CEOs more confident about cybercrime and
upskilling and reskilling than the global results
where these topics don’t feature in the CEOs’
top five. Upskilling and reskilling and family
mentorship influencing success, feature in the
CMO top five results, unlike the global results.
CHART 23
Top 5 topics of confidence - CEO vs CMO
0 5 10 15 20 25 30
Employee engagement to improve productivity
Attracting talent
Retaining talent
Family mentorship influences success
Upskilling and reskilling
Attracting talent
Cybercrime
Upskilling and reskilling
Customer satisfaction
Retaining talent 25.09
23.56
23.54
22.34
22.25
23.38
21.84
21.65
21.43
21.13
CEOCMO
THE WORLDCOM CONFIDENCE INDEX 2019 | ASIA REPORT
29
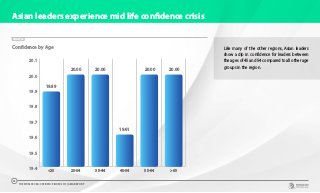
Asian leaders experience mid life confidence crisis
Like many of the other regions, Asian leaders
show a dip in confidence for leaders between
the ages of 45 and 54 compared to all other age
groups in the region.
CHART 24
19.4
19.5
19.6
19.7
19.8
19.9
20.0
20.1
6555-6445-5435-4425-3425
19.89
20.00 20.00 20.00 20.00
19.61
Confidence by Age
THE WORLDCOM CONFIDENCE INDEX 2019 | ASIA REPORT
30
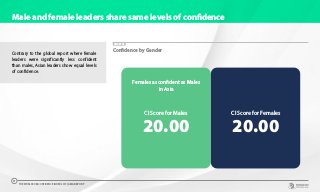
Male and female leaders share same levels of confidence
Contrary to the global report where female
leaders were significantly less confident
than males, Asian leaders show equal levels
of confidence.
CHART 25
Confidence by Gender
Females as confident as Males
in Asia
20.00
CI Score for Males
20.00
CI Score for Females
THE WORLDCOM CONFIDENCE INDEX 2019 | ASIA REPORT
31
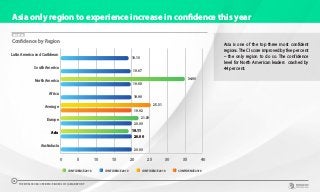
Asia only region to experience increase in confidence this year
Asia is one of the top three most confident
regions. The CI score improved by five per cent
– the only region to do so. The confidence
level for North American leaders crashed by
44 per cent.
CHART 26
Confidence by Region
0 5 10 15 20 25 30 35 40
Australasia
Asia
Europe
Average
Africa
North America
South America
Latin America and Caribbean
25.31
21.89
19.11
34.90
19.10
19.67
19.68
19.90
19.92
20.00
20.00
20.00
CONFIDENCE 2018 CONFIDENCE 2019 CONFIDENCE 2018 CONFIDENCE 2019
THE WORLDCOM CONFIDENCE INDEX 2019 | ASIA REPORT
32
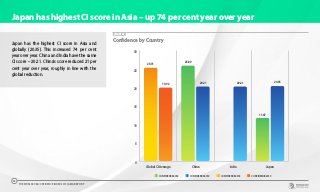
Japan has the highest CI score in Asia and
globally (20.35). This increased 74 per cent
year over year. China and India have the same
CI score – 20.21. China’s score reduced 21 per
cent year over year, roughly in line with the
global reduction.
CHART 27
Confidence by Country
0
5
10
15
20
25
30
JapanIndiaChinaGlobal CI Average
25.89
25.31
20.21 20.21
11.67
19.92 20.35
CONFIDENCE 2018 CONFIDENCE 2019 CONFIDENCE 2018 CONFIDENCE 2019
Japan has highest CI score in Asia – up 74 per cent year over year
THE WORLDCOM CONFIDENCE INDEX 2019 | ASIA REPORT
33
PART 3
Methodology
A new, breakthrough
AI-fuelled approach
Using a new method to enable robust comparisons
In 2018, with the help of two respected independent research firms,
we captured feedback from 540 business leaders in seven of the
world’s largest economies and across the three main regions – Asia,
Europe and America. Their responses created the first Worldcom
Confidence Index.
The insight we gathered was invaluable in creating a benchmark for
the confidence levels of business leaders. However, it was based on
responses to questions we asked rather than on the topics that CEOs
and CMOs were talking about in online channels.
So,wedecidedtoadoptanewandbreakthroughwayofunderstanding
the issues than concerned leaders – and their confidence levels in
addressing them. As a result, we commissioned Advanced Symbolics
Inc. (ASI), a research company that uses artificial intelligence (AI) to
create truly representative understanding of what audiences are saying.
By using ASI’s AI tool, Polly, we were able to capture and analyse the
online contributions, in nine languages, of 58,374 business leaders.
This enables us to identify which topics were highest on the leadership
agenda, and how confident or concerned leaders were about the topic.
35
THE WORLDCOM CONFIDENCE INDEX 2019 | GLOBAL REPORT
Using the total sample size confidence, the expected number of
confident responders was extrapolated. For example, if the sample for
CEOs of very large (1000+) companies in Canada is 253 people, then
the expected confident responders is 53 people (253* 21 per cent).
The actual number of confident respondents is compared against the
expected number and the difference is calculated.To further illustrate
the concept, if 41 CEOs of very large (1000+) companies in Canada
were confidently engaged on retaining talent, the difference is 12 less
people than expected (53 – 41).
The ratio of the difference is calculated and added to the average
confidence. Continuing the above example, 12 less Canadian CEOs
is a decrease of 5 per cent (12/253). Five per cent is subtracted from
the average confidence of 21 per cent giving a confidence for CEOs
of large Canadian companies as 16 per cent. This is the differential
confidence method.
In most cases, the differential confidence is the same as the raw
confidence, which is the ratio of confident responders divided by
the number of people in the sample. In the above example, the raw
confidence is also 16 per cent: 41 Confident responders / 253 CEOs
in the sample.
The differential confidence differs from the raw confidence when
the sample for a segment (i.e. Job title) is small or the confident
engagement is small. In these cases, the small denominator may
exaggerate the change in confidence. The differential confidence
minimizes the impact from small denominators, allowing accurate
comparison between segments no matter the size.
Using the differential confidence method to enable robust comparisons
36
THE WORLDCOM CONFIDENCE INDEX 2019 | ASIA REPORT
Creating a representative sample and
comparative data
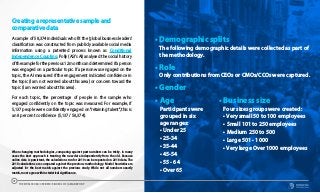
A sample of 58,374 individuals who fit the ‘global business leaders’
classification was constructed from publicly available social media
information using a patented process known as Conditional
Independence Coupling. Polly (ASI’s AI) analysed the social history
ofthesamplefortheprevious12monthsanddeterminedifaperson
was engaged on a particular topic. If a person was engaged on the
topic, the AI measured if the engagement indicated confidence in
the topic (I am not worried about this area) or concern toward the
topic (I am worried about this area).
For each topic, the percentage of people in the sample who
engaged confidently on the topic was measured. For example, if
5,137 people were confidently engaged on“retaining talent”, this is
an 8 per cent confidence (5,137 / 58,374).
When changing methodologies, comparing against past numbers can be tricky. In many
cases the best approach is treating the new data independently from the old. Because
online data is persistent, the calculations run for 2019 can be repeated on 2018 data. The
2018 calculations are compared against the previous methodology. Model heuristics are
adjusted for the best match against the previous study. While not all numbers exactly
match, most agree within statistical significance.
•	Demographic splits
	The following demographic details were collected as part of
the methodology.
•	Role
	 Only contributions from CEOs or CMOs/CCOs were captured.
•	Gender
•	Age
	 Participants were
	 grouped in six
	 age ranges:
	 • Under 25
	 • 25-34
	 • 35-44
	 • 45-54
	 • 55 - 64
	 • Over 65
•	Business size
	 Four sizes groups were created:
	 • Very small 50 to 100 employees
	 • Small 101 to 250 employees
	 • Medium 250 to 500
	 • Large 501 - 1000
	 • Very large Over 1000 employees
THE WORLDCOM CONFIDENCE INDEX 2019 | ASIA REPORT
37
PART 4
Worldcom’s seven
communications
recommendations
to increase the
probability
of success
Based on our findings, we offer the following communications
recommendations to address the issues identified and the
lower levels of confidence.
The study shows that leaders now see Influencers as an
audience they must give attention to, but that employee-
related topics dominate leadership thinking. It shows that
macro scale issues, such as how an organisation manages
the impact of global trade agreements and tariffs, need to be
taken into account. It also shows that leaders are concerned
about their ability to protect their brand in a crisis.
We believe that rigorously planned communications that
always connect to your Purpose will increase your ability to
succeed. As a result, you will see that Purpose runs through all
our recommendations.
The need for Purpose driven communications
39
THE WORLDCOM CONFIDENCE INDEX 2019 | GLOBAL REPORT
I’m not surprised employment benefits
features so highly on the leadership agenda.
If you want to win the war for talent and make
people more productive, you need to get
the total rewards mix right. This increasingly
includes some potentially surprising areas such
as providing employees advice for financial
wellbeing. Our own research shows that you can
undermine all your good work if you pay people
late or make mistakes with their payroll. This has
anincrediblydamagingimpactbothonemployee
productivity and your employer brand.	
John Petter
CEO Zellis
Make your organisation’s Purpose a
magnet for the best talent
As we predicted last year, many organizations have
increased their investment and activity to compete
for the best talent. They are now investing in an array
of areas to improve the employee experience to keep
people loyal. Central to success in this area will be
how committed you are to enabling your people to
develop, and to link this personal development to the
achievement of the organisation’s Purpose.
THE WORLDCOM CONFIDENCE INDEX 2019 | ASIA REPORT
40
Differentiate your employer brand by promoting how
you engage employees to deliver the organisation’s
Purpose. Show how your employee benefits reinforce
your values and behaviours.
In our 2018 report we recommended all organizations involve
employees in defining the values and behaviours. This year we
recommend companies build on that by promoting how they
involve their people in delivering the Purpose for the company.
Setting up a careers channel on YouTube, which highlights the role
and contribution of employees, is a very simple way to do this.
The 2019 Confidence Index shows that getting employment benefits
right is vital to attracting and retaining the best talent. But employee
benefits have evolved well beyond including things like free coffee,
or quirky benefits like duvet days. Consequently, we recommend
companies take a holistic approach to benefits that ties them to the
Purpose and core values.
For example, if your core values say that you want to create a strong
sense of community in the workplace, then the way you provide
coffee needs to help build that sense of community. The Leesman
Index identifies how the workplace drives employee sentiment. Their
report shows that coffee is more important than you may think.
If your values say you want to create a happy and healthy workplace,
then we recommend your review all your internal processes – with
the involvement of your people – to make sure that you don’t do
things that undermine that goal. For example, research by Zellis
shows that making mistakes with payroll or paying it late – can have
a very negative impact on mental wellbeing, financial wellbeing,
employee retention and your employer brand.
1
THE WORLDCOM CONFIDENCE INDEX 2019 | ASIA REPORT
41
Link personal development to
your Purpose so that employees
recognise how their development
adds value to the organisation.
Use this to drive your upskilling
and reskilling decisions.
We recommend that organisations make it very
explicit how personal development contributes
to the achievement of the Purpose. Too often we
have seen a disconnected approach to learning and
development that confuses employees about how
their daily performance adds value. By making these
connections stronger, you will not only reinforce the
reasons why people joined the company but also
create tighter emotional bonds that aid the retention
and attraction of talent.
Support your Employee
Engagement program by
training all managers to operate
by the tenets of the SCARF
neuroscience framework.
The 2019 Confidence Index demonstrates that many
leaders now see employee engagement as part of
the DNA of a business. For engagement programs to
be effective, however, every line manager needs to
understand how to energise and involve each individual
in their team. We recommend training all managers to
operate according to a neuroscience framework called
SCARF. This provides each employee with the five
innate needs their brain has for them to feel a valued
and connected part of the organisation. The impact on
productivity,innovation,businesschange,andemployee
happiness can be transformational.
2 3
THE WORLDCOM CONFIDENCE INDEX 2019 | ASIA REPORT
42
Behave like a confident organisation by making it clear to all audiences
that the organisation has a very clear Purpose and a plan to achieve it.
This includes explaining how the organisation will respond to the macro
level challenges it may face.
Macro level issues such as global trade tariffs, extreme weather events, the threat of war etc., have increasing
influence on success. Employees, customers, shareholders, suppliers and influencers want to understand
how an organisation will respond to those challenges.
If you make the approach you plan to take very clear, it will satisfy one of the key tenets of SCARF – providing
certainty. By explaining what will happen next, you will build confidence and eliminate the anxiety caused
by the unknown. We recommend that the way you describe your Purpose explains how you will operate
effectively in a changing and increasingly challenging world. This level of foresight and forward planning
will demonstrate a high level of confident leadership.
Make sure you actively influence the achievement of your Purpose
The 2019 Index identifies the increasing importance of influencers and the need to make sure that the reputation of your business and brand is not only
protected but grows in power and influence.
4
THE WORLDCOM CONFIDENCE INDEX 2019 | ASIA REPORT
43
Carry out regular risk/threat
assessments and crisis response tests
to protect your brand and reputation.
The same recommendation was in last year’s report.The
2019 Index shows that challenges never go away and
nor do the expectations that leaders will rise to them
to enable the organisation to succeed. However, this
year’s Index shows that leaders are much less confident
about their ability to protect a brand in a crisis. It is
therefore essential that frequent risks assessments are
carried out.
The conclusions of these risk assessments should
then inform updates to crisis and issues policies and
procedures. By demonstrating that an organisation is
prepared for the worst, it will further demonstrate the
leadership’s confidence in the ability to achieve the
organisation’s goals.
Identify who will have the most
influence over the success of your
organisation and build programmes
to develop effective relationships
with them.
Business leaders have identified that influencers need
moreattention.Thedefinitionof ‘influencer’willdepend
on what your organisation is trying to achieve. It could
include traditional influencers such as journalists and
bloggers, as well as other business leaders, activists,
academics, researchers and analysts.
We recommend that you review your Purpose and
the barriers to achieving it. Armed with the clarity
this provides, we recommend you identify and
communicate with the influencers that can help you to
lessen or remove barriers to action, and those that can
help to accelerate your success.
5 6
THE WORLDCOM CONFIDENCE INDEX 2019 | ASIA REPORT
44
THE WORLDCOM CONFIDENCE INDEX 2019 | ASIA REPORT
45
Help your customers to buy-in to your Purpose
and show how it will satisfy their needs.
Our study shows that confidence in the ability to satisfy customers has fallen since 2018. One of the
possible explanations may be that customers are very uncertain about how macro scale changes
may impact an organisation’s ability to meet their needs. For example, the British Government
published its Yellowhammer Factsheet to explain how the Government is preparing to mitigate
the potential reasonable worst case scenario impacts of Brexit, if the UK leaves the EU without a
deal. As a result, millions of UK consumers may now have doubts about the ability of their chosen
supermarket to meet their daily shopping requirements. In this case, it would make sense for UK
supermarkets to make it clear what steps they are taking to protect supplies. This will not only
inspire confidence that the supermarket is prepared to meet the challenge, but also show that it
cares about meeting consumer needs.
We recommend that every organisation creates communications programmes designed to build
confidence in the ability to meet customer needs. These programmes should use well-publicised
challenges to accentuate the value that is delivered to customers. The old adage,‘out of adversity
comes opportunity’, is a neat summary of how organisations can use responses to challenges as a
smart way to accentuate their difference and give customers more reasons to stay loyal.
7
Useful links
If you would like more information on the topics raised in this Report, you may find the links below helpful.
https://advancedsymbolics.com
https://www.ee-awards.com/blog/
https://www.ee-awards.com/engagement-101/
https://ee-awards.com/content/ebooks/ebook-the-future-of-work-insights-from-global-
engagement-101-influencers/
https://learning.linkedin.com/resources/workplace-learning-report-2018
https://the-eea.com/
https://en.wikipedia.org/wiki/Me_Too_movement
https://www.bloomberg.com/news/articles/2019-09-13/nobody-benefits-from-a-u-s-china-
trade-war-with-no-end-in-sight
https://www.bloomberg.com/news/articles/2019-09-09/the-massive-cost-of-not-adapting-
to-climate-change
https://www.wired.com/story/ios-hacks-apple-response/
https://www.advancedsymbolics.com/wp-content/uploads/2019/06/CIC-Whitepaper.pdf
https://www.zellis.com/blog/research-one-in-five-employees-has-quit-job-over-poor-
payroll-experience/
https://www.leesmanindex.com/research/
http://worldcomgroup.com/scarf-framework
https://brexitfacts.blog.gov.uk/2019/09/12/yellowhammer-factsheet/
https://worldcomgroup.com/resources/confidence-index
https://worldcomgroup.com/resources/confidence-index-regional-country
THE WORLDCOM CONFIDENCE INDEX 2019 | ASIA REPORT
46
Group’s Board
Chair - Roger Hurni
Past Chair - Patrik Schober
Americas Region Chair - Brad Fishman
EMEA Region Chair - Andras Nagy
Treasurer - Errol Chapman
Marketing - Stefan Pollack
Business Development - Crispin Manners
Membership/Recruitment - Stephanie Paul
Partner Engagement - Serge Beckers
Knowledge Sharing/Practice Groups - Angélica Consiglio
Asia Pacific At Large - Tom Van Blarcom
Americas’ Board
Chair - Brad Fishman
Chair Elect - Monty Hagler
Past Chair - Sean Rossall
Treasurer - Leah Mussay
US Recruitment - Scott Willyerd
LATAM Recruitment - Luis Avellanedo Ulloa
Partner Engagement - William Beutler
Meetings - Deb Vilchis
Professional Development - Jessica Phelan
Partnerships - Cory Stewart
At Large - Rhiannon Ruff
Emea’s Board
Chair - Todor Ianev
Past Chair - Andras R. Nagy
Treasurer - Hans Karperien
Business Development - Crispin Manners
Peer Review - Caroline Prince
New Membership - Corinna Voss
New Membership - Bjorn Mogensen
Retention - Serge Beckers
Young Consultants - Andras R. Nagy
Marketing - Frederic Bolhorst
Worldcom’s Board of Directors
47
THE WORLDCOM CONFIDENCE INDEX 2019 | ASIA REPORT
Contact us
If you would to inspire direct action from your
stakeholders in a way that delivers immediate
results and lasting outcomes – or discuss the
contentofthisdocument,oritsrecommendations
- please contact:
Todd Lynch
toddlynch@worldcomgroup.com
Crispin Manners
crispinmanners@worldcomgroup.com
If you would like to receive helpful insights and other white papers and reports,
just sign up by using this LINK
For regular updates and insights, why not follow us on
©2019TheWORLDCOMGroup,Inc.