Understanding Productivity Growth in CBO's Economic Forecast
1.
The NABE Foundation’s
23rdAnnual Economic Measurement Seminar
July 28, 2026
Aaron Betz
Macroeconomic Analysis Division
Understanding Productivity Growth
in CBO’s Economic Forecast
For information about the seminar, see www.nabe.com/ems2026.
2.
1
For more informationabout CBO’s forecasting methods, see Robert Arnold, How CBO Produces Its 10-Year Economic Forecast, Working Paper 2018-02 (Congressional Budget
Office, February 2018), www.cbo.gov/publication/53537.
The forecast is used primarily as an input to CBO’s 10-year federal budget
projections and analyses of legislative proposals.
It is a current-law forecast: It reflects the assumption that current laws governing
taxes and spending generally will not change but that any policy changes
scheduled under current law will take effect as planned.
For example, one tax provision in recently enacted legislation allows for the
deduction of up to $40,400 of state and local taxes in 2026. Under current law, that
amount will fall to $10,000 after 2029. CBO’s current-law forecast incorporates the
economic responses to that scheduled decline beginning in 2030.
Purpose of CBO’s Economic Forecast
3.
2
For information abouthow CBO projects potential output, see Robert Shackleton, Estimating and Projecting Potential Output Using CBO’s Forecasting Growth Model,
Working Paper 2018-03 (Congressional Budget Office, February 2018), www.cbo.gov/publication/53558.
CBO’s approach involves projecting:
▪ Potential output (that is, maximum sustainable gross domestic product, or
GDP), by using a Solow-type growth model, and
▪ Actual output, by using a large-scale macroeconometric model.
The estimate of potential output is based mainly on estimates of:
▪ The potential labor force,
▪ The flow of services from the capital stock, and
▪ Potential total factor productivity (TFP) in the nonfarm business sector.
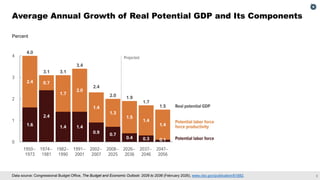
The ratio of real (inflation-adjusted) potential GDP to the potential labor force is
known as potential labor force productivity.
CBO’s Approach to Forecasting
4.
3
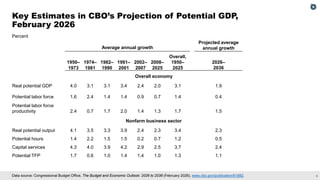
Data source: CongressionalBudget Office, The Budget and Economic Outlook: 2026 to 2036 (February 2026), www.cbo.gov/publication/61882.
Average Annual Growth of Real Potential GDP and Its Components
Percent
5.
4
Data source: CongressionalBudget Office, The Budget and Economic Outlook: 2026 to 2036 (February 2026), www.cbo.gov/publication/61882.
Key Estimates in CBO’s Projection of Potential GDP,
February 2026
Average annual growth
Projected average
annual growth
1950–
1973
1974–
1981
1982–
1990
1991–
2001
2002–
2007
2008–
2025
Overall,
1950–
2025
2026–
2036
Overall economy
Real potential GDP 4.0 3.1 3.1 3.4 2.4 2.0 3.1 1.9
Potential labor force 1.6 2.4 1.4 1.4 0.9 0.7 1.4 0.4
Potential labor force
productivity 2.4 0.7 1.7 2.0 1.4 1.3 1.7 1.5
Nonfarm business sector
Real potential output 4.1 3.5 3.3 3.9 2.4 2.3 3.4 2.3
Potential hours 1.4 2.2 1.5 1.5 0.2 0.7 1.2 0.5
Capital services 4.3 4.0 3.9 4.2 2.9 2.5 3.7 2.4
Potential TFP 1.7 0.6 1.0 1.4 1.4 1.0 1.3 1.1
Percent
6.
5
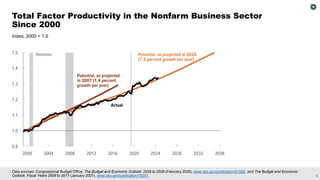
Data sources: CongressionalBudget Office, The Budget and Economic Outlook: 2026 to 2036 (February 2026), www.cbo.gov/publication/61882, and The Budget and Economic
Outlook: Fiscal Years 2008 to 2017 (January 2007), www.cbo.gov/publication/18291.
Total Factor Productivity in the Nonfarm Business Sector
Since 2000
Index, 2000 = 1.0
7.
6
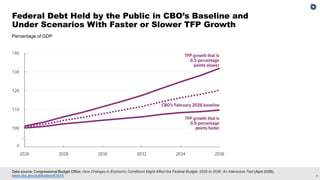
Data source: CongressionalBudget Office, How Changes in Economic Conditions Might Affect the Federal Budget, 2026 to 2036: An Interactive Tool (April 2026),
www.cbo.gov/publication/61914.
Federal Debt Held by the Public in CBO’s Baseline and
Under Scenarios With Faster or Slower TFP Growth
Percentage of GDP
8
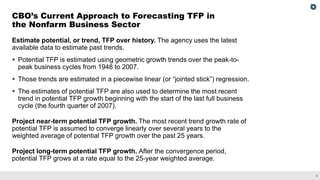
Estimate potential, ortrend, TFP over history. The agency uses the latest
available data to estimate past trends.
▪ Potential TFP is estimated using geometric growth trends over the peak-to-
peak business cycles from 1948 to 2007.
▪ Those trends are estimated in a piecewise linear (or “jointed stick”) regression.
▪ The estimates of potential TFP are also used to determine the most recent
trend in potential TFP growth beginning with the start of the last full business
cycle (the fourth quarter of 2007).
Project near-term potential TFP growth. The most recent trend growth rate of
potential TFP is assumed to converge linearly over several years to the
weighted average of potential TFP growth over the past 25 years.
Project long-term potential TFP growth. After the convergence period,
potential TFP grows at a rate equal to the 25-year weighted average.
CBO’s Current Approach to Forecasting TFP in
the Nonfarm Business Sector
10.
9
The main limitationof the agency’s current method of estimating and projecting
potential TFP is that it is slow to recognize and incorporate changes in underlying
trends. Changes may take several years to be fully reflected in the agency’s forecast.
That issue has become more pronounced in the postpandemic period during which
measured TFP growth has exceeded its average rate of growth from the fourth
quarter of 2007 to the fourth quarter of 2019.
The agency is evaluating various other methods of estimating historical potential TFP
and projecting future TFP growth, including unobserved-components methods,
Bayesian vector autoregressions, and newer approaches, such as those developed
by Ulrich Müller and Mark Watson.
CBO is also exploring incorporating a labor quality measure into its estimate of labor
supply, which would improve estimates of historical TFP by treating changes in the
quality of the workforce as increases in labor input rather than as productivity gains.
Reasons for Revisiting CBO’s TFP Forecasting Model
11.
10
The primary criterionfor evaluating TFP forecasting models is their out-of-sample
forecast performance, as measured by absolute and mean-squared errors.
CBO also places some weight on the stability of models’ estimates of historical
potential TFP. Those estimates should not be overly sensitive to recent
observations.
The agency’s objective is to improve the accuracy of its forecasts of TFP while
avoiding excessive sensitivity to recent observations in its estimates of historical
potential TFP.
Criteria for Evaluating TFP Forecasting Methods
12
Daron Acemoglu, TheSimple Macroeconomics of AI, Working Paper 32487 (National Bureau of Economic Research, May 2024), https://doi.org/10.3386/w32487, Philippe Aghion and
Simon Bunel, AI and Growth: Where Do We Stand? Working Paper (Federal Reserve Bank of San Francisco, June 2024), https://tinyurl.com/mrdkej5z; and Alexander Arnon, The
Projected Impact of Generative AI on Future Productivity Growth (Penn Wharton Budget Model, September 8, 2025), https://tinyurl.com/4yf4cbwy.
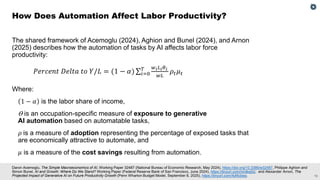
The shared framework of Acemoglu (2024), Aghion and Bunel (2024), and Arnon
(2025) describes how the automation of tasks by AI affects labor force
productivity:
Where:
1 − 𝛼 is the labor share of income,
ϴ is an occupation-specific measure of exposure to generative
AI automation based on automatable tasks,
𝜌 is a measure of adoption representing the percentage of exposed tasks that
are economically attractive to automate, and
𝜇 is a measure of the cost savings resulting from automation.
How Does Automation Affect Labor Productivity?
𝑃𝑒𝑟𝑐𝑒𝑛𝑡 𝐷𝑒𝑙𝑡𝑎 𝑡𝑜 𝑌/𝐿 = (1 − 𝛼) σ𝑖=0
𝑇 𝑤𝑖𝐿𝑖𝜃𝑖
𝑤𝐿
𝜌𝑡𝜇𝑡
14.
13
This task-based frameworktranslates task-level exposure to automation,
AI adoption, and cost savings into year-by-year changes in projected labor force
productivity.
CBO’s projections of those three factors are informed by the literature whenever
possible. Analysts use those projections to calculate the year-by-year effects of
generative AI on labor force productivity.
On the basis of that analysis, the agency raised its forecast of annual TFP growth
by an average of 0.1 percentage point over the next decade.
The agency continues to update its assessment of the effects of generative AI as
new information becomes available.
Calculating the Effect of Task Automation on Productivity
15.
14
CBO’s existing frameworkaccounts for the augmentation and automation of
existing labor tasks by AI but not for other changes that are likely to result from AI
adoption, including:
▪ Increases in capital productivity,
▪ The creation of new AI-enabled tasks for labor, and
▪ The acceleration of innovation.
The agency is developing ways to incorporate those factors into its projections of
productivity growth.
Other Ways AI Affects Productivity