(Obscure) Tools of the Trade   for Tuning Oracle SQLs   [email_address] Tony Jambu Melbourne, Australia
Agenda Tuning Methodology Generating Explain Plan & Tracing TRCSESS DBMS_XPLAN SQL*Plus and Autotrace TRCANLZR - Trace Analyzer SQLT - SQLTXPLAIN  Oracle Active Report Other Tools
Tuning Methodology Where do you start? In development or production? Do you have the volume of data? Proactive or Reactive ? Explain Plans only or database tracing? Explain Plan: Quick but is ‘best guess’ Need to validate changes
Tuning Methodology Tracing: Numerous methods to trace Produces raw data from the execution Not practical for some very large data warehouse SQLs How At own session , other sessions or database level? Numerous ways of turning tracing on
Tracing Various methods Init.ora parameters alter session set event….. eg 10046, 10053, alter [session|system] set sql_trace=true; dbms_session.set_sql_trace(true), dbms_system.set_bool_param_in_session(...), dbms_system.set_sql_trace_in_session(...), dbms_support.start_trace, dbms_support.start_trace_in_session(...), dbms_system.set_ev(…), ***dbms_monitor.* - Oracle 10g and up. Replaces DBMS_SUPPORT oradebug session_event …
Tracing Add name identifier to trace file alter session set  tracefile_identifier ='MyTrc_'; Session Information are useful for end-to-end tracing and can be set with Machine : The name of your machine Module : The application module name Action : What you are doing eg ‘Before Transforming data’  or ‘Aggregating base data’ Service : The service name Client ID : Either logon id or set with  dbms_session.set_identifier(‘A Name’) – Case sensitive
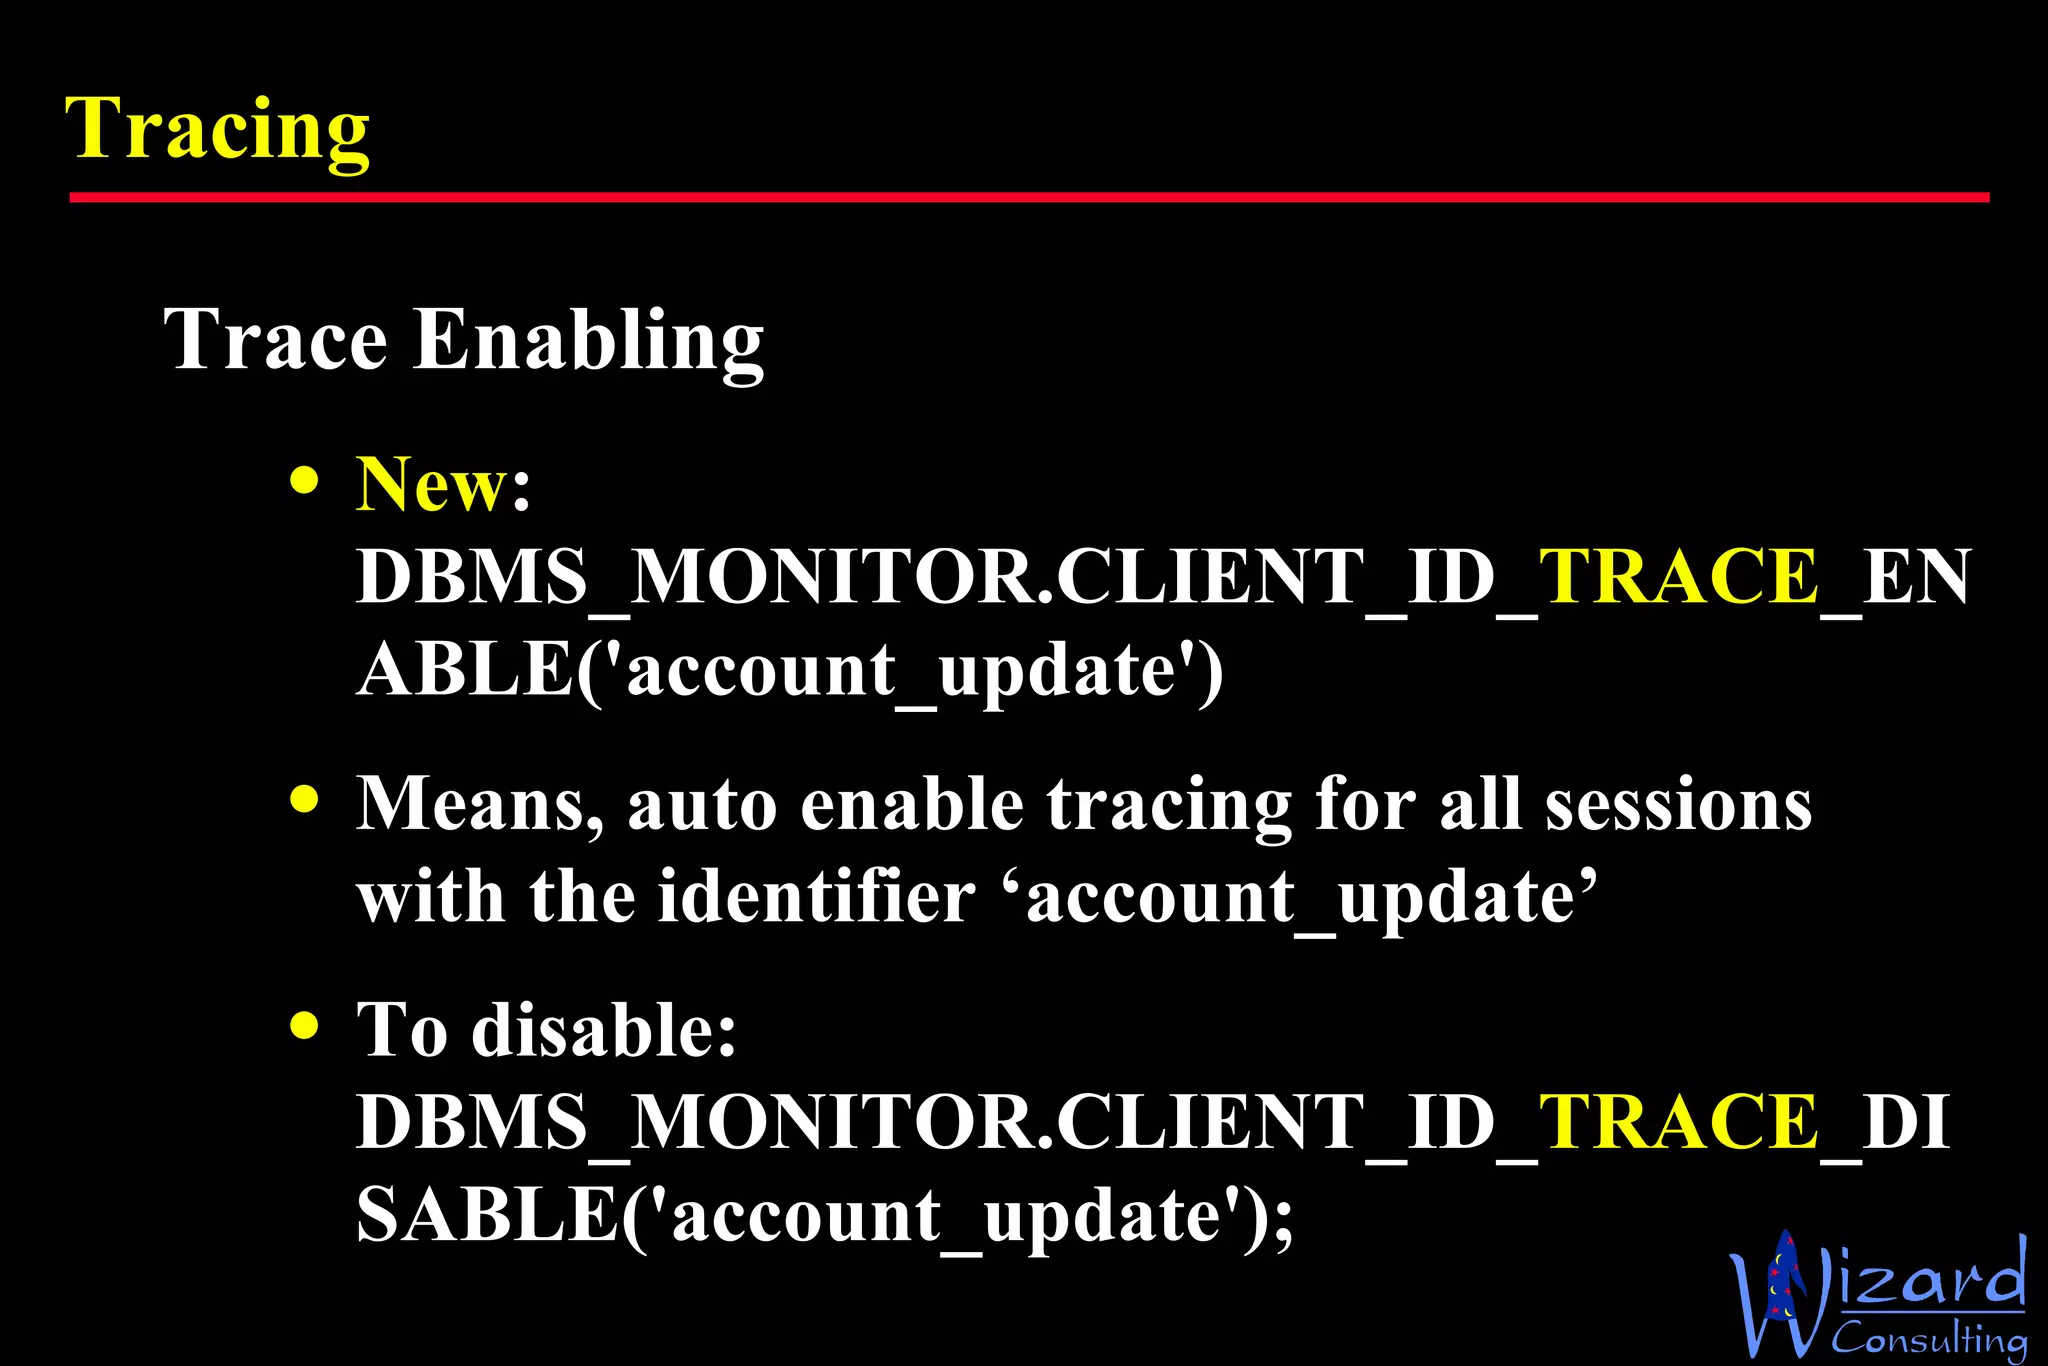
Tracing Trace Enabling New : DBMS_MONITOR.CLIENT_ID_ TRACE _ENABLE('account_update') Means, auto enable tracing for all sessions with the identifier ‘account_update’ To disable: DBMS_MONITOR.CLIENT_ID_ TRACE _DISABLE('account_update');
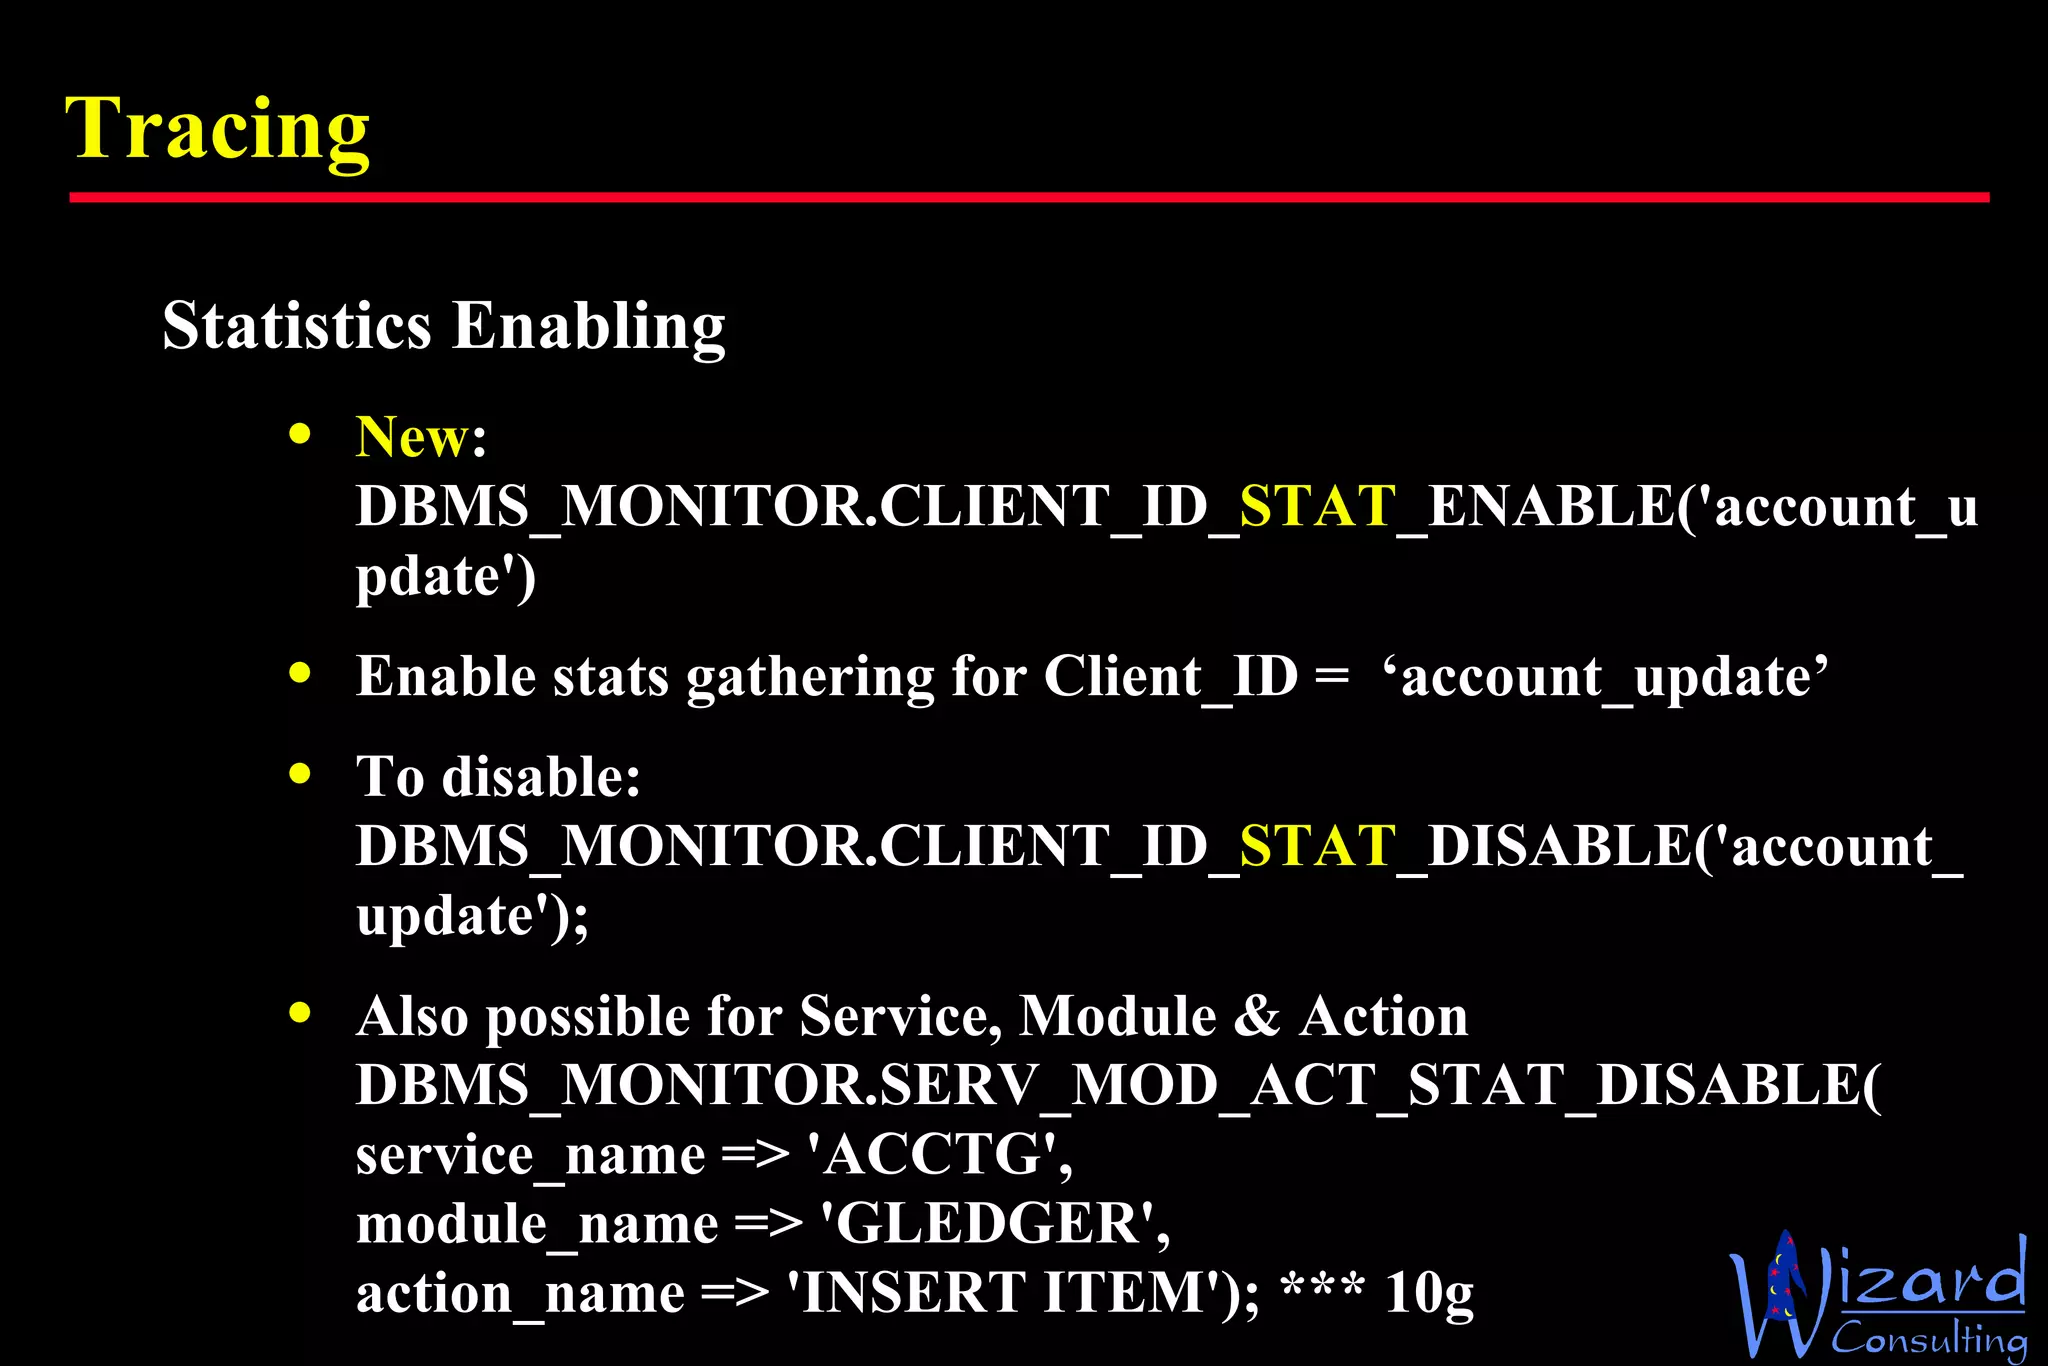
Tracing Statistics Enabling New : DBMS_MONITOR.CLIENT_ID_ STAT _ENABLE('account_update') Enable stats gathering for Client_ID =  ‘account_update’ To disable: DBMS_MONITOR.CLIENT_ID_ STAT _DISABLE('account_update'); Also possible for Service, Module & Action DBMS_MONITOR.SERV_MOD_ACT_STAT_DISABLE( service_name => 'ACCTG',  module_name => 'GLEDGER',  action_name => 'INSERT ITEM'); *** 10g
TRCSESS Tkprof Only works with one file at a time How to handle multiple files like PX files? trcsess Oracle utility that  aggregates/consolidates  and format numerous  trace files into  a single file Trcsess output= output_file_name ] [session= session_id ] [clientid= client_id ] [service= service_name ] [action= action_name ] [module= module_name ] [ trace_files ]
SQL&Plus and AUTOTRACE An SQL*Plus command Usage: set autot[race]  {off | on | trace[only]}  [exp[lain]]  [stat[istics]] ON – returns results Traceonly – Do not return results Exp – Shows execution plan Stat – Gathers execution stats
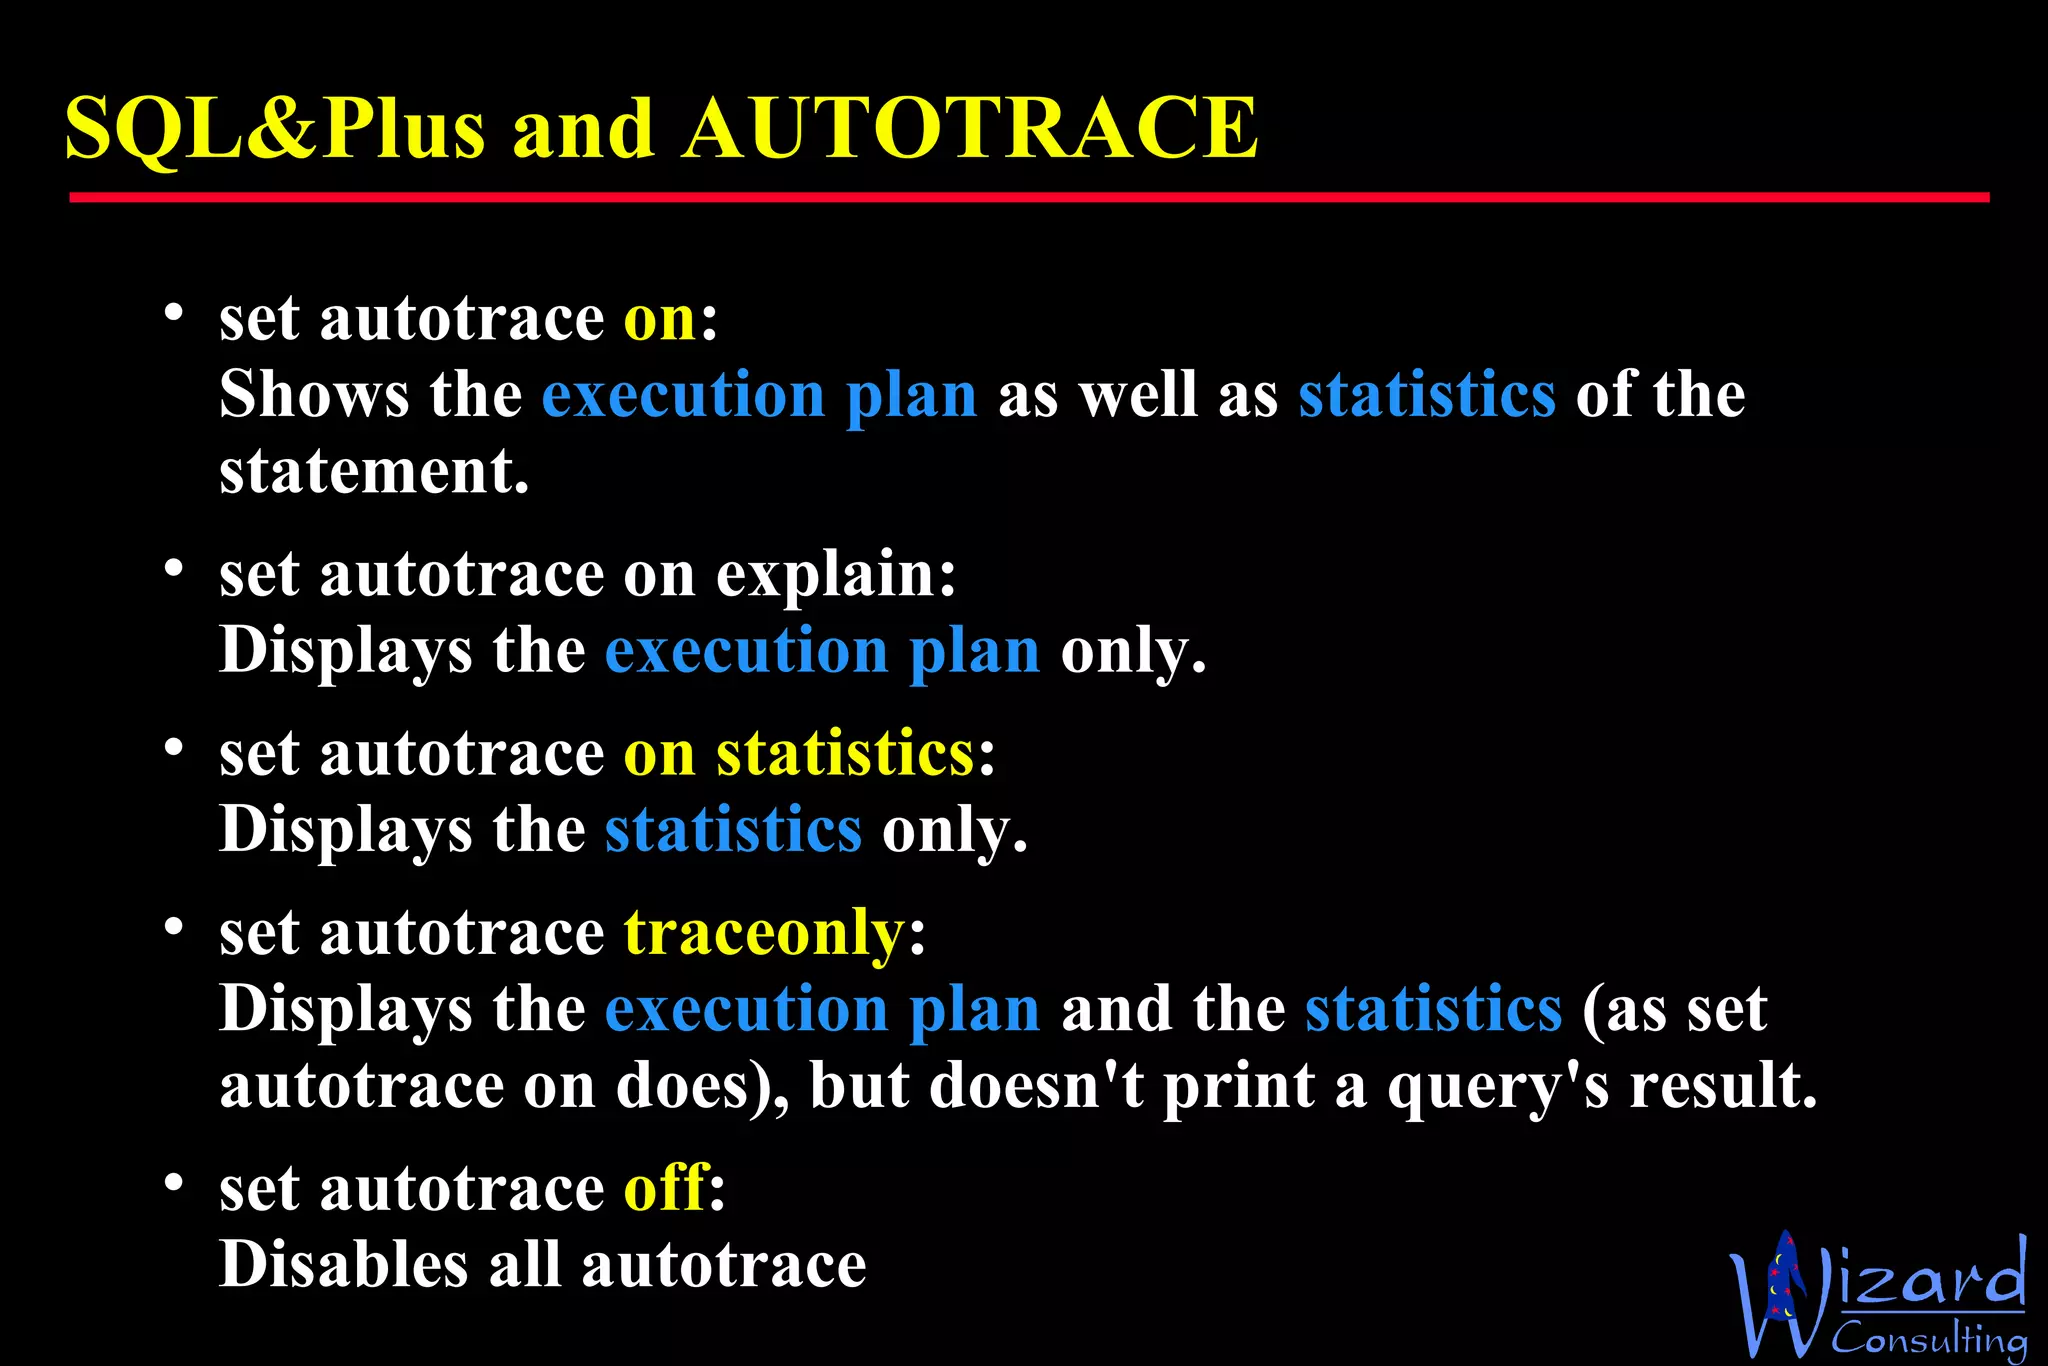
SQL&Plus and AUTOTRACE set autotrace  on : Shows the  execution plan  as well as  statistics  of the statement.  set autotrace on explain: Displays the  execution plan  only.  set autotrace  on statistics : Displays the  statistics  only.  set autotrace  traceonly : Displays the  execution plan  and the  statistics  (as set autotrace on does), but doesn't print a query's result.  set autotrace  off : Disables all autotrace
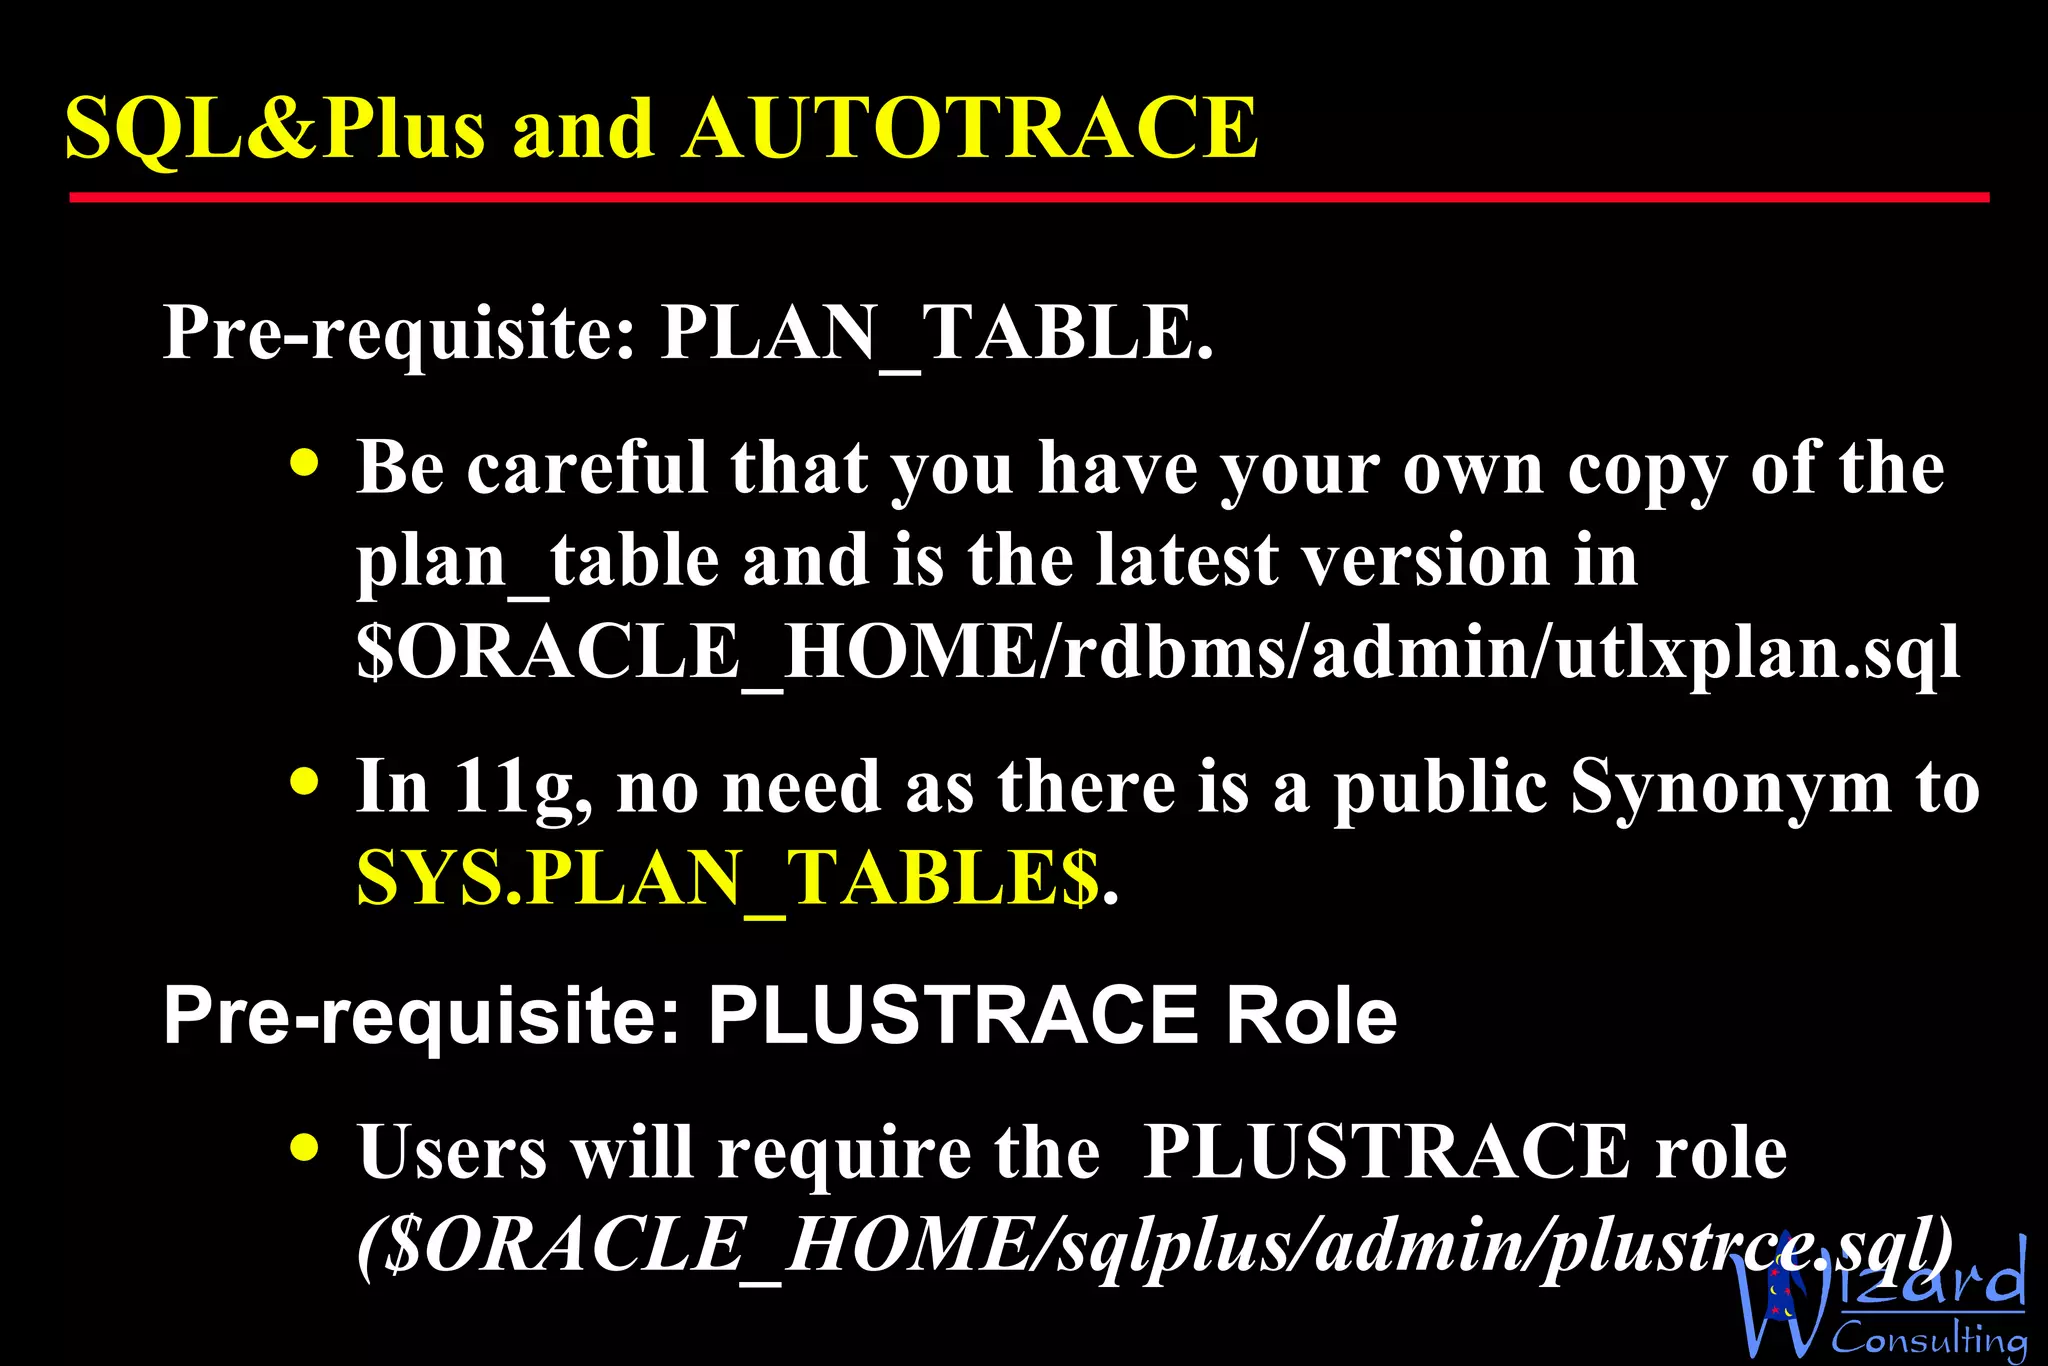
SQL&Plus and AUTOTRACE Pre-requisite: PLAN_TABLE.  Be careful that you have your own copy of the plan_table and is the latest version in $ORACLE_HOME/rdbms/admin/utlxplan.sql  In 11g, no need as there is a public Synonym to  SYS.PLAN_TABLE$ . Pre-requisite: PLUSTRACE Role Users will require the  PLUSTRACE role  ($ORACLE_HOME/sqlplus/admin/plustrce.sql)
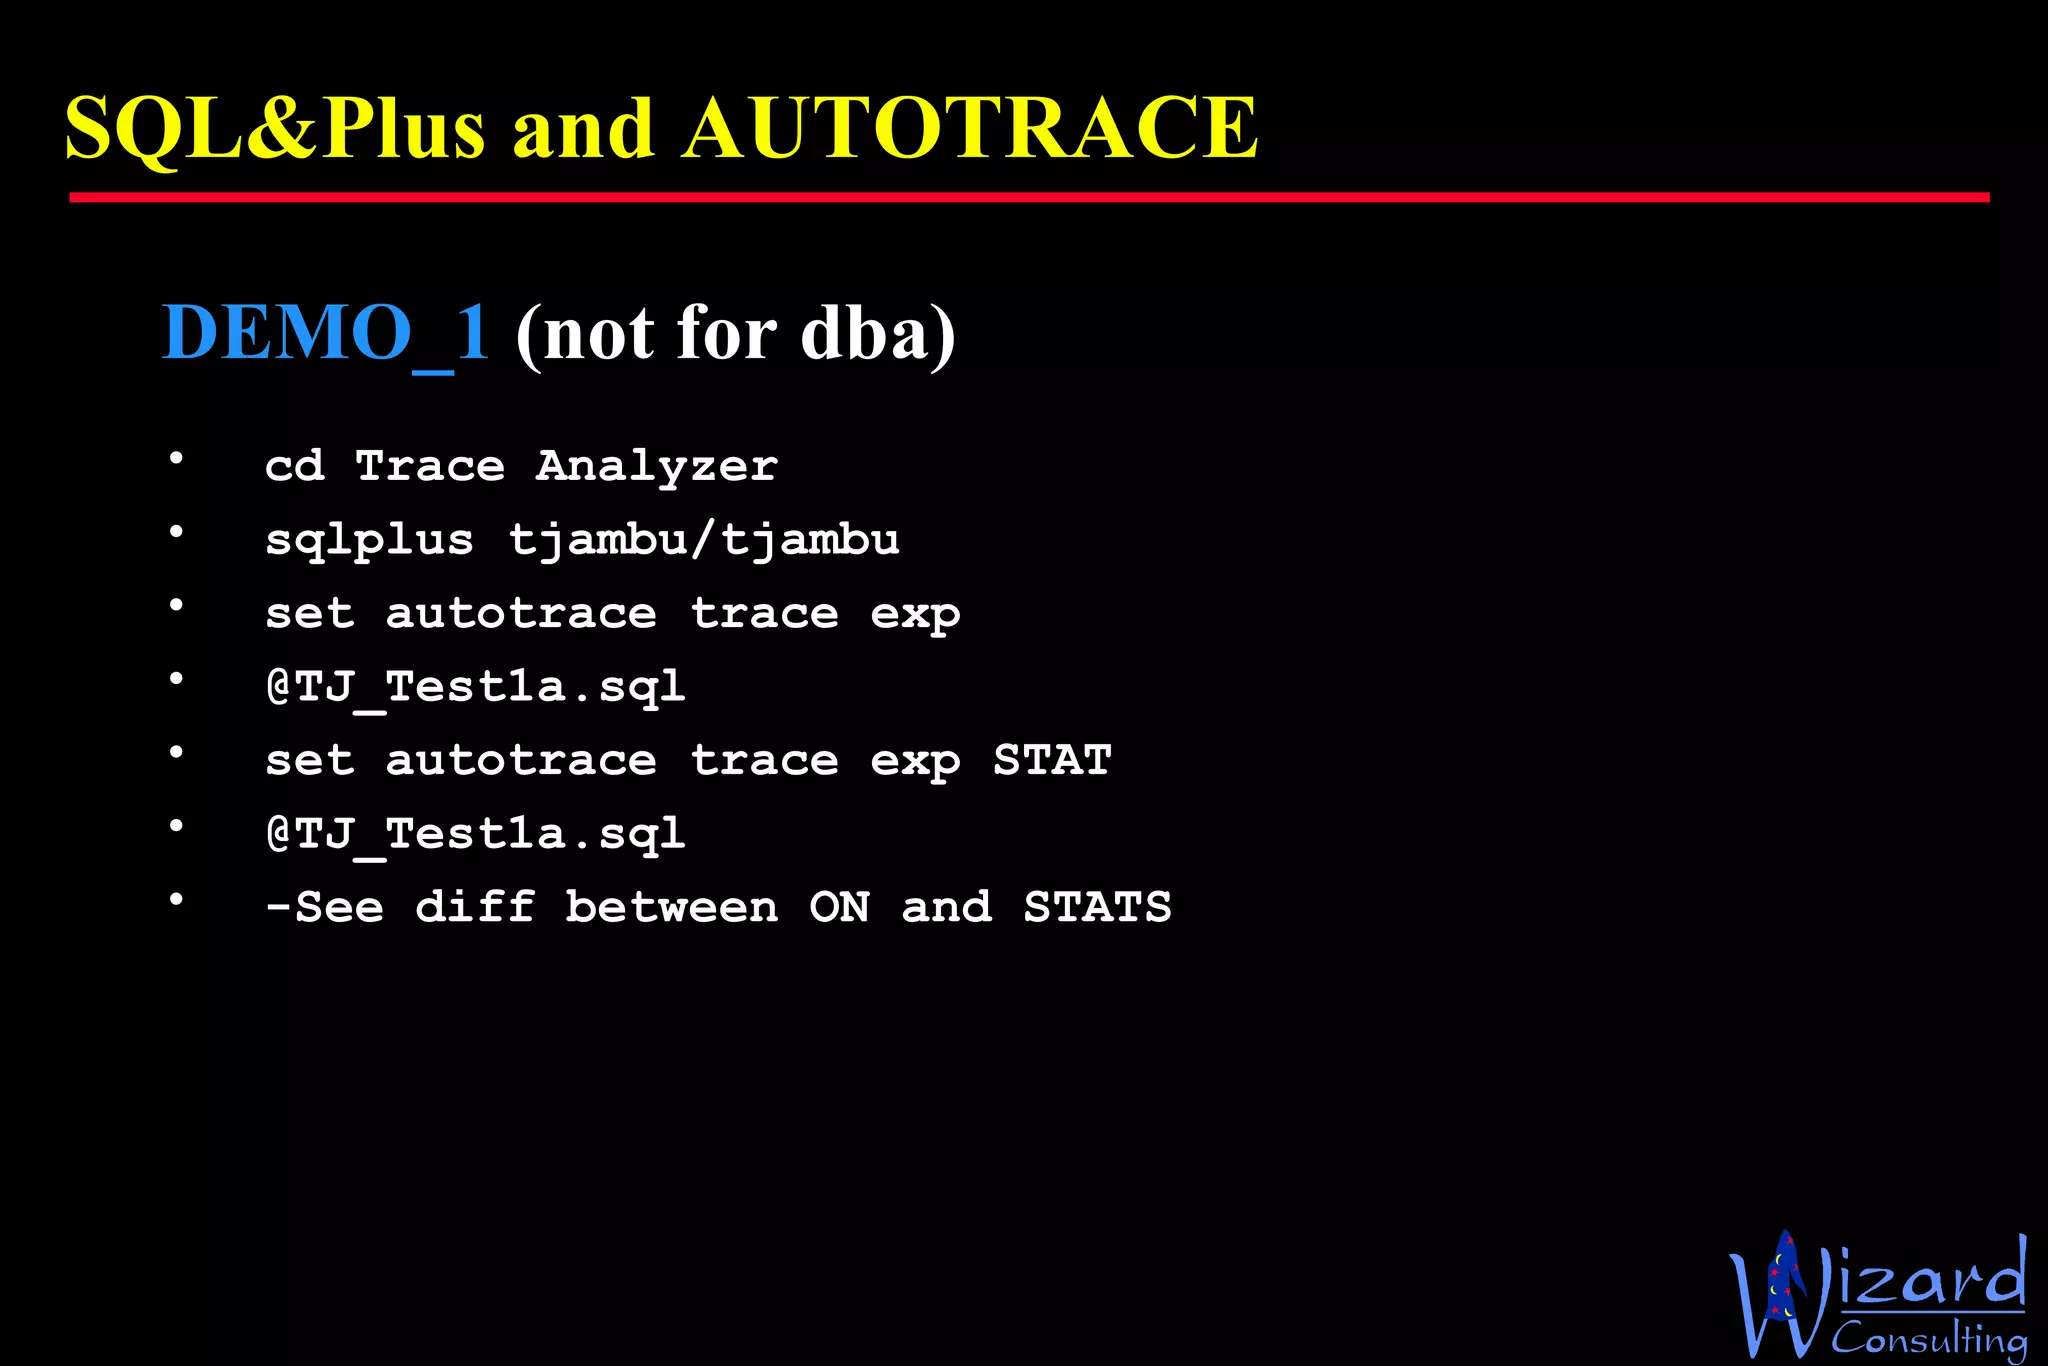
SQL&Plus and AUTOTRACE DEMO_1   (not for dba) cd Trace Analyzer sqlplus tjambu/tjambu set autotrace trace exp @TJ_Test1a.sql set autotrace trace exp STAT @TJ_Test1a.sql -See diff between ON and STATS
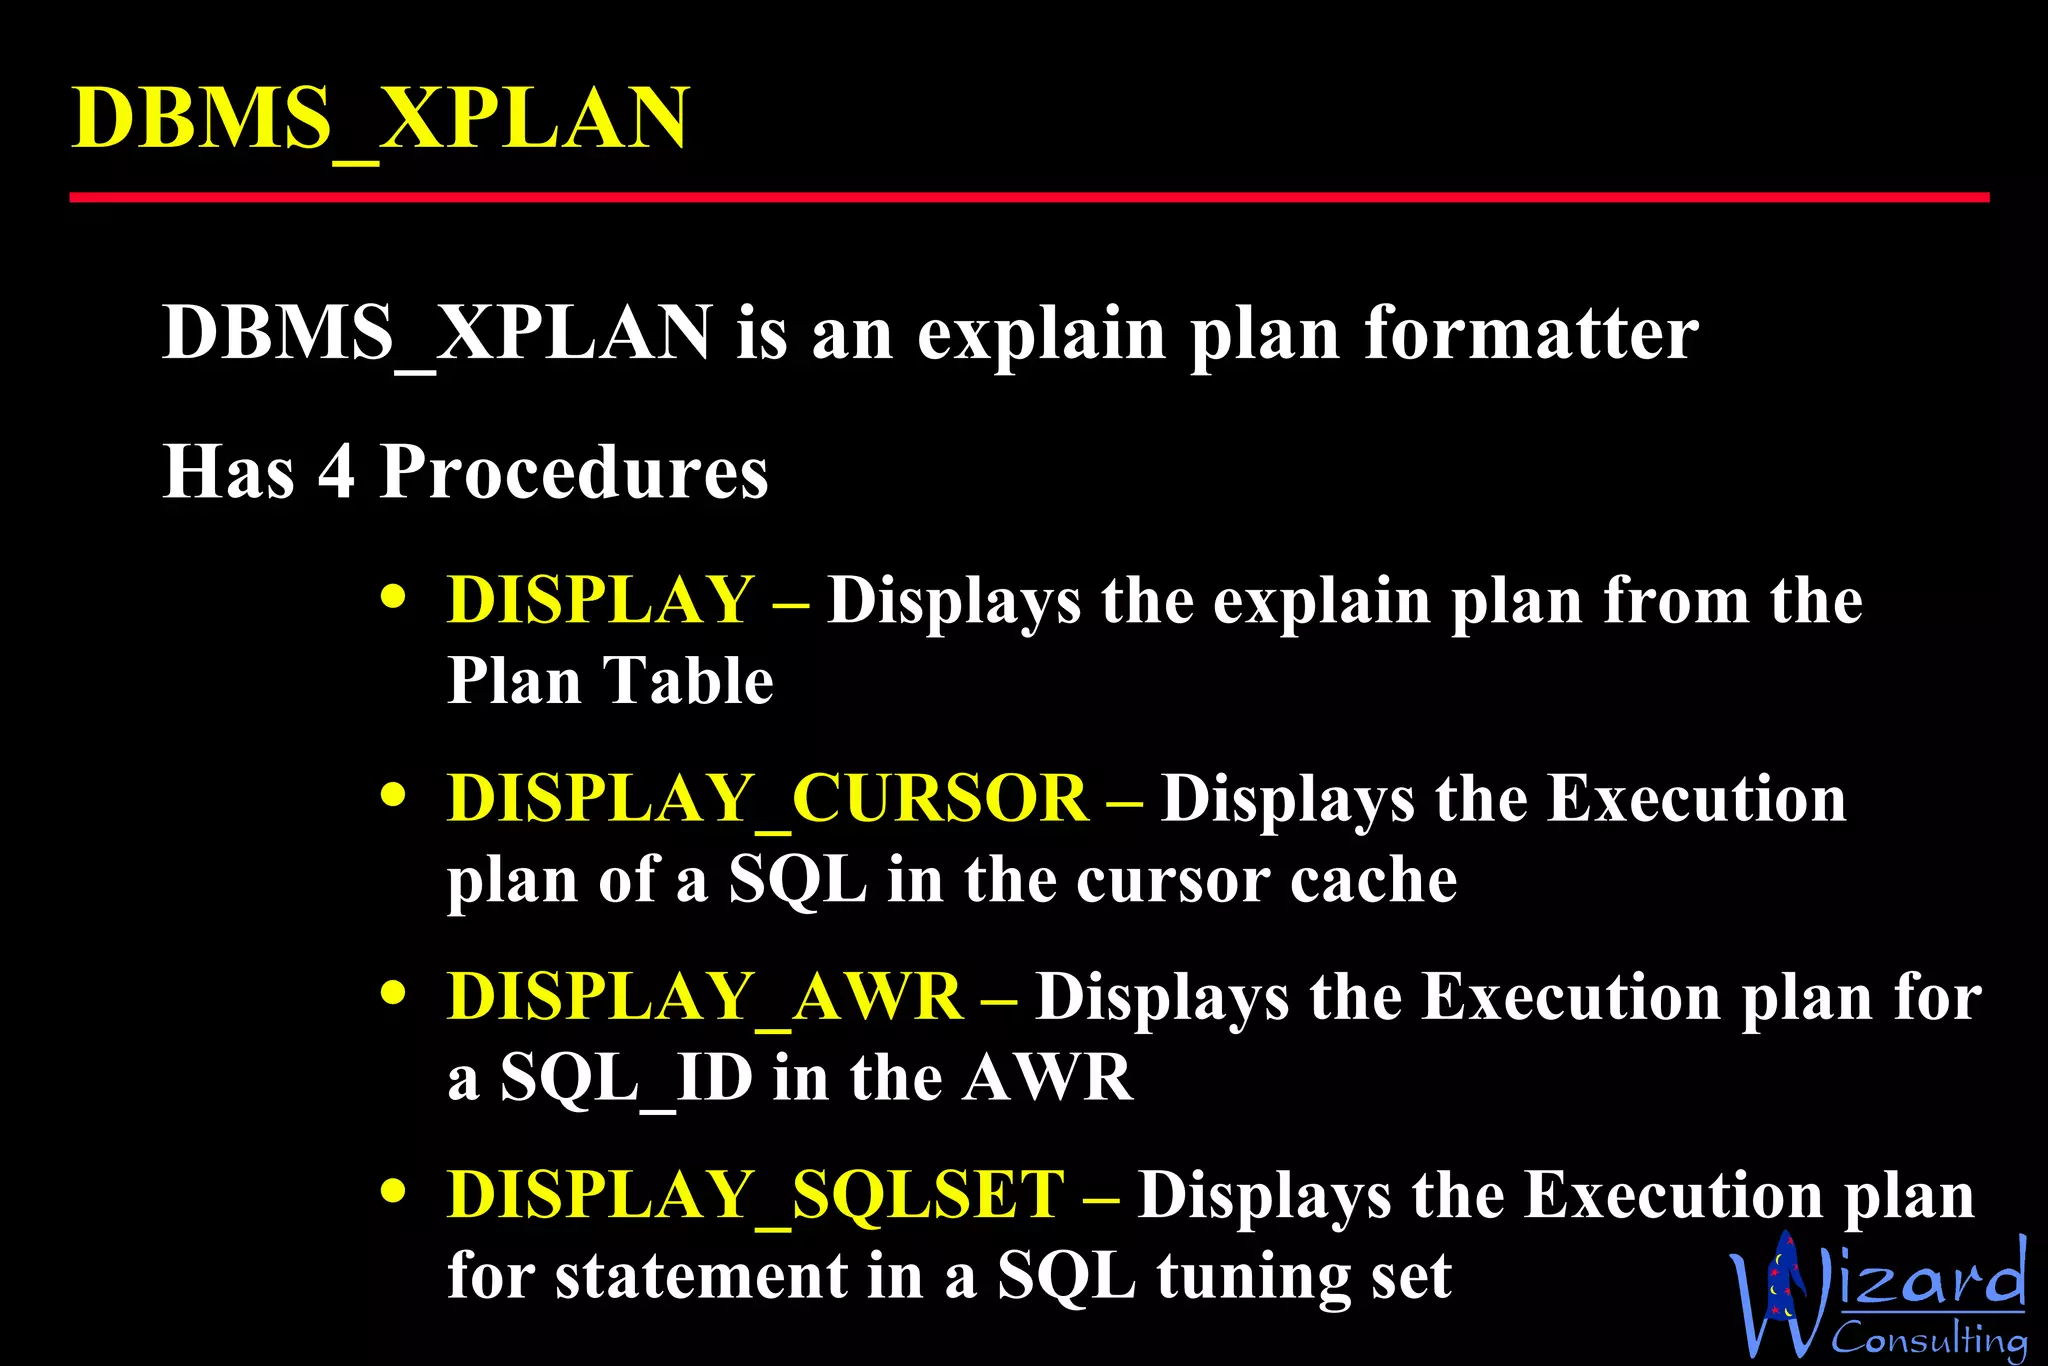
DBMS_XPLAN DBMS_XPLAN is an explain plan formatter Has 4 Procedures DISPLAY –  Displays the explain plan from the Plan Table DISPLAY_CURSOR –  Displays the Execution plan of a SQL in the cursor cache DISPLAY_AWR –  Displays the Execution plan for a SQL_ID in the AWR DISPLAY_SQLSET –  Displays the Execution plan for statement in a SQL tuning set
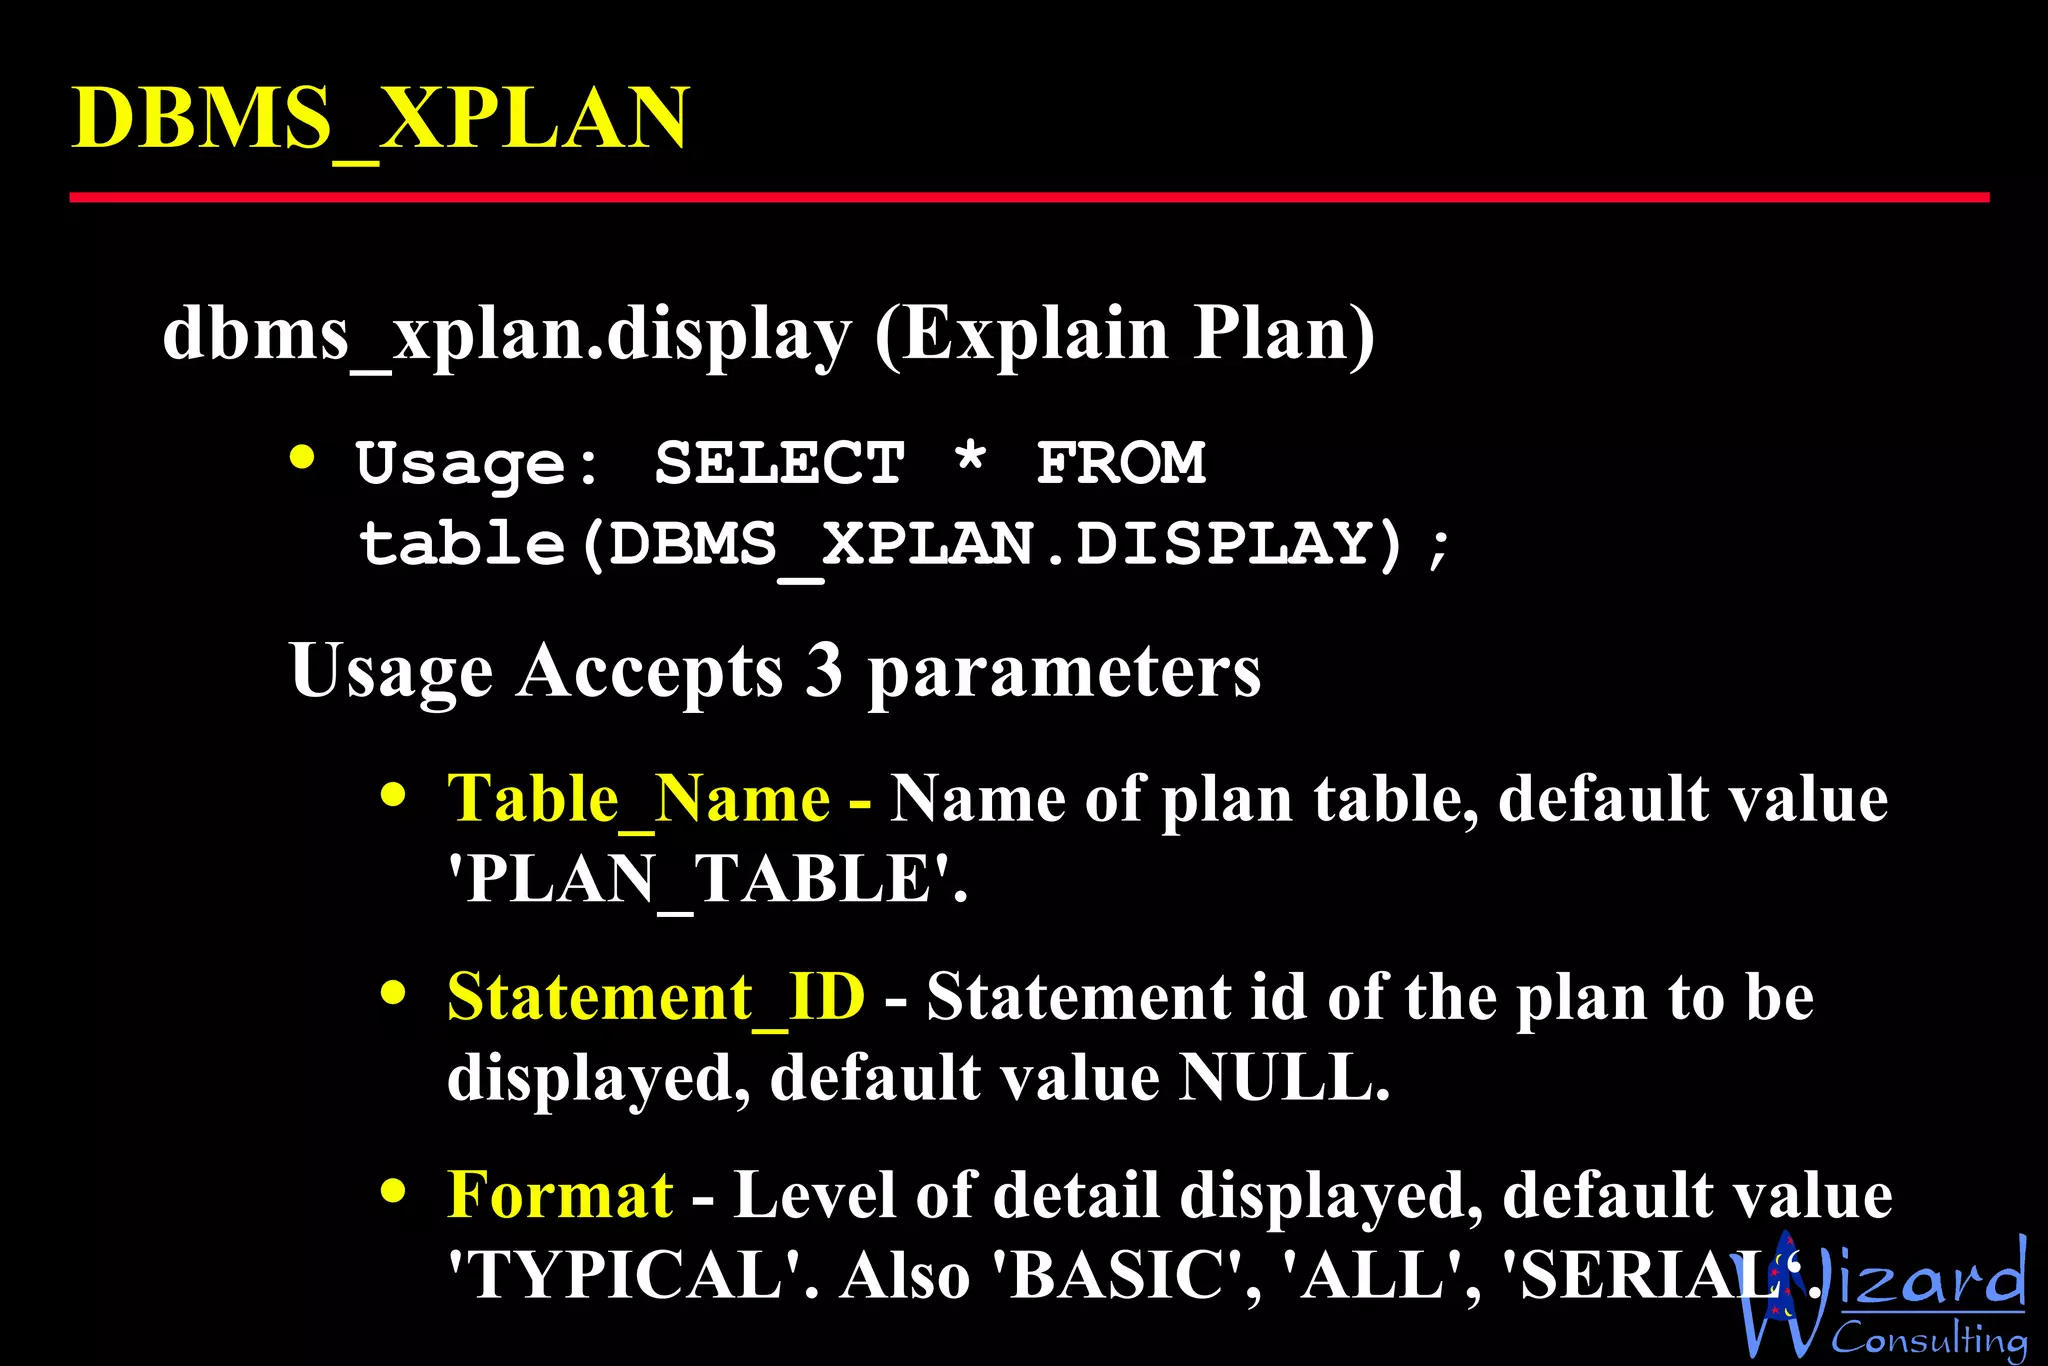
DBMS_XPLAN dbms_xplan.display (Explain Plan) Usage: SELECT * FROM table(DBMS_XPLAN.DISPLAY); Usage  Accepts 3 parameters Table_Name -  Name of plan table, default value 'PLAN_TABLE'. Statement_ID  - Statement id of the plan to be displayed, default value NULL. Format  - Level of detail displayed, default value 'TYPICAL'. Also 'BASIC', 'ALL', 'SERIAL‘.
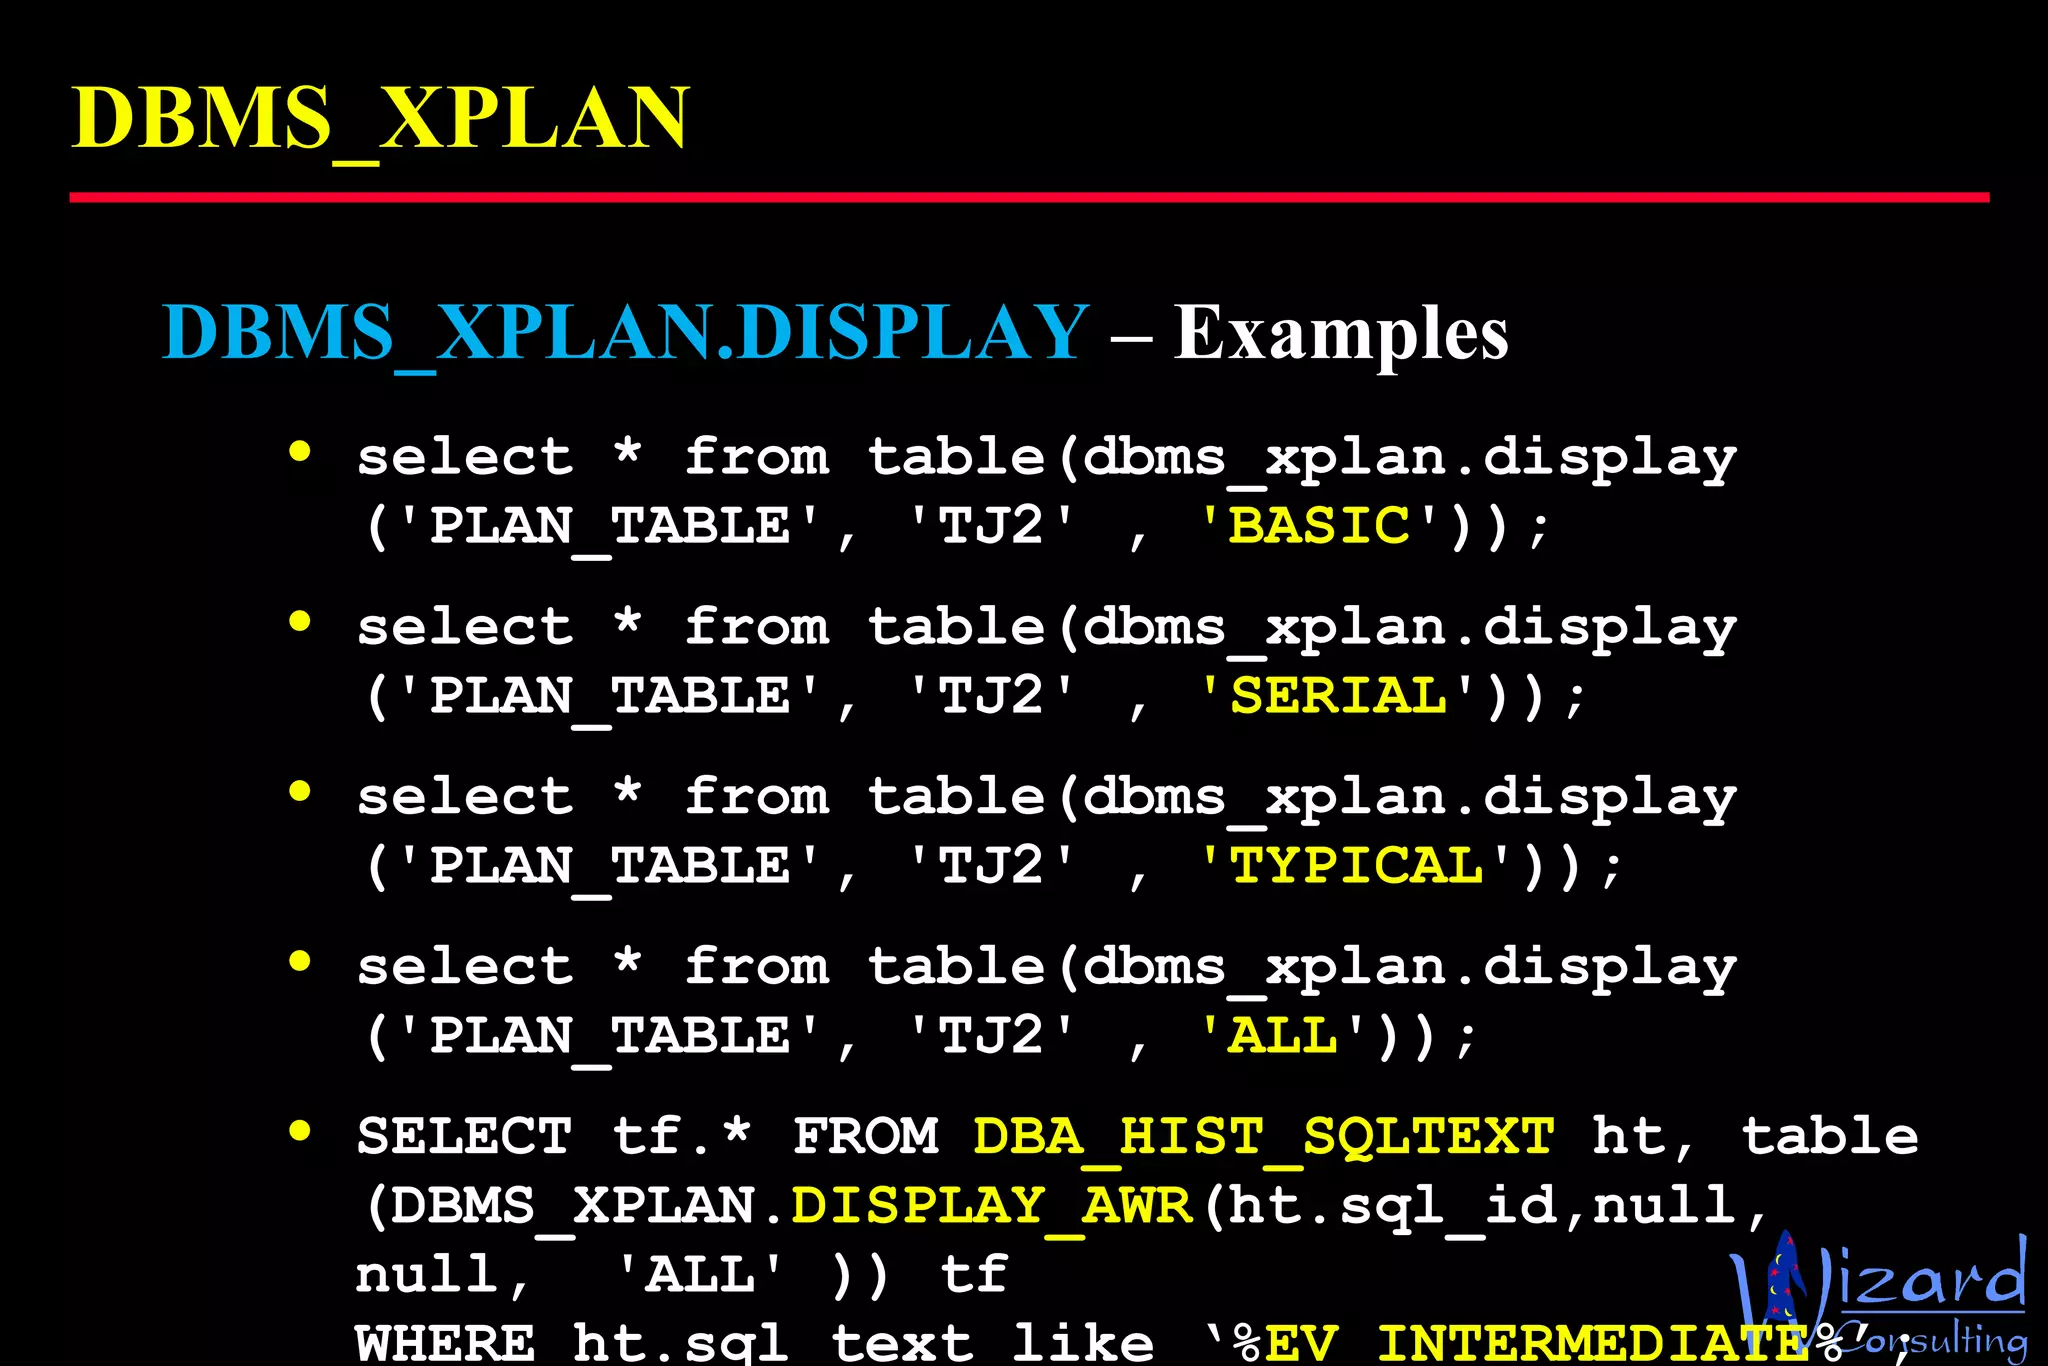
DBMS_XPLAN DBMS_XPLAN.DISPLAY  – Examples select * from table(dbms_xplan.display ('PLAN_TABLE', 'TJ2' ,  'BASIC ')); select * from table(dbms_xplan.display ('PLAN_TABLE', 'TJ2' ,  'SERIAL ')); select * from table(dbms_xplan.display ('PLAN_TABLE', 'TJ2' ,  'TYPICAL ')); select * from table(dbms_xplan.display ('PLAN_TABLE', 'TJ2' ,  'ALL ')); SELECT tf.* FROM  DBA_HIST_SQLTEXT  ht, table (DBMS_XPLAN. DISPLAY_AWR (ht.sql_id,null, null,  'ALL' )) tf  WHERE ht.sql_text like ‘% EV_INTERMEDIATE %’;
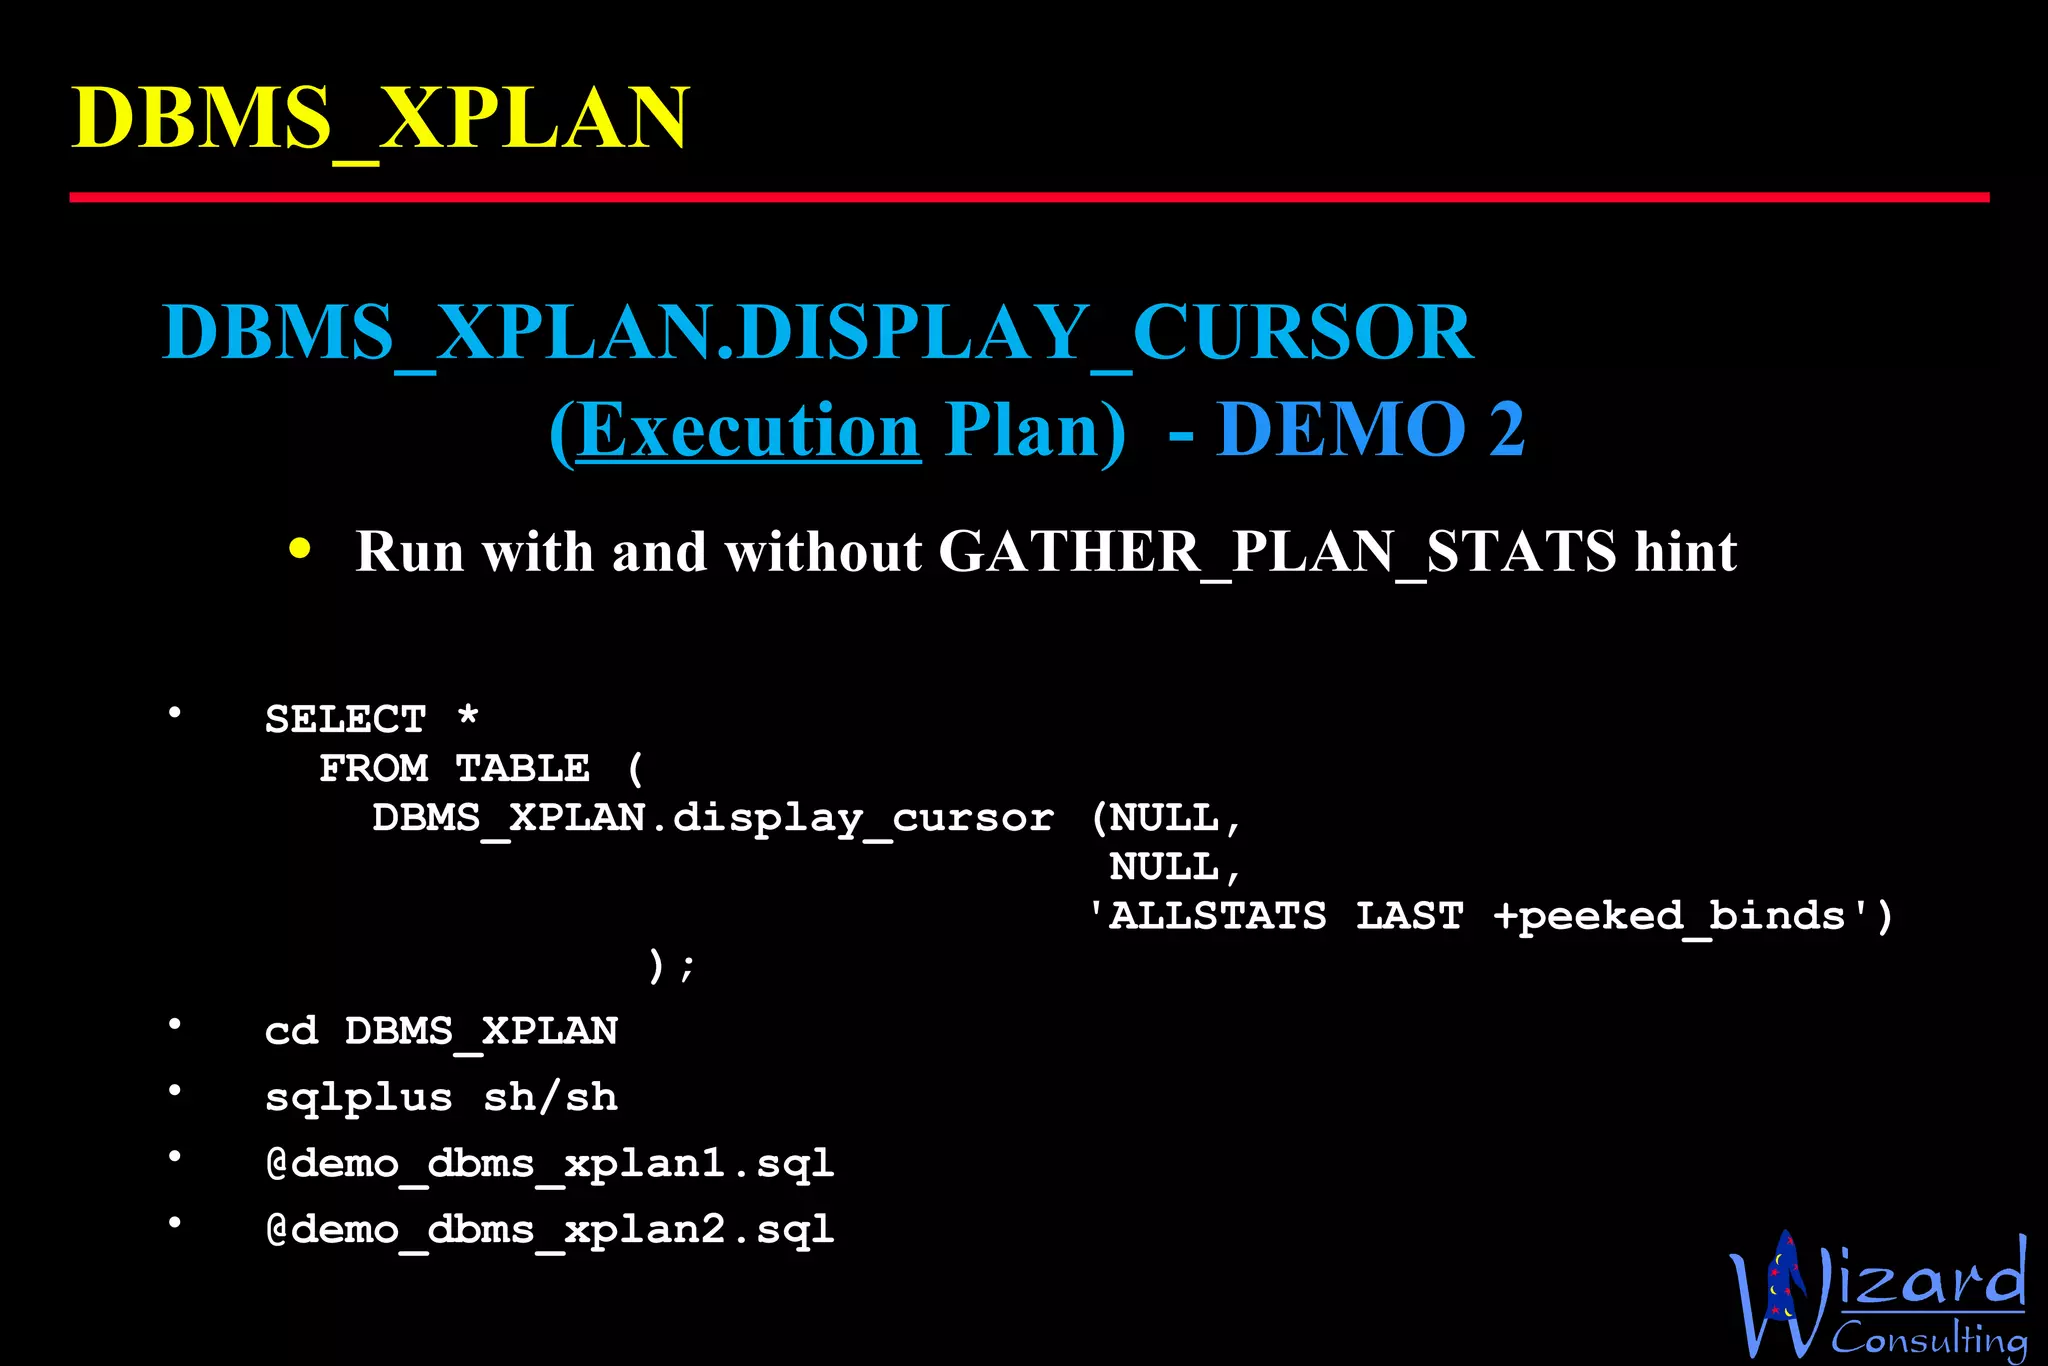
DBMS_XPLAN DBMS_XPLAN.DISPLAY_CURSOR    ( Execution  Plan)  -  DEMO 2   Run with and without GATHER_PLAN_STATS hint SELECT *   FROM TABLE (   DBMS_XPLAN.display_cursor (NULL,    NULL,    'ALLSTATS LAST +peeked_binds')   ); cd DBMS_XPLAN sqlplus sh/sh @demo_dbms_xplan1.sql @demo_dbms_xplan2.sql
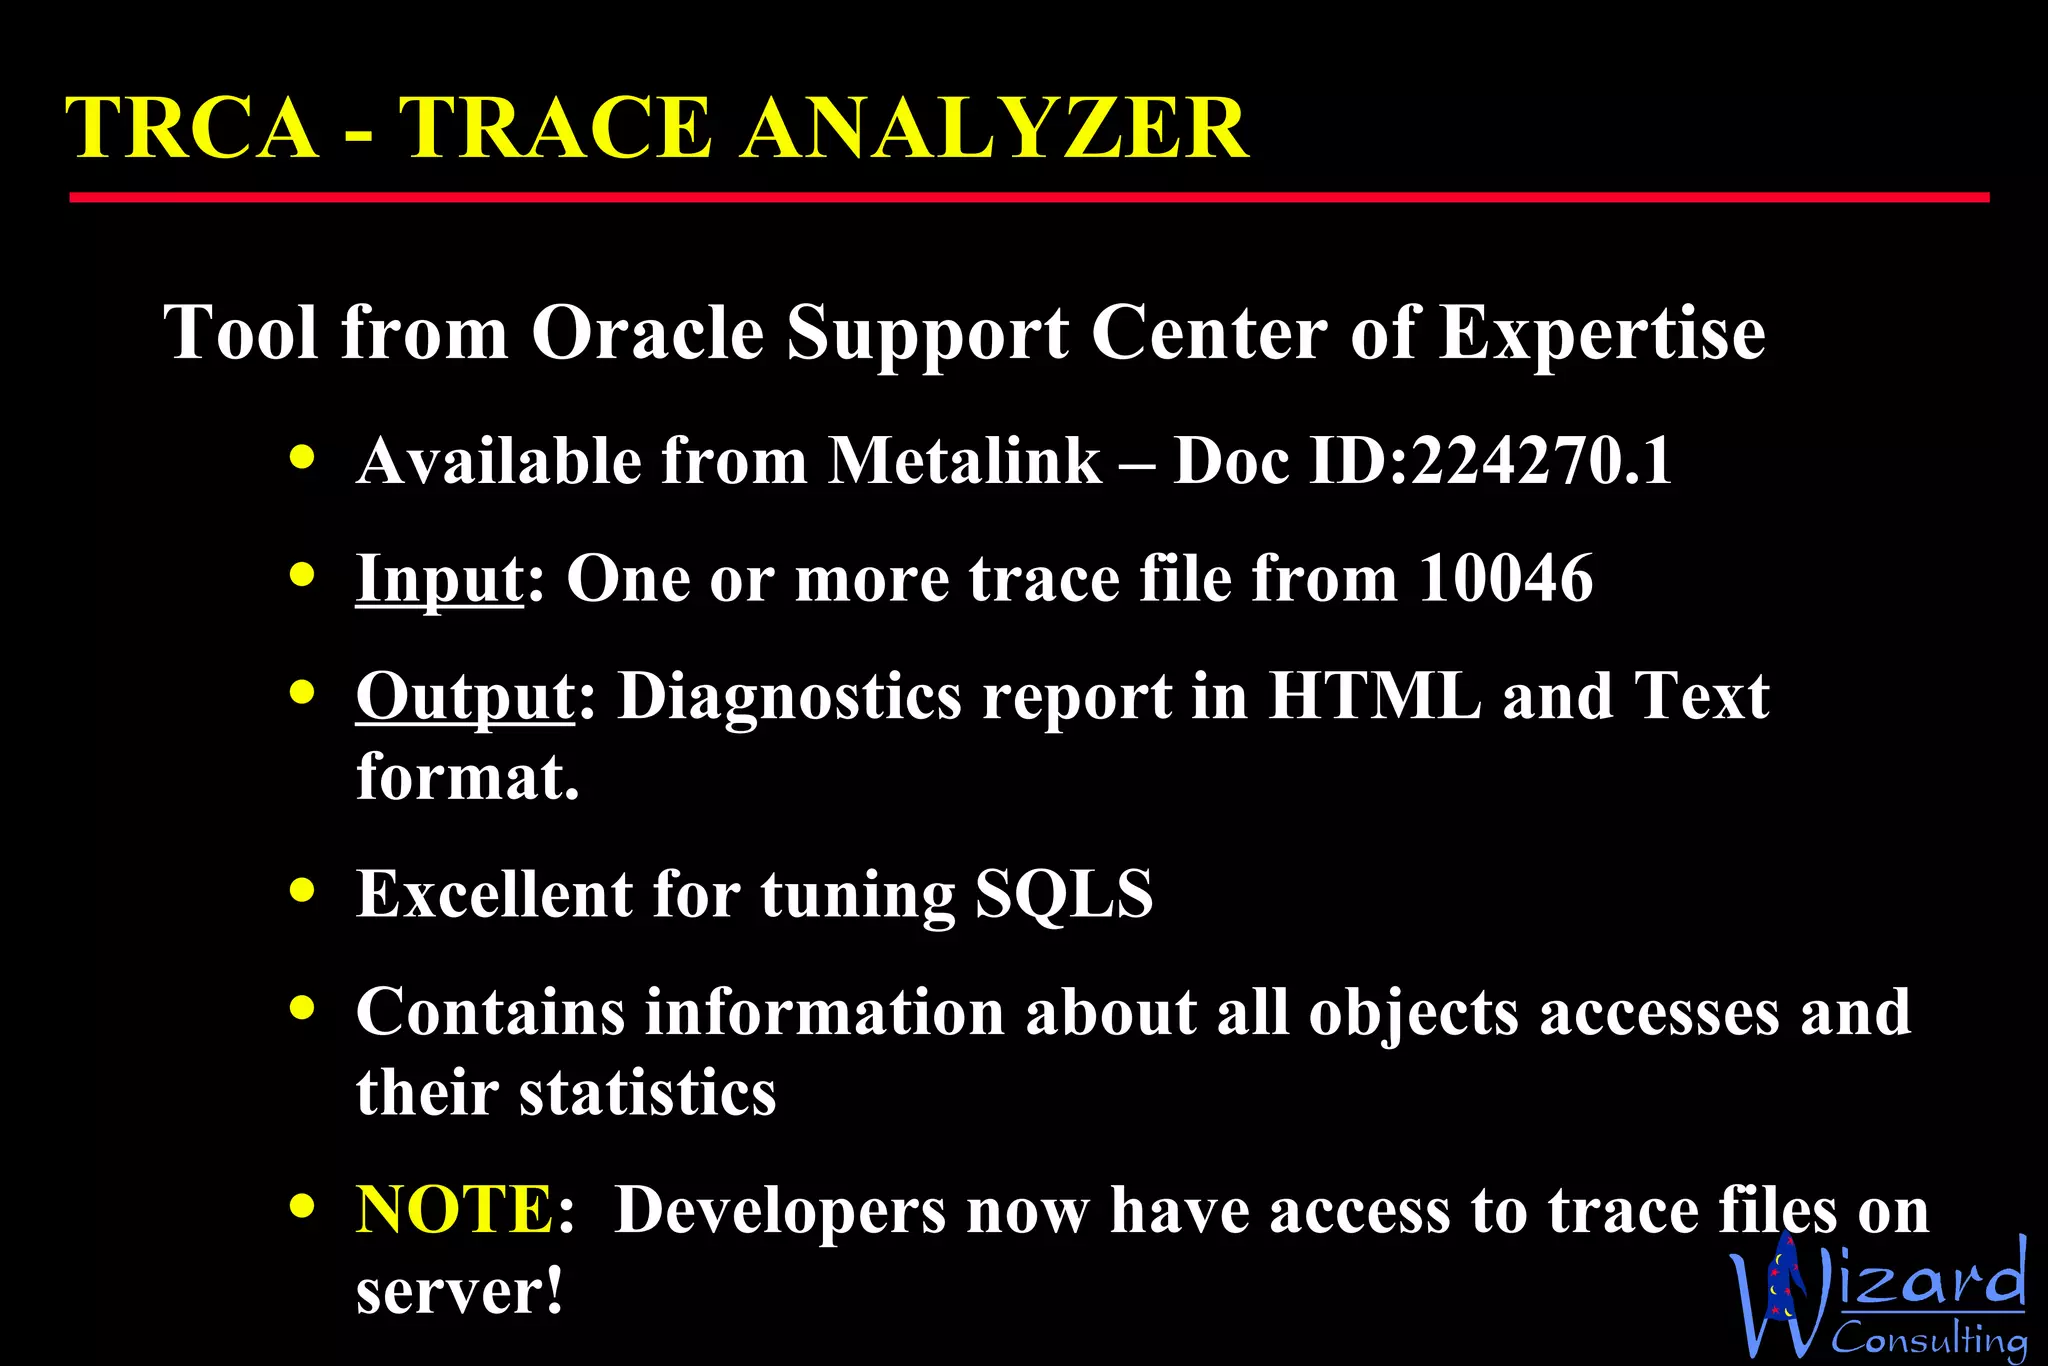
TRCA -  TRACE ANALYZER Tool from Oracle Support Center of Expertise Available from Metalink – Doc ID: 224270.1 Input : One or more trace file from 10046 Output : Diagnostics report in HTML and Text format.  Excellent for tuning SQLS Contains information about all objects accesses and their statistics NOTE :  Developers now have access to trace files on server!
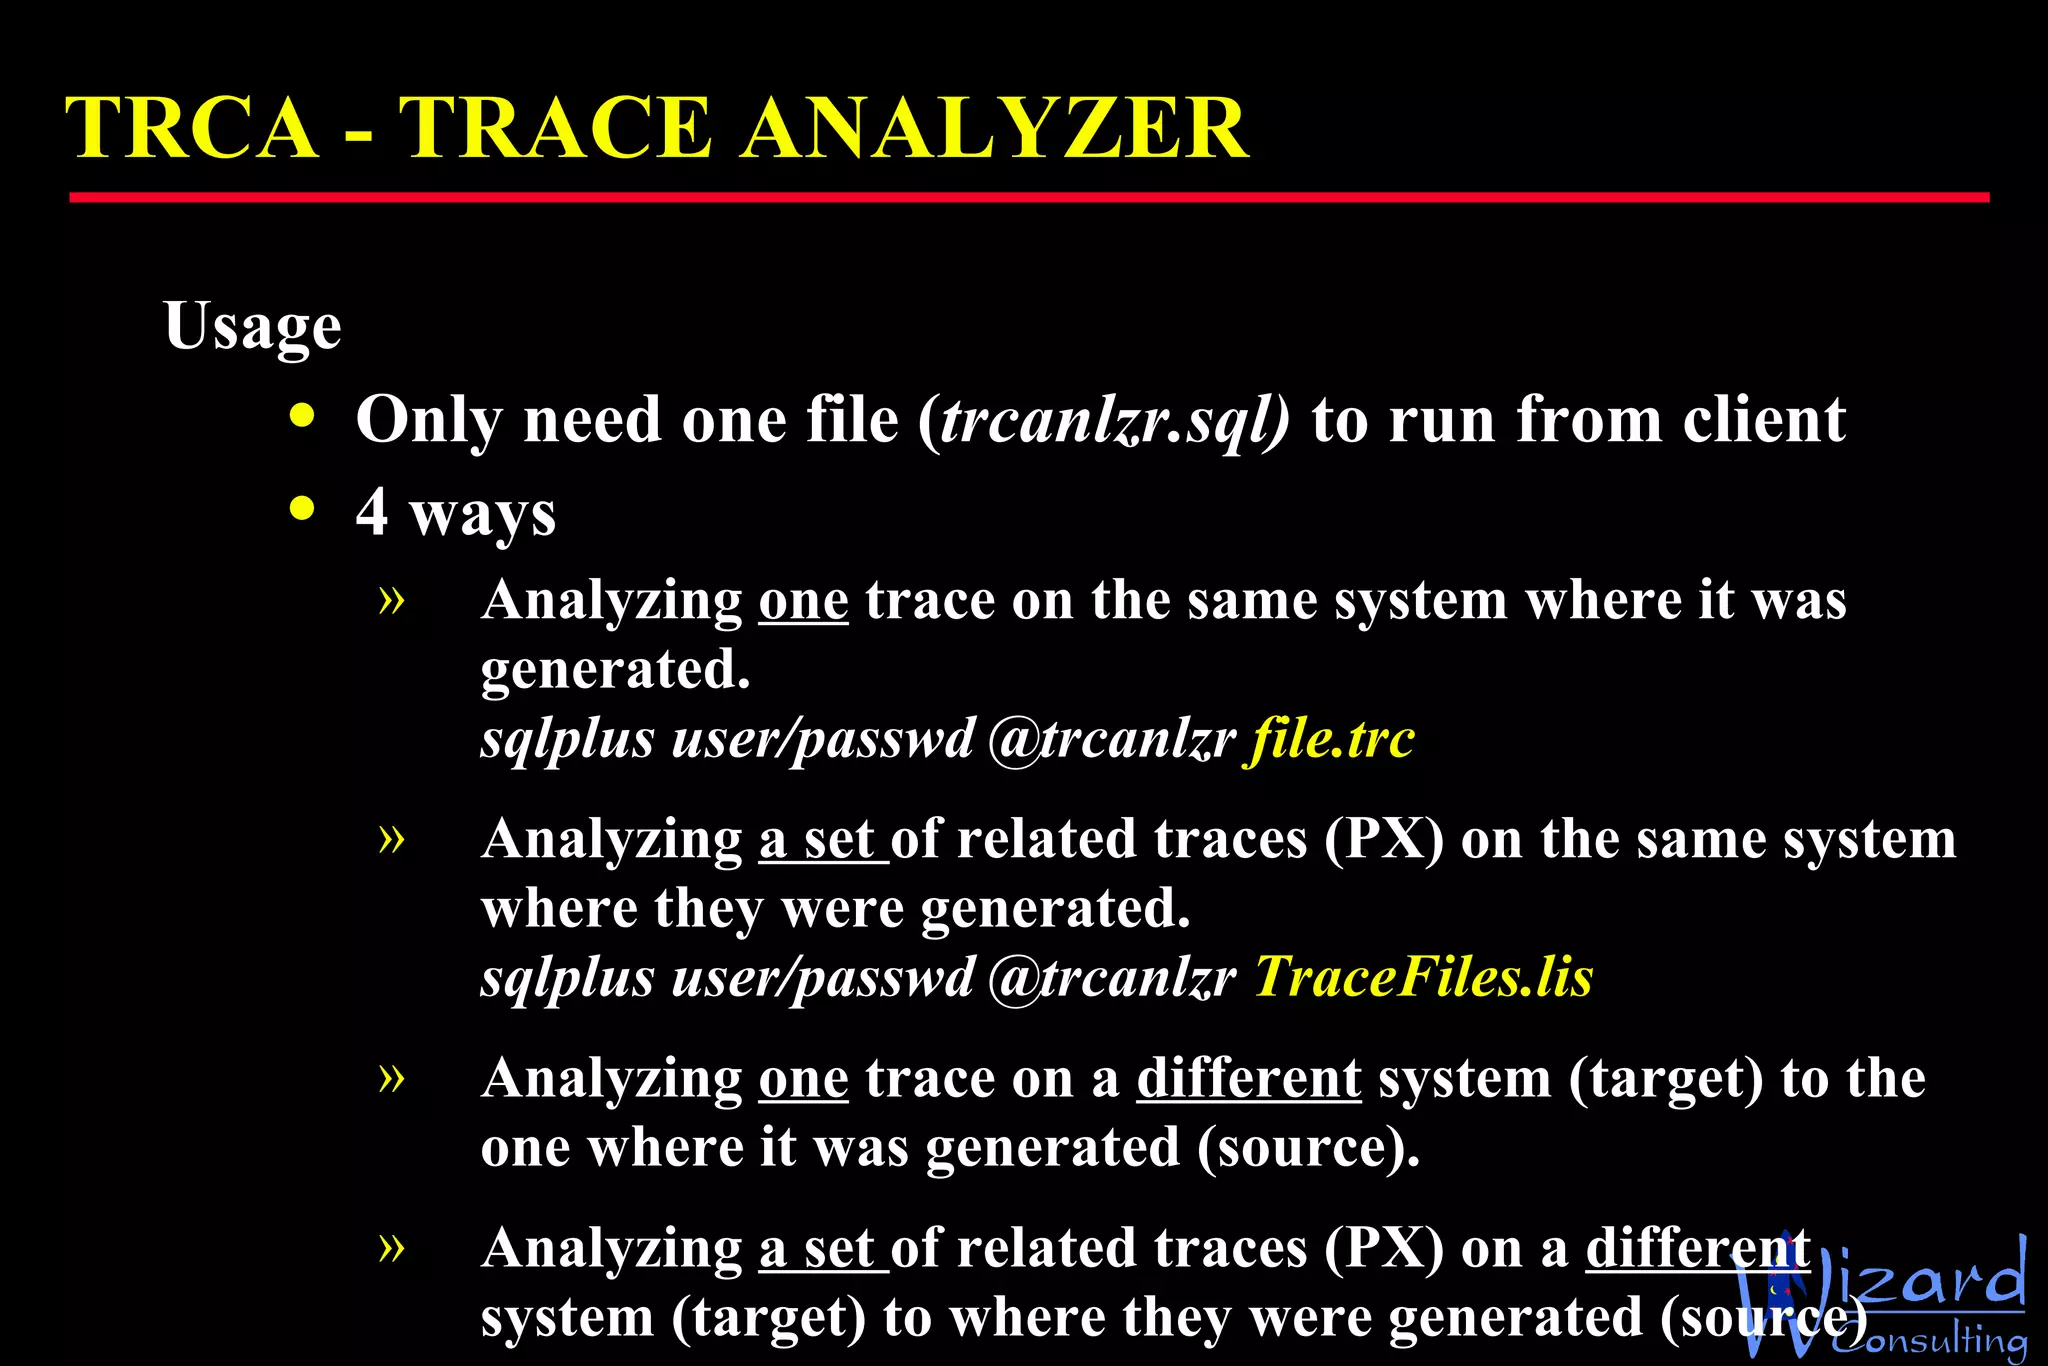
TRCA -  TRACE ANALYZER Usage Only need one file ( trcanlzr.sql)  to run from client 4 ways Analyzing  one  trace on the same system where it was generated. sqlplus user/passwd @trcanlzr  file.trc  Analyzing  a set  of related traces (PX) on the same system where they were generated.  sqlplus user/passwd @trcanlzr  TraceFiles.lis Analyzing  one  trace on a  different  system (target) to the one where it was generated (source). Analyzing  a set  of related traces (PX) on a  different  system (target) to where they were generated (source)
TRCA -  TRACE ANALYZER DEMO 3 Only need one SQL file to run from client cd trca/run sqlplus sh/sh @trcanlzr.sql TraceFiles.lis
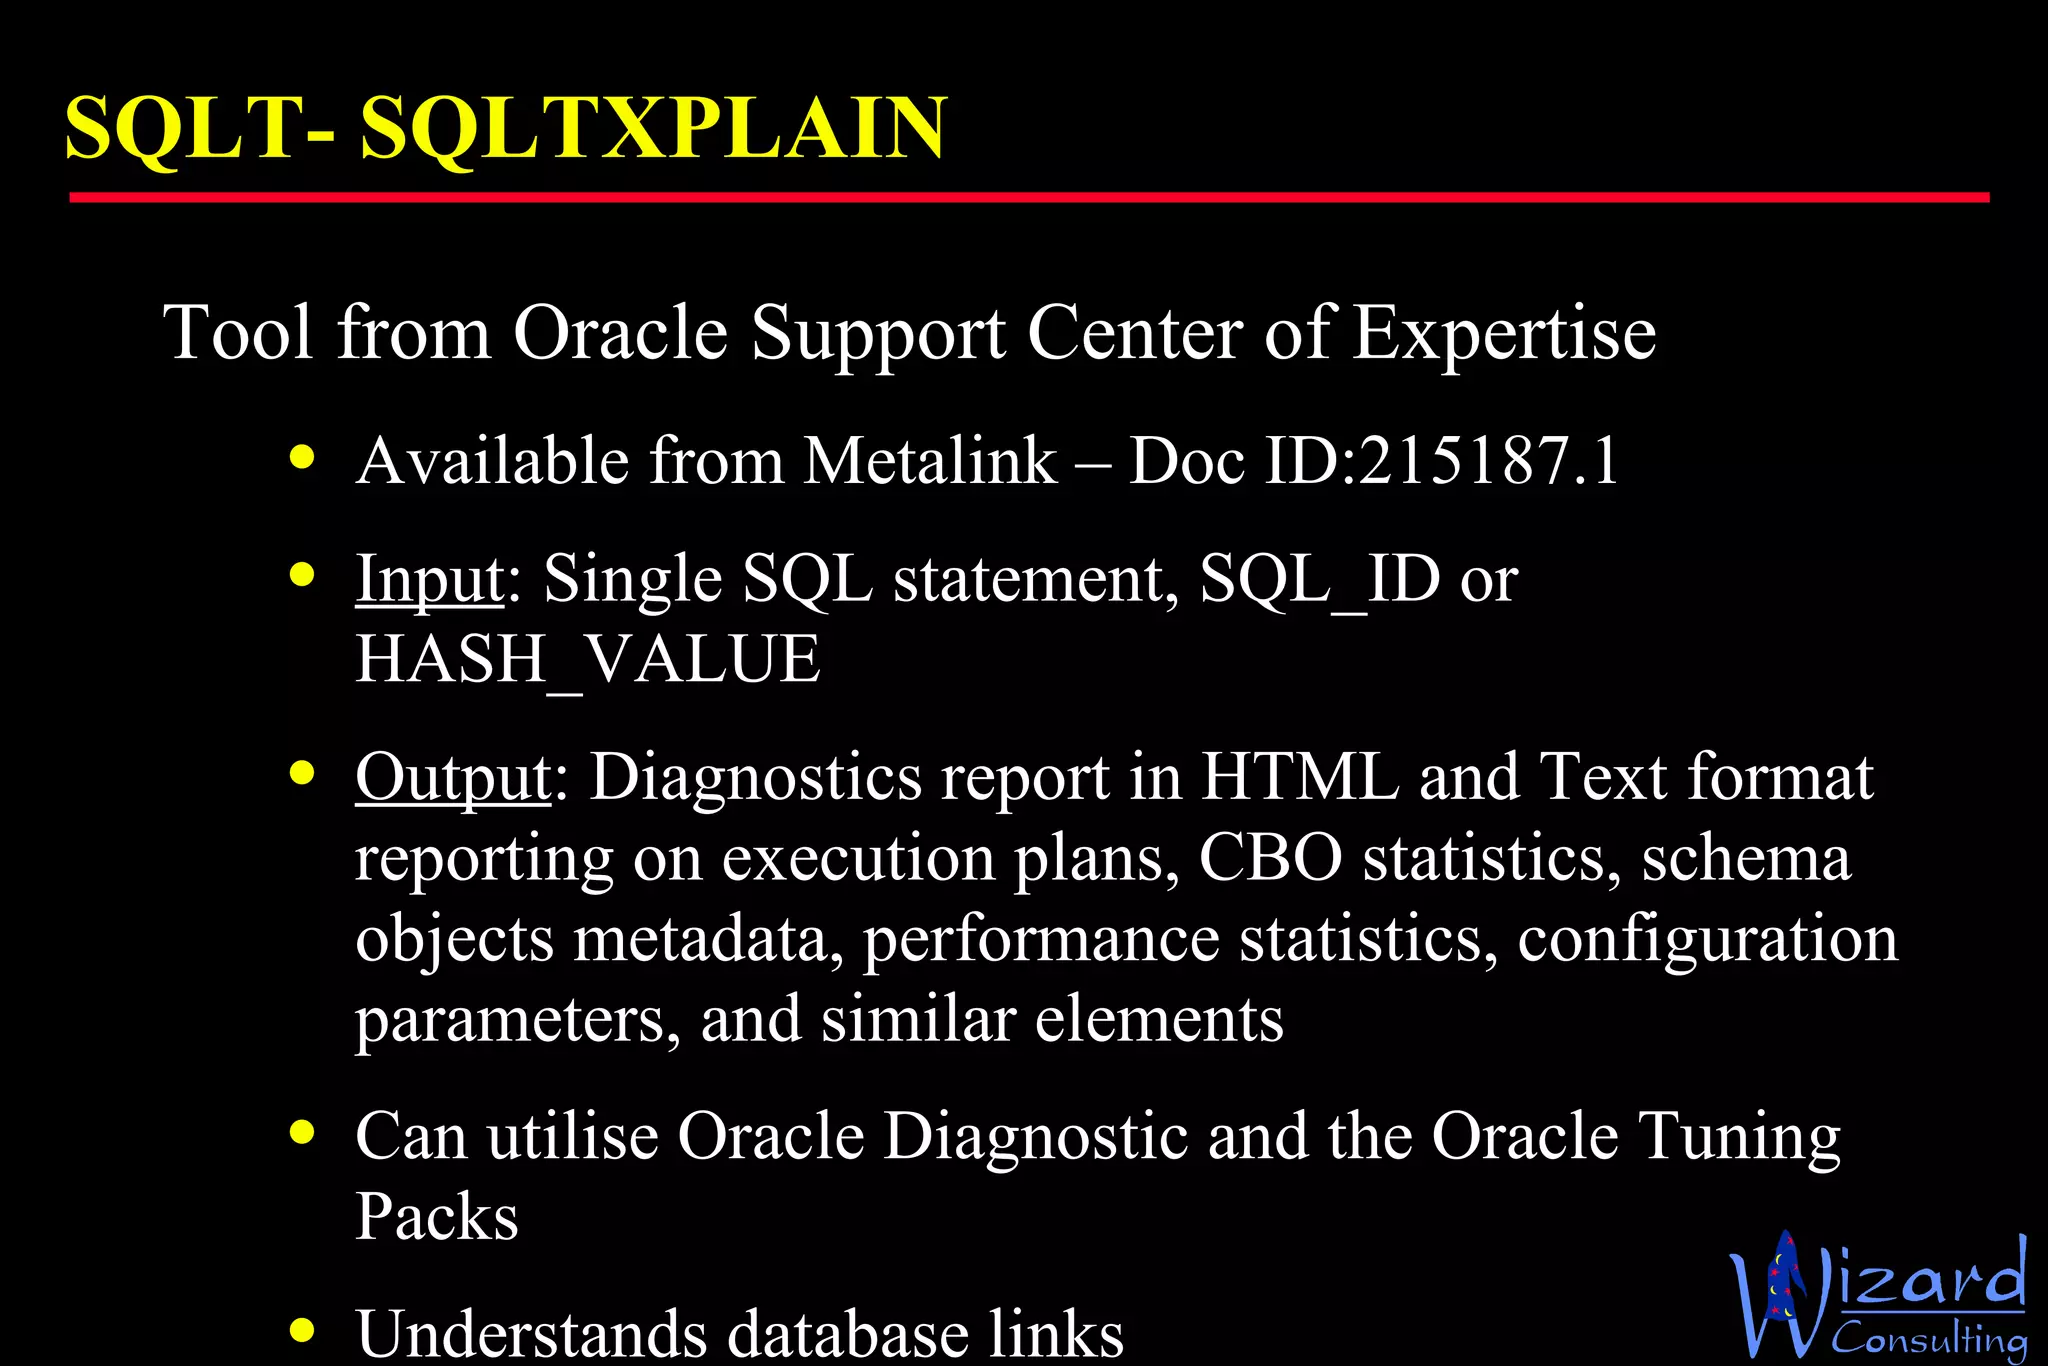
SQLT-  SQLTXPLAIN Tool from Oracle Support Center of Expertise Available from Metalink – Doc ID: 215187.1  Input : Single SQL statement, SQL_ID or  HASH_VALUE Output : Diagnostics report in HTML and Text format reporting on execution plans, CBO statistics, schema objects metadata, performance statistics, configuration parameters, and similar elements Can utilise Oracle Diagnostic and the Oracle Tuning Packs Understands database links
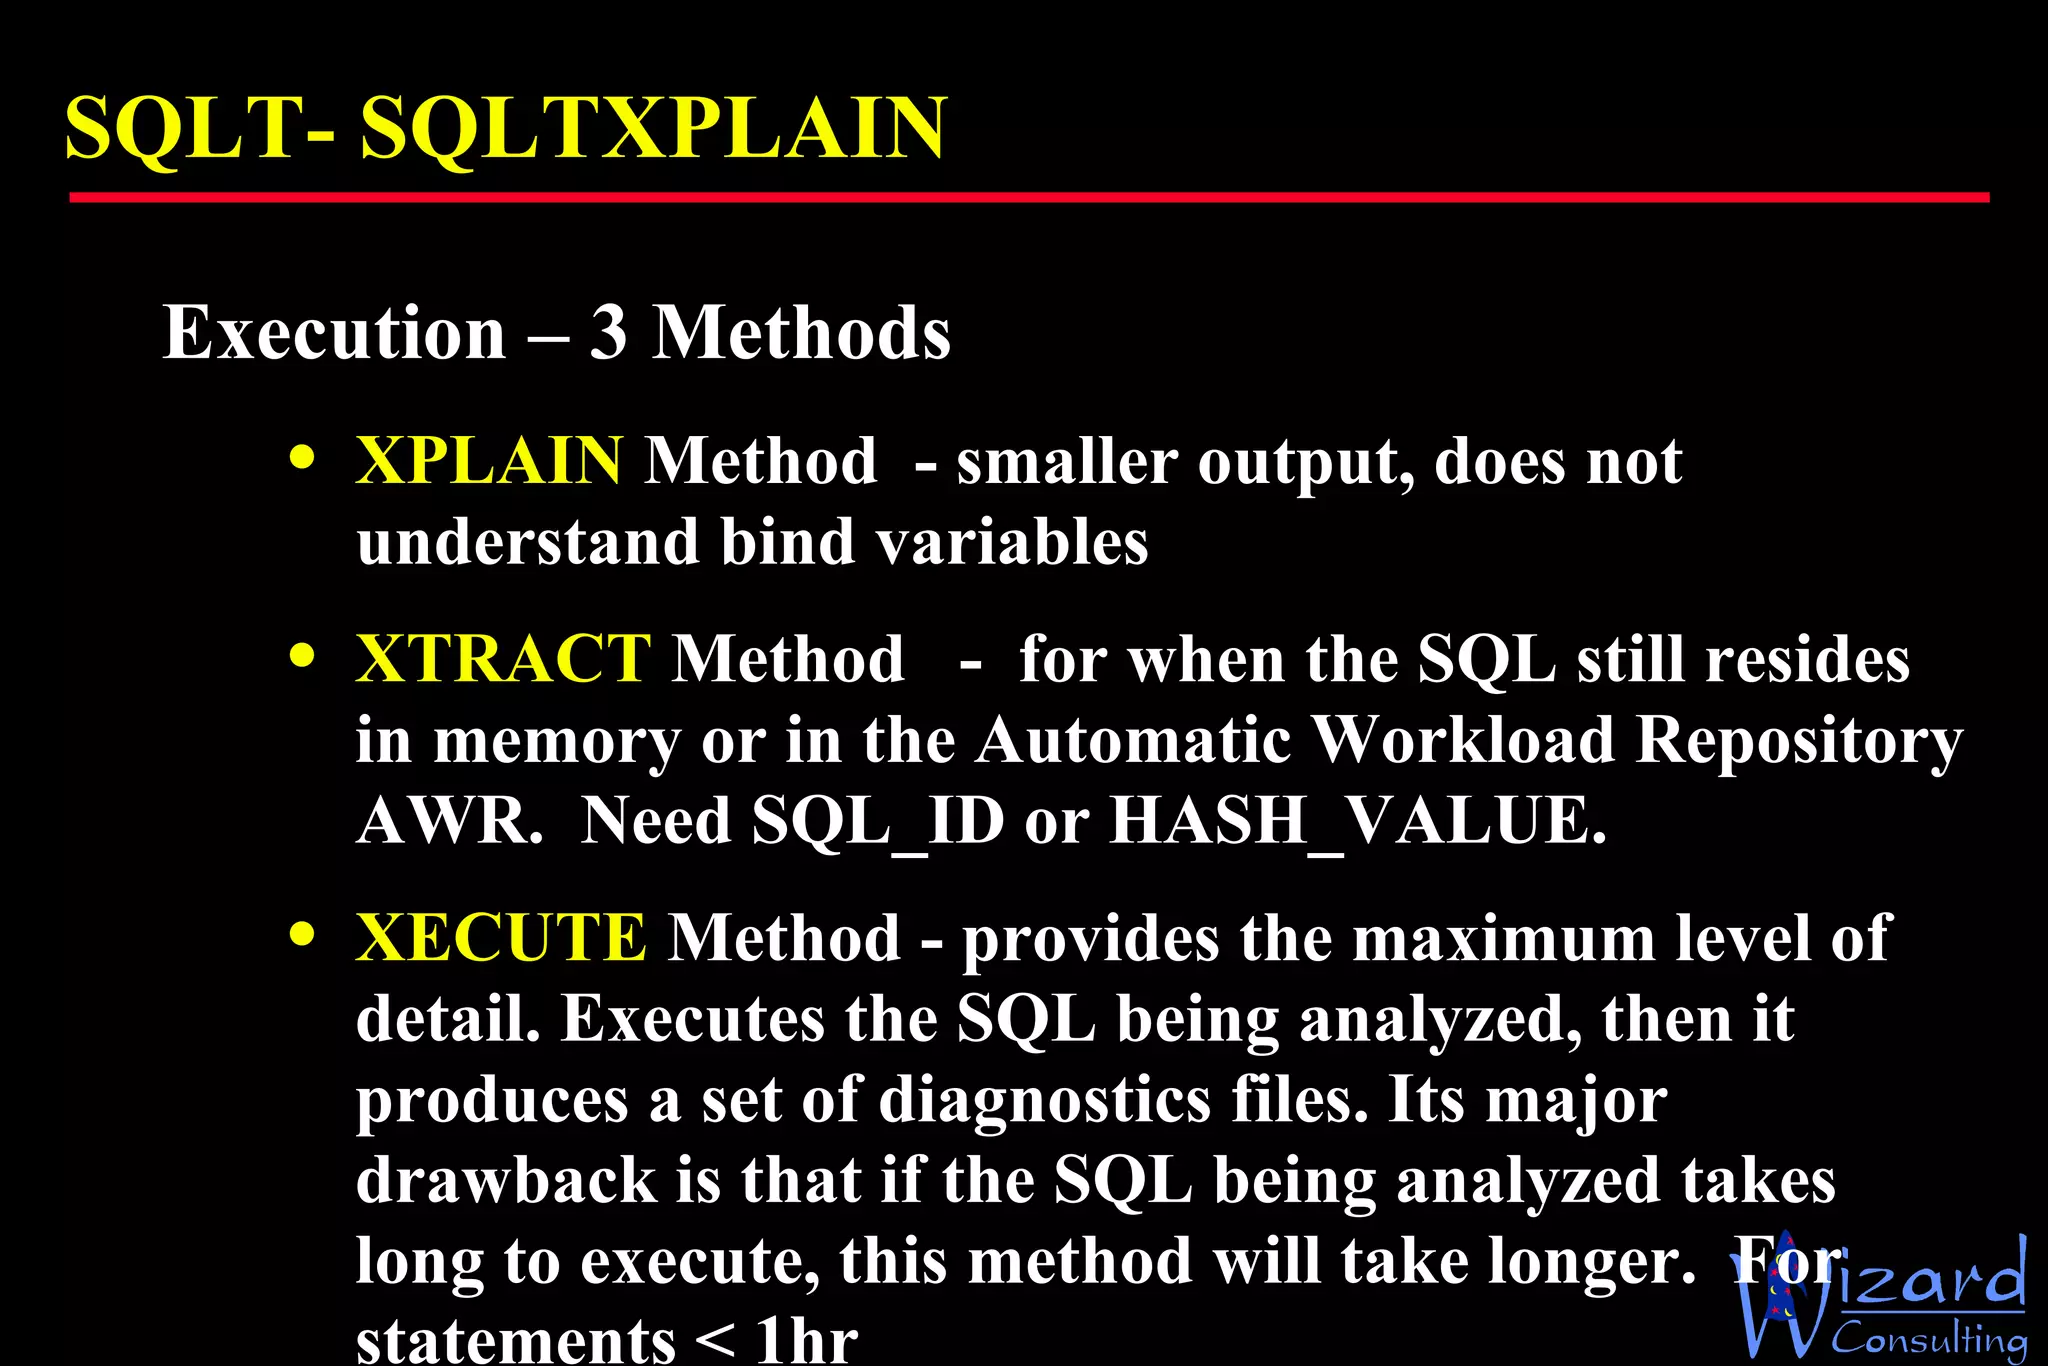
SQLT-  SQLTXPLAIN Execution – 3 Methods XPLAIN  Method  - smaller output, does not understand bind variables XTRACT  Method  -  for when the SQL still resides in memory or in the Automatic Workload Repository AWR.  Need SQL_ID or HASH_VALUE. XECUTE  Method - provides the maximum level of detail. Executes the SQL being analyzed, then it produces a set of diagnostics files. Its major drawback is that if the SQL being analyzed takes long to execute, this method will take longer.  For statements < 1hr
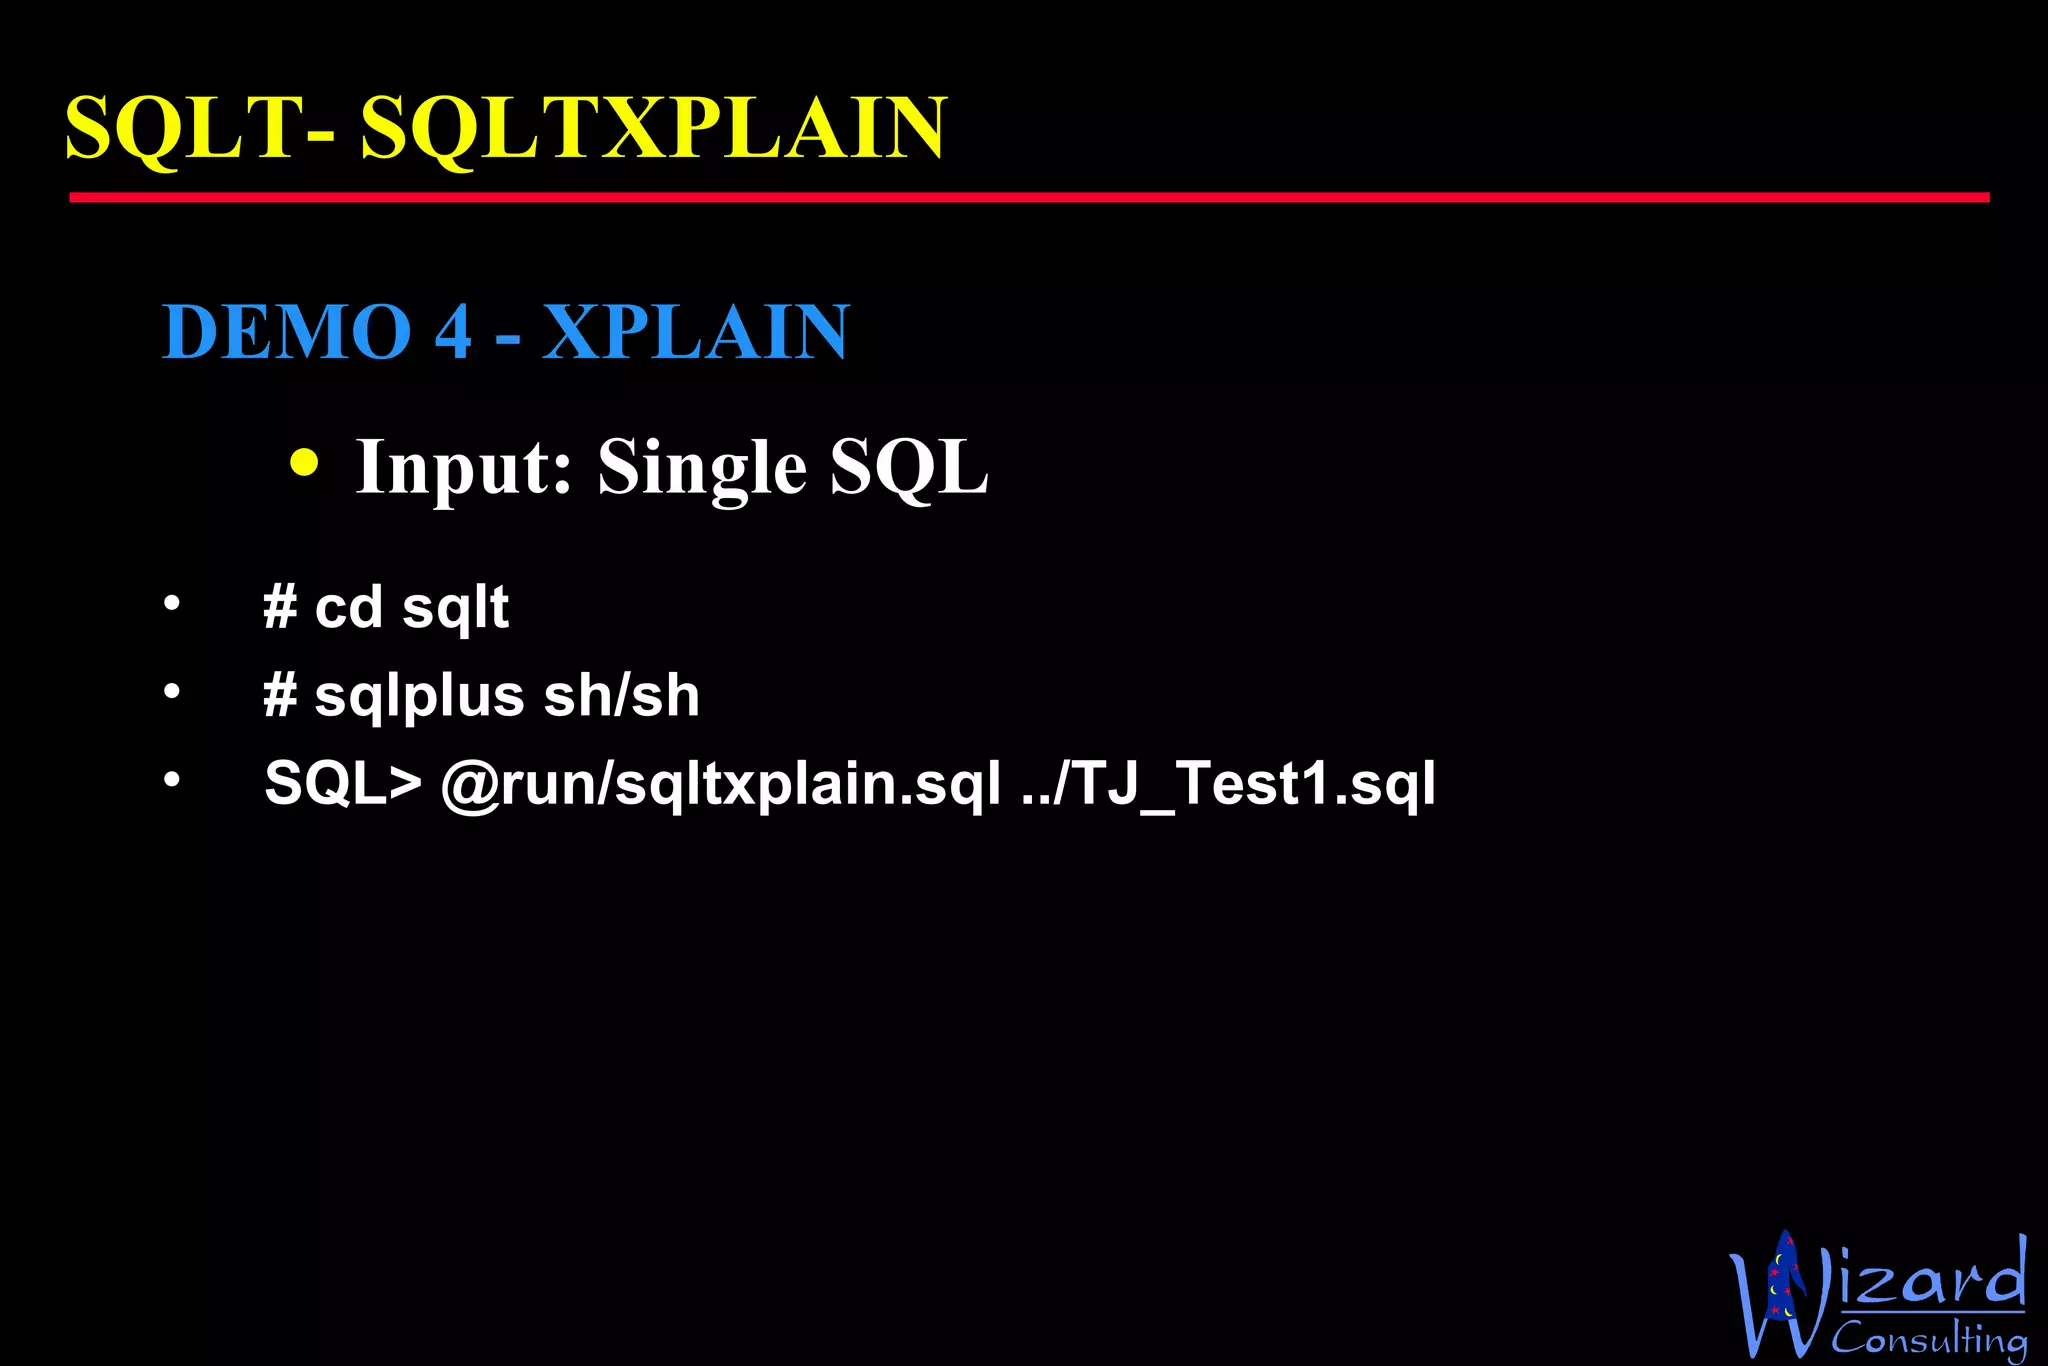
SQLT-  SQLTXPLAIN DEMO 4 - XPLAIN Input: Single SQL # cd sqlt # sqlplus sh/sh SQL> @run/sqltxplain.sql ../TJ_Test1.sql
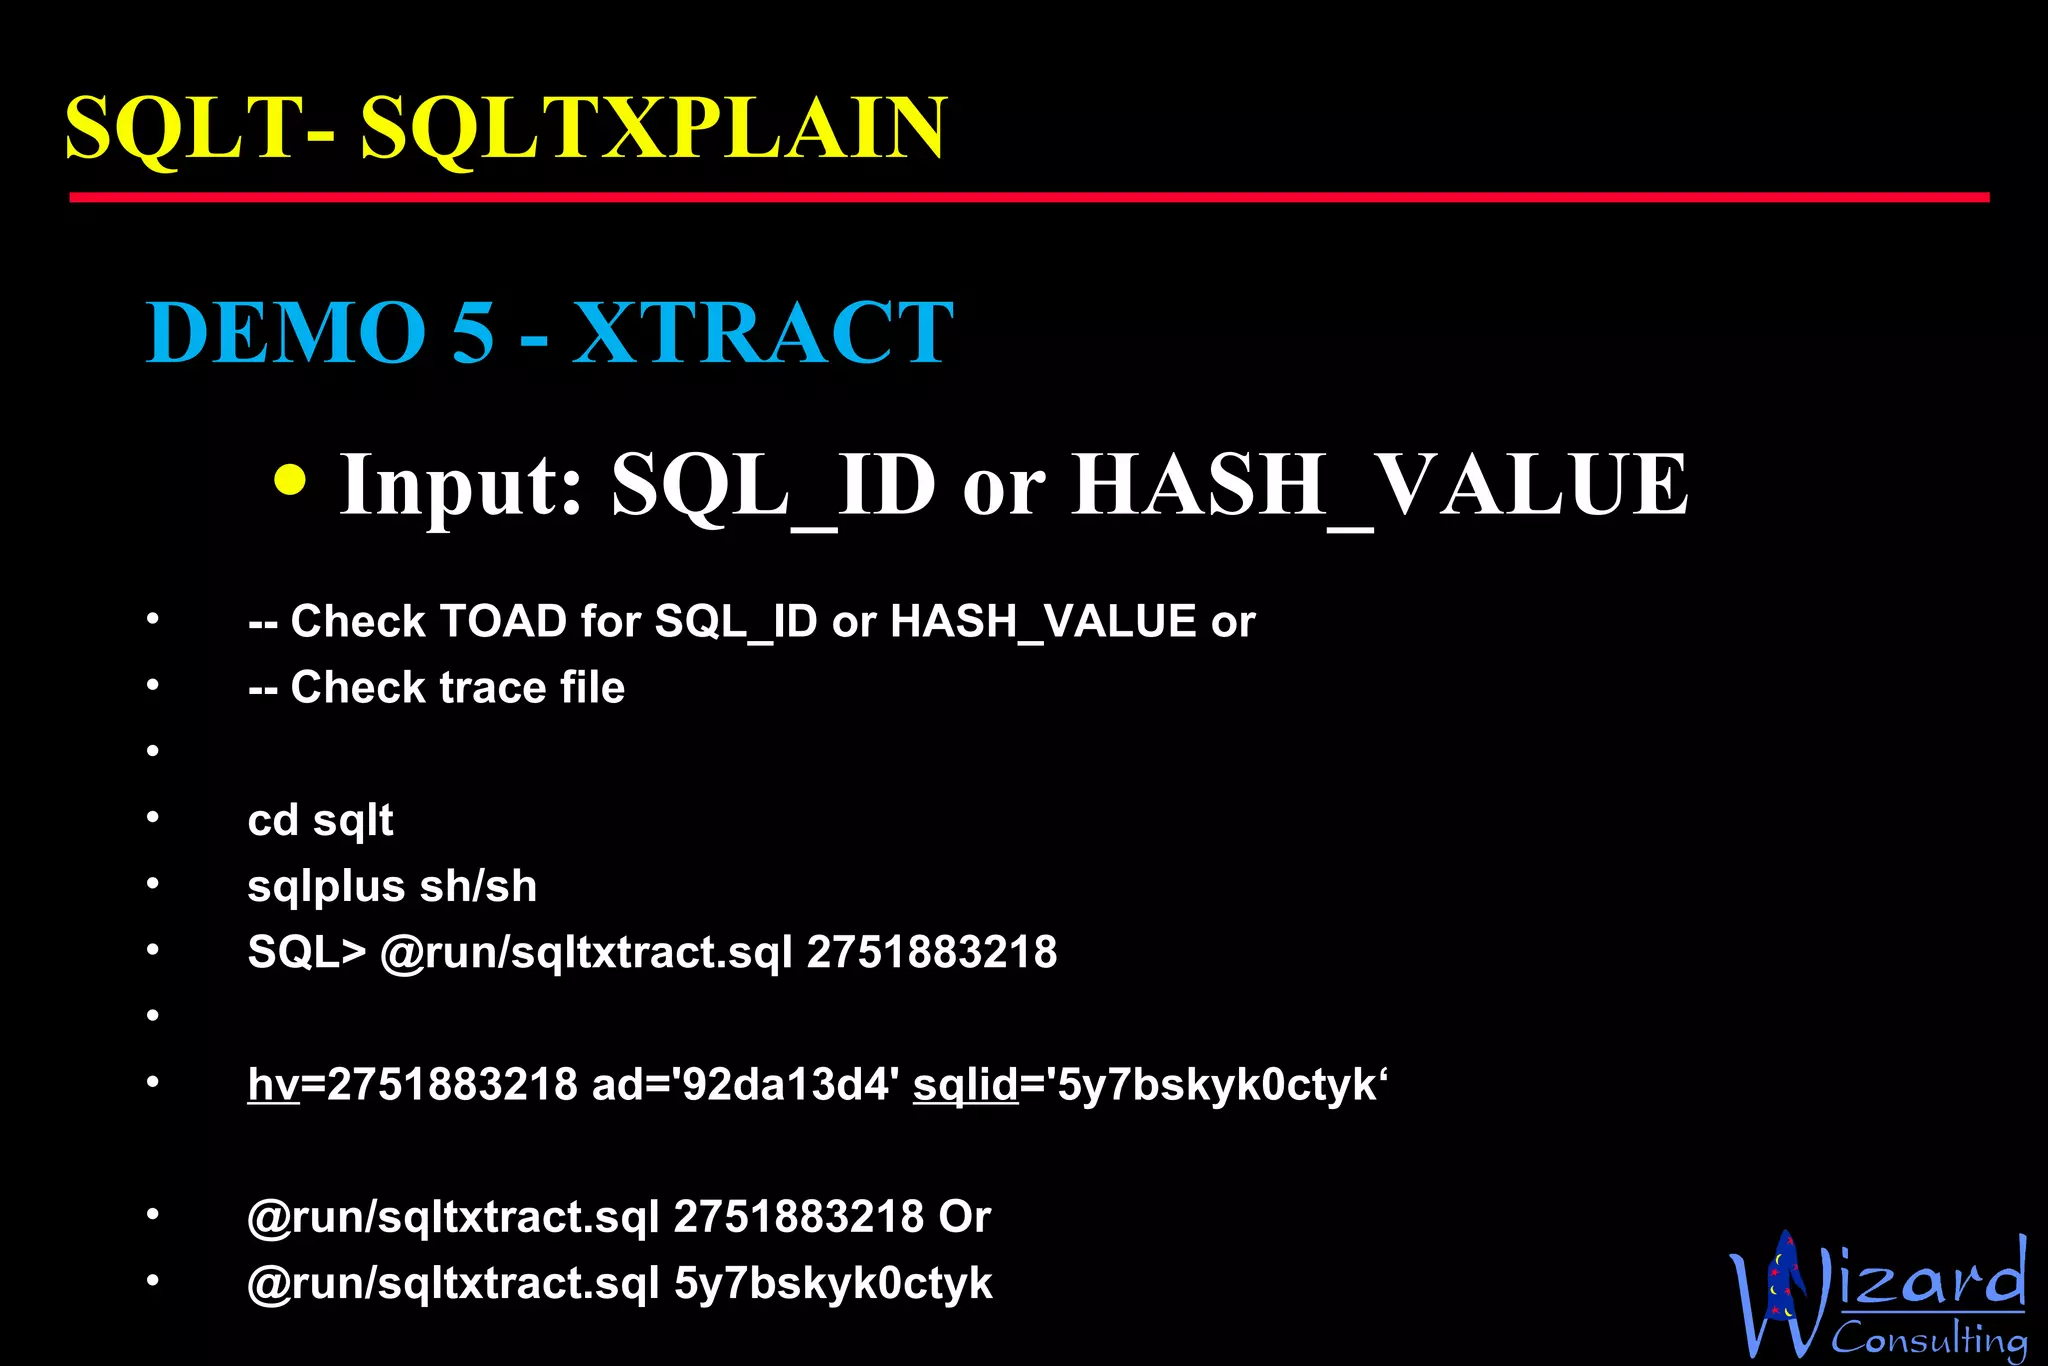
SQLT-  SQLTXPLAIN DEMO 5 - XTRACT Input: SQL_ID or HASH_VALUE -- Check TOAD for SQL_ID or HASH_VALUE or  -- Check trace file    cd sqlt sqlplus sh/sh SQL> @run/sqltxtract.sql 2751883218   hv =2751883218 ad='92da13d4'  sqlid ='5y7bskyk0ctyk‘ @run/sqltxtract.sql 2751883218 Or @run/sqltxtract.sql 5y7bskyk0ctyk
SQLT-  SQLTXPLAIN DEMO 6 - XECUTE Input: Single SQL statement cd sqlt sqlplus sh/sh SQL> @run/ sqltxecute.sql  ../TJ_Test1.sql
Oracle Active Report- Real-Time SQL Monitoring New in 11gR2 EM function via DBMS_SQLTUNE Extract session/SQL information and presents infomation in GUI/Adobe Flash Needs internet connection Good for database support.  Able to capture and encapsulate all the information in one HTML report. dbms_sqltune. report_sql_detail dbms_sqltune. report_sql_monitor .
Oracle Active Report- Real-Time SQL Monitoring DEMO 7 cd  “Active Report” sqlplus tjambu/tjambu SQL> @ report_sql_monitor.sql SQL> @ report_sql_detail.sql
Other Tools - TOAD TOAD functionalities Explain Plan customisation Explain Plan comparison Trace file browser Tkprof utility
Summary  There are different approaches to SQL tuning We covered some less known tools Which to choose depends on your particular situation Do try out some of the newer tools For feedback & discussion:  [email_address]
xxxxxxx XXX Xxx XXX XXX
Texas Memory Systems ,  http://www.superssd.com/whitepapers.htm http://www.texmemsys.com/files/whitepaper_opera.pdf Anand Tech, http://anandtech.com/storage/showdoc.aspx?i=3631   http://www.anandtech.com/storage/showdoc.aspx?i=3531&p=1   StorageSearch.com/SolidData,  http://www.storagesearch.com/soliddata-art2-comparisons.pdf   References & Acknowledgement
Session:  715  Title: Understanding Solid State Drives (SSD)  Technology for Databases, Presenter: Tony Jambu For feedback & discussion:  [email_address] Please fill in the evaluation form. What did we do to reduce the End of Fin year processing from 2days to 4 hours? ANSWER Select Star Mailing list http://groups.yahoo.com/group/Select_Star/   or email  [email_address]
 

Tony Jambu (obscure) tools of the trade for tuning oracle sq ls

  • 1.
    (Obscure) Tools ofthe Trade for Tuning Oracle SQLs [email_address] Tony Jambu Melbourne, Australia
  • 2.
    Agenda Tuning MethodologyGenerating Explain Plan & Tracing TRCSESS DBMS_XPLAN SQL*Plus and Autotrace TRCANLZR - Trace Analyzer SQLT - SQLTXPLAIN Oracle Active Report Other Tools
  • 3.
    Tuning Methodology Wheredo you start? In development or production? Do you have the volume of data? Proactive or Reactive ? Explain Plans only or database tracing? Explain Plan: Quick but is ‘best guess’ Need to validate changes
  • 4.
    Tuning Methodology Tracing:Numerous methods to trace Produces raw data from the execution Not practical for some very large data warehouse SQLs How At own session , other sessions or database level? Numerous ways of turning tracing on
  • 5.
    Tracing Various methodsInit.ora parameters alter session set event….. eg 10046, 10053, alter [session|system] set sql_trace=true; dbms_session.set_sql_trace(true), dbms_system.set_bool_param_in_session(...), dbms_system.set_sql_trace_in_session(...), dbms_support.start_trace, dbms_support.start_trace_in_session(...), dbms_system.set_ev(…), ***dbms_monitor.* - Oracle 10g and up. Replaces DBMS_SUPPORT oradebug session_event …
  • 6.
    Tracing Add nameidentifier to trace file alter session set tracefile_identifier ='MyTrc_'; Session Information are useful for end-to-end tracing and can be set with Machine : The name of your machine Module : The application module name Action : What you are doing eg ‘Before Transforming data’ or ‘Aggregating base data’ Service : The service name Client ID : Either logon id or set with dbms_session.set_identifier(‘A Name’) – Case sensitive
  • 7.
    Tracing Trace EnablingNew : DBMS_MONITOR.CLIENT_ID_ TRACE _ENABLE('account_update') Means, auto enable tracing for all sessions with the identifier ‘account_update’ To disable: DBMS_MONITOR.CLIENT_ID_ TRACE _DISABLE('account_update');
  • 8.
    Tracing Statistics EnablingNew : DBMS_MONITOR.CLIENT_ID_ STAT _ENABLE('account_update') Enable stats gathering for Client_ID = ‘account_update’ To disable: DBMS_MONITOR.CLIENT_ID_ STAT _DISABLE('account_update'); Also possible for Service, Module & Action DBMS_MONITOR.SERV_MOD_ACT_STAT_DISABLE( service_name => 'ACCTG', module_name => 'GLEDGER', action_name => 'INSERT ITEM'); *** 10g
  • 9.
    TRCSESS Tkprof Onlyworks with one file at a time How to handle multiple files like PX files? trcsess Oracle utility that aggregates/consolidates and format numerous trace files into a single file Trcsess output= output_file_name ] [session= session_id ] [clientid= client_id ] [service= service_name ] [action= action_name ] [module= module_name ] [ trace_files ]
  • 10.
    SQL&Plus and AUTOTRACEAn SQL*Plus command Usage: set autot[race] {off | on | trace[only]} [exp[lain]] [stat[istics]] ON – returns results Traceonly – Do not return results Exp – Shows execution plan Stat – Gathers execution stats
  • 11.
    SQL&Plus and AUTOTRACEset autotrace on : Shows the execution plan as well as statistics of the statement. set autotrace on explain: Displays the execution plan only. set autotrace on statistics : Displays the statistics only. set autotrace traceonly : Displays the execution plan and the statistics (as set autotrace on does), but doesn't print a query's result. set autotrace off : Disables all autotrace
  • 12.
    SQL&Plus and AUTOTRACEPre-requisite: PLAN_TABLE. Be careful that you have your own copy of the plan_table and is the latest version in $ORACLE_HOME/rdbms/admin/utlxplan.sql In 11g, no need as there is a public Synonym to SYS.PLAN_TABLE$ . Pre-requisite: PLUSTRACE Role Users will require the PLUSTRACE role ($ORACLE_HOME/sqlplus/admin/plustrce.sql)
  • 13.
    SQL&Plus and AUTOTRACEDEMO_1 (not for dba) cd Trace Analyzer sqlplus tjambu/tjambu set autotrace trace exp @TJ_Test1a.sql set autotrace trace exp STAT @TJ_Test1a.sql -See diff between ON and STATS
  • 14.
    DBMS_XPLAN DBMS_XPLAN isan explain plan formatter Has 4 Procedures DISPLAY – Displays the explain plan from the Plan Table DISPLAY_CURSOR – Displays the Execution plan of a SQL in the cursor cache DISPLAY_AWR – Displays the Execution plan for a SQL_ID in the AWR DISPLAY_SQLSET – Displays the Execution plan for statement in a SQL tuning set
  • 15.
    DBMS_XPLAN dbms_xplan.display (ExplainPlan) Usage: SELECT * FROM table(DBMS_XPLAN.DISPLAY); Usage Accepts 3 parameters Table_Name - Name of plan table, default value 'PLAN_TABLE'. Statement_ID - Statement id of the plan to be displayed, default value NULL. Format - Level of detail displayed, default value 'TYPICAL'. Also 'BASIC', 'ALL', 'SERIAL‘.
  • 16.
    DBMS_XPLAN DBMS_XPLAN.DISPLAY – Examples select * from table(dbms_xplan.display ('PLAN_TABLE', 'TJ2' , 'BASIC ')); select * from table(dbms_xplan.display ('PLAN_TABLE', 'TJ2' , 'SERIAL ')); select * from table(dbms_xplan.display ('PLAN_TABLE', 'TJ2' , 'TYPICAL ')); select * from table(dbms_xplan.display ('PLAN_TABLE', 'TJ2' , 'ALL ')); SELECT tf.* FROM DBA_HIST_SQLTEXT ht, table (DBMS_XPLAN. DISPLAY_AWR (ht.sql_id,null, null, 'ALL' )) tf WHERE ht.sql_text like ‘% EV_INTERMEDIATE %’;
  • 17.
    DBMS_XPLAN DBMS_XPLAN.DISPLAY_CURSOR ( Execution Plan) - DEMO 2 Run with and without GATHER_PLAN_STATS hint SELECT * FROM TABLE ( DBMS_XPLAN.display_cursor (NULL, NULL, 'ALLSTATS LAST +peeked_binds') ); cd DBMS_XPLAN sqlplus sh/sh @demo_dbms_xplan1.sql @demo_dbms_xplan2.sql
  • 18.
    TRCA - TRACE ANALYZER Tool from Oracle Support Center of Expertise Available from Metalink – Doc ID: 224270.1 Input : One or more trace file from 10046 Output : Diagnostics report in HTML and Text format. Excellent for tuning SQLS Contains information about all objects accesses and their statistics NOTE : Developers now have access to trace files on server!
  • 19.
    TRCA - TRACE ANALYZER Usage Only need one file ( trcanlzr.sql) to run from client 4 ways Analyzing one trace on the same system where it was generated. sqlplus user/passwd @trcanlzr file.trc Analyzing a set of related traces (PX) on the same system where they were generated. sqlplus user/passwd @trcanlzr TraceFiles.lis Analyzing one trace on a different system (target) to the one where it was generated (source). Analyzing a set of related traces (PX) on a different system (target) to where they were generated (source)
  • 20.
    TRCA - TRACE ANALYZER DEMO 3 Only need one SQL file to run from client cd trca/run sqlplus sh/sh @trcanlzr.sql TraceFiles.lis
  • 21.
    SQLT- SQLTXPLAINTool from Oracle Support Center of Expertise Available from Metalink – Doc ID: 215187.1 Input : Single SQL statement, SQL_ID or HASH_VALUE Output : Diagnostics report in HTML and Text format reporting on execution plans, CBO statistics, schema objects metadata, performance statistics, configuration parameters, and similar elements Can utilise Oracle Diagnostic and the Oracle Tuning Packs Understands database links
  • 22.
    SQLT- SQLTXPLAINExecution – 3 Methods XPLAIN Method - smaller output, does not understand bind variables XTRACT Method - for when the SQL still resides in memory or in the Automatic Workload Repository AWR. Need SQL_ID or HASH_VALUE. XECUTE Method - provides the maximum level of detail. Executes the SQL being analyzed, then it produces a set of diagnostics files. Its major drawback is that if the SQL being analyzed takes long to execute, this method will take longer. For statements < 1hr
  • 23.
    SQLT- SQLTXPLAINDEMO 4 - XPLAIN Input: Single SQL # cd sqlt # sqlplus sh/sh SQL> @run/sqltxplain.sql ../TJ_Test1.sql
  • 24.
    SQLT- SQLTXPLAINDEMO 5 - XTRACT Input: SQL_ID or HASH_VALUE -- Check TOAD for SQL_ID or HASH_VALUE or -- Check trace file   cd sqlt sqlplus sh/sh SQL> @run/sqltxtract.sql 2751883218   hv =2751883218 ad='92da13d4' sqlid ='5y7bskyk0ctyk‘ @run/sqltxtract.sql 2751883218 Or @run/sqltxtract.sql 5y7bskyk0ctyk
  • 25.
    SQLT- SQLTXPLAINDEMO 6 - XECUTE Input: Single SQL statement cd sqlt sqlplus sh/sh SQL> @run/ sqltxecute.sql ../TJ_Test1.sql
  • 26.
    Oracle Active Report-Real-Time SQL Monitoring New in 11gR2 EM function via DBMS_SQLTUNE Extract session/SQL information and presents infomation in GUI/Adobe Flash Needs internet connection Good for database support. Able to capture and encapsulate all the information in one HTML report. dbms_sqltune. report_sql_detail dbms_sqltune. report_sql_monitor .
  • 27.
    Oracle Active Report-Real-Time SQL Monitoring DEMO 7 cd “Active Report” sqlplus tjambu/tjambu SQL> @ report_sql_monitor.sql SQL> @ report_sql_detail.sql
  • 28.
    Other Tools -TOAD TOAD functionalities Explain Plan customisation Explain Plan comparison Trace file browser Tkprof utility
  • 29.
    Summary Thereare different approaches to SQL tuning We covered some less known tools Which to choose depends on your particular situation Do try out some of the newer tools For feedback & discussion: [email_address]
  • 30.
  • 31.
    Texas Memory Systems, http://www.superssd.com/whitepapers.htm http://www.texmemsys.com/files/whitepaper_opera.pdf Anand Tech, http://anandtech.com/storage/showdoc.aspx?i=3631 http://www.anandtech.com/storage/showdoc.aspx?i=3531&p=1 StorageSearch.com/SolidData, http://www.storagesearch.com/soliddata-art2-comparisons.pdf References & Acknowledgement
  • 32.
    Session: 715 Title: Understanding Solid State Drives (SSD) Technology for Databases, Presenter: Tony Jambu For feedback & discussion: [email_address] Please fill in the evaluation form. What did we do to reduce the End of Fin year processing from 2days to 4 hours? ANSWER Select Star Mailing list http://groups.yahoo.com/group/Select_Star/ or email [email_address]
  • 33.

Editor's Notes

  • #3 Who attended last years presentation?