The Basic Practiceof Statistics
Ninth Edition
David S. Moore
Purdue University
William I. Notz
The Ohio State University
6.
Senior Vice President,STEM: Daryl Fox
Program Director, Math, Statistics, Earth Sciences, and Environmental
Science: Andrew Dunaway
Program Manager: Sarah Seymour
Executive Content Development Manager, STEM: Debbie Hardin
Development Editor: David Dietz
Executive Project Manager, Content, STEM: Katrina Mangold
Director of Content, Math and Statistics: Daniel Lauve
Executive Media Editor: Catriona Kaplan
Associate Editor: Andy Newton
Assistant Editor: Justin Jones
Marketing Manager: Leah Christians
Marketing Assistant: Morgan Psiuk
Director of Content Management Enhancement: Tracey Kuehn
Senior Managing Editor: Lisa Kinne
Senior Content Project Manager: Edward Dionne
Project Manager: Heidi Allgair, SPi Global
Senior Workflow Project Manager: Paul Rohloff
Production Supervisor: Robert Cherry
Director of Design, Content Management: Diana Blume
Design Services Manager: Natasha Wolfe
Cover Design: Laura de Grasse
Interior Design: Vicki Tomaselli
Art Manager: Matthew McAdams
Director of Digital Production: Keri deManigold
BRIEF CONTENTS
Chapter 0Getting Started
Part I Exploring Data
EXPLORING DATA: Variables and Distributions
Chapter 1 Picturing Distributions with Graphs
Chapter 2 Describing Distributions with Numbers
Chapter 3 The Normal Distributions
EXPLORING DATA: Relationships
Chapter 4 Scatterplots and Correlation
Chapter 5 Regression
Chapter 6 Two-Way Tables*
Chapter 7 Exploring Data: Part I Review
Part II Producing Data
PRODUCING DATA
Chapter 8 Producing Data: Sampling
Chapter 9 Producing Data: Experiments
Chapter 10 Data Ethics*
Chapter 11 Producing Data: Part II Review
Part III From Data Production to Inference
PROBABILITY AND SAMPLING DISTRIBUTIONS
Chapter 12 Introducing Probability
9.
Chapter 13 GeneralRules of Probability*
Chapter 14 Binomial Distributions*
Chapter 15 Sampling Distributions
FOUNDATIONS OF INFERENCE
Chapter 16 Confidence Intervals: The Basics
Chapter 17 Tests of Significance: The Basics
Chapter 18 Inference in Practice
Chapter 19 From Data Production to Inference: Part III Review
Part IV Inference about Variables
QUANTITATIVE RESPONSE VARIABLE
Chapter 20 Inference about a Population Mean
Chapter 21 Comparing Two Means
CATEGORICAL RESPONSE VARIABLE
Chapter 22 Inference about a Population Proportion
Chapter 23 Comparing Two Proportions
Chapter 24 Inference about Variables: Part IV Review
Part V Inference about Relationships
INFERENCE ABOUT RELATIONSHIPS
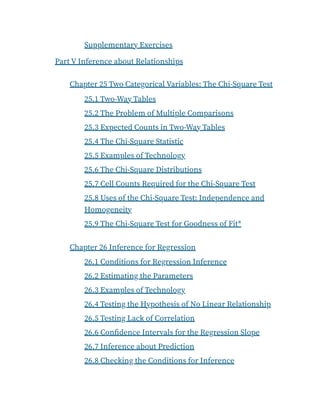
Chapter 25 Two Categorical Variables: The Chi-Square Test
Chapter 26 Inference for Regression
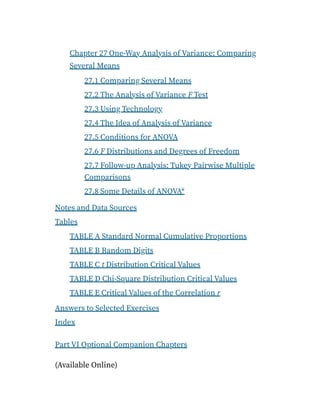
Chapter 27 One-Way Analysis of Variance: Comparing Several
Means
Part VI Optional Companion Chapters
(Available Online)
10.
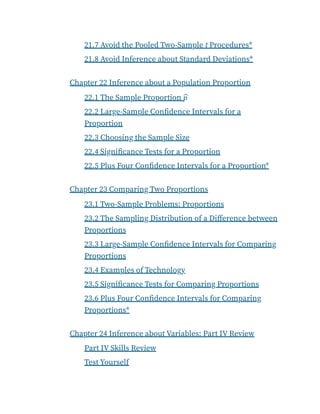
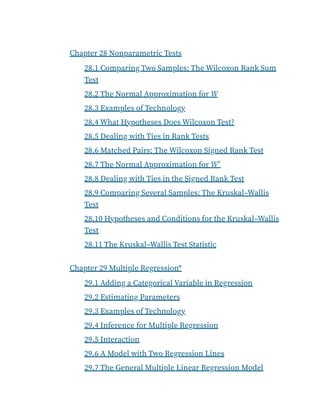
Chapter 28 NonparametricTests
Chapter 29 Multiple Regression*
Chapter 30 Two-Way Analysis of Variance
Chapter 31 Statistical Process Control
Chapter 32 Resampling: Permutation Tests and the Bootstrap
Starred material is optional and can be skipped without loss of continuity.
*
11.
CONTENTS
Why Did YouDo That?
Preface
Acknowledgments
About the Authors
Chapter 0 Getting Started
0.1 How the Data Were Obtained Matters
0.2 Always Look at the Data
0.3 Variation Is Everywhere
0.4 What Lies Ahead in This Book
Part I Exploring Data
Chapter 1 Picturing Distributions with Graphs
1.1 Individuals and Variables
1.2 Categorical Variables: Pie Charts and Bar Graphs
1.3 Quantitative Variables: Histograms
1.4 Interpreting Histograms
1.5 Quantitative Variables: Stemplots
1.6 Time Plots
12.
Chapter 2 DescribingDistributions with Numbers
2.1 Measuring Center: The Mean
2.2 Measuring Center: The Median
2.3 Comparing the Mean and the Median
2.4 Measuring Variability: The Quartiles
2.5 The Five-Number Summary and Boxplots
2.6 Spotting Suspected Outliers and Modified Boxplots*
2.7 Measuring Variability: The Standard Deviation
2.8 Choosing Measures of Center and Variability
2.9 Examples of Technology
2.10 Organizing a Statistical Problem
Chapter 3 The Normal Distributions
3.1 Density Curves
3.2 Describing Density Curves
3.3 Normal Distributions
3.4 The 68–95–99.7 Rule
3.5 The Standard Normal Distribution
3.6 Finding Normal Proportions
3.7 Using the Standard Normal Table
3.8 Finding a Value Given a Proportion
Chapter 4 Scatterplots and Correlation
13.
4.1 Explanatory andResponse Variables
4.2 Displaying Relationships: Scatterplots
4.3 Interpreting Scatterplots
4.4 Adding Categorical Variables to Scatterplots
4.5 Measuring Linear Association: Correlation
4.6 Facts about Correlation
Chapter 5 Regression
5.1 Regression Lines
5.2 The Least-Squares Regression Line
5.3 Examples of Technology
5.4 Facts about Least-Squares Regression
5.5 Residuals
5.6 Influential Observations
5.7 Cautions about Correlation and Regression
5.8 Association Does Not Imply Causation
5.9 Correlation, Prediction, and Big Data*
Chapter 6 Two-Way Tables*
6.1 Marginal Distributions
6.2 Conditional Distributions
6.3 Simpson’s Paradox
Chapter 7 Exploring Data: Part I Review
14.
Part I SkillsReview
Test Yourself
Supplementary Exercises
Online Data for Additional Analyses
Part II Producing Data
Chapter 8 Producing Data: Sampling
8.1 Population versus Sample
8.2 How to Sample Badly
8.3 Simple Random Samples
8.4 Trustworthiness of Inference from Samples
8.5 Other Sampling Designs
8.6 Cautions about Sample Surveys
8.7 The Impact of Technology
Chapter 9 Producing Data: Experiments
9.1 Observation Versus Experiment
9.2 Subjects, Factors, and Treatments
9.3 How to Experiment Badly
9.4 Randomized Comparative Experiments
9.5 The Logic of Randomized Comparative Experiments
9.6 Cautions About Experimentation
9.7 Matched Pairs and Other Block Designs
15.
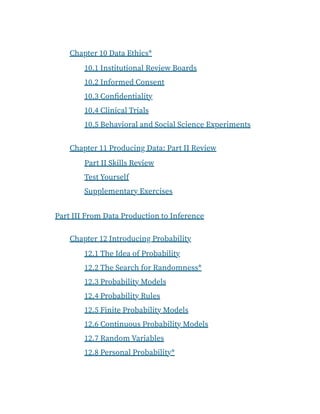
Chapter 10 DataEthics*
10.1 Institutional Review Boards
10.2 Informed Consent
10.3 Confidentiality
10.4 Clinical Trials
10.5 Behavioral and Social Science Experiments
Chapter 11 Producing Data: Part II Review
Part II Skills Review
Test Yourself
Supplementary Exercises
Part III From Data Production to Inference
Chapter 12 Introducing Probability
12.1 The Idea of Probability
12.2 The Search for Randomness*
12.3 Probability Models
12.4 Probability Rules
12.5 Finite Probability Models
12.6 Continuous Probability Models
12.7 Random Variables
12.8 Personal Probability*
16.
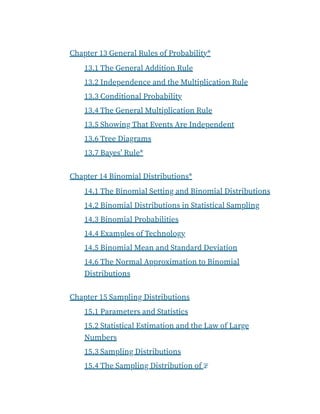
Chapter 13 GeneralRules of Probability*
13.1 The General Addition Rule
13.2 Independence and the Multiplication Rule
13.3 Conditional Probability
13.4 The General Multiplication Rule
13.5 Showing That Events Are Independent
13.6 Tree Diagrams
13.7 Bayes’ Rule*
Chapter 14 Binomial Distributions*
14.1 The Binomial Setting and Binomial Distributions
14.2 Binomial Distributions in Statistical Sampling
14.3 Binomial Probabilities
14.4 Examples of Technology
14.5 Binomial Mean and Standard Deviation
14.6 The Normal Approximation to Binomial
Distributions
Chapter 15 Sampling Distributions
15.1 Parameters and Statistics
15.2 Statistical Estimation and the Law of Large
Numbers
15.3 Sampling Distributions
15.4 The Sampling Distribution of x̄
17.
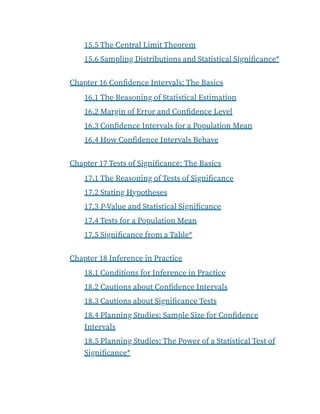
15.5 The CentralLimit Theorem
15.6 Sampling Distributions and Statistical Significance*
Chapter 16 Confidence Intervals: The Basics
16.1 The Reasoning of Statistical Estimation
16.2 Margin of Error and Confidence Level
16.3 Confidence Intervals for a Population Mean
16.4 How Confidence Intervals Behave
Chapter 17 Tests of Significance: The Basics
17.1 The Reasoning of Tests of Significance
17.2 Stating Hypotheses
17.3 P-Value and Statistical Significance
17.4 Tests for a Population Mean
17.5 Significance from a Table*
Chapter 18 Inference in Practice
18.1 Conditions for Inference in Practice
18.2 Cautions about Confidence Intervals
18.3 Cautions about Significance Tests
18.4 Planning Studies: Sample Size for Confidence
Intervals
18.5 Planning Studies: The Power of a Statistical Test of
Significance*
18.
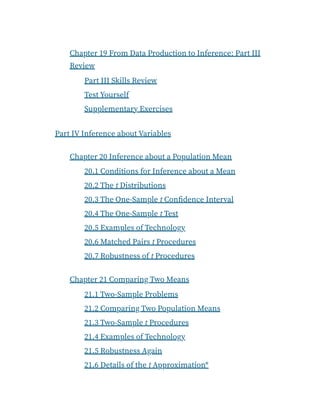
Chapter 19 FromData Production to Inference: Part III
Review
Part III Skills Review
Test Yourself
Supplementary Exercises
Part IV Inference about Variables
Chapter 20 Inference about a Population Mean
20.1 Conditions for Inference about a Mean
20.2 The t Distributions
20.3 The One-Sample t Confidence Interval
20.4 The One-Sample t Test
20.5 Examples of Technology
20.6 Matched Pairs t Procedures
20.7 Robustness of t Procedures
Chapter 21 Comparing Two Means
21.1 Two-Sample Problems
21.2 Comparing Two Population Means
21.3 Two-Sample t Procedures
21.4 Examples of Technology
21.5 Robustness Again
21.6 Details of the t Approximation*
19.
21.7 Avoid thePooled Two-Sample t Procedures*
21.8 Avoid Inference about Standard Deviations*
Chapter 22 Inference about a Population Proportion
22.1 The Sample Proportion p̂
22.2 Large-Sample Confidence Intervals for a
Proportion
22.3 Choosing the Sample Size
22.4 Significance Tests for a Proportion
22.5 Plus Four Confidence Intervals for a Proportion*
Chapter 23 Comparing Two Proportions
23.1 Two-Sample Problems: Proportions
23.2 The Sampling Distribution of a Difference between
Proportions
23.3 Large-Sample Confidence Intervals for Comparing
Proportions
23.4 Examples of Technology
23.5 Significance Tests for Comparing Proportions
23.6 Plus Four Confidence Intervals for Comparing
Proportions*
Chapter 24 Inference about Variables: Part IV Review
Part IV Skills Review
Test Yourself
20.
Supplementary Exercises
Part VInference about Relationships
Chapter 25 Two Categorical Variables: The Chi-Square Test
25.1 Two-Way Tables
25.2 The Problem of Multiple Comparisons
25.3 Expected Counts in Two-Way Tables
25.4 The Chi-Square Statistic
25.5 Examples of Technology
25.6 The Chi-Square Distributions
25.7 Cell Counts Required for the Chi-Square Test
25.8 Uses of the Chi-Square Test: Independence and
Homogeneity
25.9 The Chi-Square Test for Goodness of Fit*
Chapter 26 Inference for Regression
26.1 Conditions for Regression Inference
26.2 Estimating the Parameters
26.3 Examples of Technology
26.4 Testing the Hypothesis of No Linear Relationship
26.5 Testing Lack of Correlation
26.6 Confidence Intervals for the Regression Slope
26.7 Inference about Prediction
26.8 Checking the Conditions for Inference
21.
Chapter 27 One-WayAnalysis of Variance: Comparing
Several Means
27.1 Comparing Several Means
27.2 The Analysis of Variance F Test
27.3 Using Technology
27.4 The Idea of Analysis of Variance
27.5 Conditions for ANOVA
27.6 F Distributions and Degrees of Freedom
27.7 Follow-up Analysis: Tukey Pairwise Multiple
Comparisons
27.8 Some Details of ANOVA*
Notes and Data Sources
Tables
TABLE A Standard Normal Cumulative Proportions
TABLE B Random Digits
TABLE C t Distribution Critical Values
TABLE D Chi-Square Distribution Critical Values
TABLE E Critical Values of the Correlation r
Answers to Selected Exercises
Index
Part VI Optional Companion Chapters
(Available Online)
22.
Chapter 28 NonparametricTests
28.1 Comparing Two Samples: The Wilcoxon Rank Sum
Test
28.2 The Normal Approximation for W
28.3 Examples of Technology
28.4 What Hypotheses Does Wilcoxon Test?
28.5 Dealing with Ties in Rank Tests
28.6 Matched Pairs: The Wilcoxon Signed Rank Test
28.7 The Normal Approximation for W
28.8 Dealing with Ties in the Signed Rank Test
28.9 Comparing Several Samples: The Kruskal–Wallis
Test
28.10 Hypotheses and Conditions for the Kruskal–Wallis
Test
28.11 The Kruskal–Wallis Test Statistic
Chapter 29 Multiple Regression*
29.1 Adding a Categorical Variable in Regression
29.2 Estimating Parameters
29.3 Examples of Technology
29.4 Inference for Multiple Regression
29.5 Interaction
29.6 A Model with Two Regression Lines
29.7 The General Multiple Linear Regression Model
+
23.
29.8 Correlations betweenExplanatory Variables
29.9 A Case Study for Multiple Regression
29.10 Inference for Regression Parameters
29.11 Checking the Conditions for Inference
Chapter 30 Two-Way Analysis of Variance
30.1 Beyond One-Way ANOVA
30.2 Two-Way ANOVA: Conditions, Main Effects, and
Interaction
30.3 Inference for Two-Way ANOVA
30.4 Some Details of Two-Way ANOVA*
Chapter 31 Statistical Process Control
31.1 Processes
31.2 Describing Processes
31.3 The Idea of Statistical Process Control
31.4 x Charts for Process Monitoring
31.5 s Charts for Process Monitoring
31.6 Using Control Charts
31.7 Setting Up Control Charts
31.8 Comments on Statistical Control
31.9 Don’t Confuse Control with Capability
31.10 Control Charts for Sample Proportions
31.11 Control Limits for p Charts
¯
24.
Chapter 32 Resampling:Permutation Tests and the
Bootstrap
32.1 Randomization in Experiments as a Basis for
Inference
32.2 Permutation Tests for Two Treatments with
Software
32.3 Generating Bootstrap Samples
32.4 Bootstrap Standard Errors and Confidence
Intervals
Starred material is optional and can be skipped without loss of continuity.
*
25.
WHY DID YOUDO THAT?
The Authors Answer Questions about The Basic
Practice of Statistics
Welcome to the ninth edition of The Basic Practice of Statistics. As the
title suggests, this text provides an introduction to the practice of
statistics that aims to equip students to carry out common statistical
procedures and to follow statistical reasoning in their fields of study
and in their future employment.
There is no single best way to organize our presentation of statistics
to beginners. That said, our choices reflect thinking about both
content and pedagogy. Here are comments on several frequently
asked questions about the order and selection of material in The
Basic Practice of Statistics.
Why Did You Write The Basic Practice of
Statistics?
Several factors influenced the writing of The Basic Practice of
Statistics. Easy-to-use statistical software with graphical tools made it
possible for students to explore and analyze data on their own.
Statistics educators recognized that actually doing statistics—
exploring data, analyzing data, thinking about what the data are
26.
telling us, andassessing the validity of the conclusions we make
from data—is an effective way to learn statistics. Teachers also
recognized the importance of using real data from actual studies to
reinforce the fact that statistics is invaluable for answering real-
world questions. Finally, an introductory course in statistics should
expose students to how statistics is actually practiced by
researchers. At the time of the writing of the first edition, few, if any,
textbooks for courses intended for students with only college
algebra as the mathematics prerequisite incorporated these ideas.
With this in mind, The Basic Practice of Statistics was designed to
reflect the actual practice of statistics, where data analysis and
design of data production join with probability-based inference to
form a coherent science of data. The Basic Practice of Statistics was
also designed to be accessible to college and university students with
limited quantitative background—just “algebra” in the sense of being
able to read and use simple equations.
Why Should I Use The Basic Practice of
Statistics to Teach an Introductory
Statistics Course?
The Basic Practice of Statistics is based on three principles: balanced
content, experience with data, and the importance of ideas. These
principles are widely accepted by statisticians concerned about
teaching and are directly connected to and reflected by the themes
27.
of the CollegeReport of the Guidelines in Assessment and
Instruction for Statistics Education (GAISE) Project.
The GAISE guidelines include six recommendations for introductory
statistics. The content, coverage, and features of The Basic Practice of
Statistics are closely aligned to these recommendations:
1. Teach statistical thinking.
Teach statistics as an investigative process of problem solving and
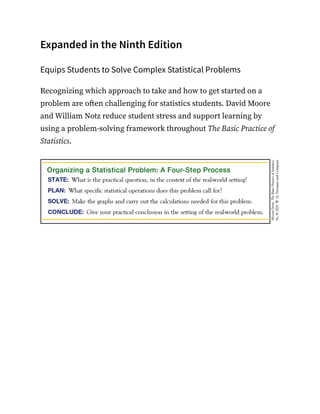
decision making. In The Basic Practice of Statistics, we present a
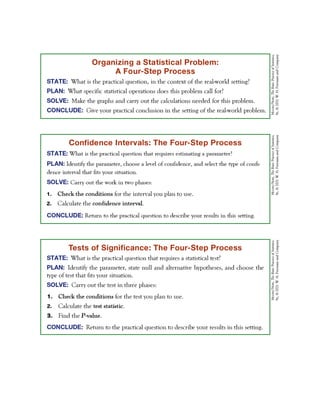
four-step process for solving statistical problems. This begins
by stating the practical question to be answered in the
context of a real-world setting and ends with a practical
conclusion, often a decision to be made, in the setting of the
real-world problem. The process is illustrated in the text by
revisiting data from a study in a series of examples or
exercises. Different aspects of the data are investigated in
different examples and exercises, with the ultimate goal of
making some decision based on what has been learned.
Give students experience with multivariable thinking. The Basic
Practice of Statistics exposes students to multivariate thinking
early in the book. Chapters 4, 5, and 6 introduce students to
methods for exploring bivariate data. In Chapter 7, we
include online data with many variables, inviting students to
explore aspects of these data. In Chapter 9, we discuss the
importance of identifying the many variables that can affect
28.
a response andincluding them in the design of an
experiment and the interpretation of the results. In Part V,
we introduce students to formal methods of inference for
bivariate data, and in the online supplemental chapters, we
discuss multiple regression, two-way ANOVA, and statistical
process control.
2. Focus on conceptual understanding. A first course in statistics
introduces many skills, from making a stemplot and calculating
a correlation to choosing and carrying out a significance test. In
practice (even if not always in the course), calculations and
graphs are automated. Moreover, anyone who makes serious
use of statistics will need some specific procedures not taught in
their college statistics course. The Basic Practice of Statistics,
therefore, emphasizes conceptual understanding by making
clear the larger patterns and big ideas of statistics—not in the
abstract but in the context of learning specific skills and
working with specific data. Many of the big ideas are
summarized in graphical outlines. Three of the most useful of
these appear opposite the title page. Formulas without guiding
principles do students little good once the final exam is past, so
it is worth the time to slow down a bit and explain the ideas.
3. Integrate real data with a context and a purpose. The study of
statistics is supposed to help students work with data in their
varied academic disciplines and in their unpredictable later
employment. Students learn to work with data by working with
29.
data. The BasicPractice of Statistics is full of data from many
fields of study and from everyday life. Data are more than mere
numbers: they are numbers with a context that should play a
role in making sense of the numbers and in stating conclusions.
Examples and exercises in The Basic Practice of Statistics, though
intended for beginners, use real data and give enough
background to allow students to consider the meaning of their
calculations.
4. Foster active learning. Fostering active learning is the business of
the teacher, though an emphasis on working with data helps. To
this end, we have created interactive applets to our
specifications that are available online. These are designed
primarily to help in learning statistics rather than in doing
statistics. We suggest using selected applets for classroom
demonstrations even if you do not ask students to work with
them. The Correlation and Regression, Confidence Intervals,
and P-Value of a Test of Significance applets, for example,
convey core ideas more clearly than any amount of chalk and
talk.
For each chapter (except the review chapters), web exercises are
provided online. Our intent is to take advantage of the fact that
most undergraduates are web savvy. These exercises require
students to search the web for either data or statistical examples
and then evaluate what they find. Teachers can use these as
classroom activities or assign them as homework projects.
30.
5. Use technologyto explore concepts and analyze data. Automating
calculations increases students’ ability to complete problems,
reduces their frustration, and helps them concentrate on ideas
and problem recognition rather than mechanics. At a
minimum, students should have a “two-variable statistics”
calculator with functions for correlation and the least-squares
regression line as well as for the mean and standard deviation.
Many instructors will take advantage of more elaborate
technology, as ASA/MAA and GAISE recommend. And many
students who don’t use technology in their college statistics
course will find themselves using (for example) Excel on the
job. The Basic Practice of Statistics does not assume or require use
of software except in Part V, where the work is otherwise too
tedious. It does accommodate software use and provides
students with knowledge that will enable them to read and use
output from almost any source. There are regular “Examples of
Technology” sections throughout the text. Each of these
sections displays and comments on output from the same three
technologies, representing graphing calculators (the Texas
Instruments TI-83 or TI-84), spreadsheets (Microsoft Excel), and
statistical software (JMP, Minitab, R, and CrunchIt!). The output
always concerns one of the main teaching examples so that
students can compare text and output.
6. Use assessments to improve and evaluate student learning. Within
chapters, a few “Apply Your Knowledge” exercises follow each
31.
new idea orskill for a quick check of basic mastery—and also to
mark off digestible bites of material. Each of the first four parts
of the book ends with a review chapter that includes a point-by-
point outline of skills learned, problems students can use to test
themselves, and several supplementary exercises. (Instructors
can choose to cover any or none of the chapters in Part V, so
each of these chapters includes a skills outline.) The review
chapters present supplemental exercises without the “I just
studied that” context, thus asking for another level of learning.
We think it is helpful to assign some supplemental exercises.
Many instructors will find that the review chapters appear at the
right points for pre-exam review. Students can use the “Test
Yourself” questions to review, self-assess, and prepare for
exams. In addition, assessment materials in the form of a test
bank and quizzes are available online.
Why Did You Choose to Order Topics as
Listed in the Book?
There are good pedagogical reasons for beginning with data analysis
(Chapters 1 through 7), then moving to data production (Chapters 8
through 11), and then to probability and inference (Chapters 12
through 27). In studying data analysis, students learn useful skills
immediately and get over some of their fear of statistics. Data
analytics is much in the media these days, and by discussing data
analysis, instructors can link the course material to the current
32.
interest in dataanalytics. Data analysis is a necessary preliminary to
inference in practice because inference requires clean data.
Designed data production is the surest foundation for inference, and
the deliberate use of chance in random sampling and randomized
comparative experiments motivates the study of probability in a
course that emphasizes data-oriented statistics. The Basic Practice of
Statistics gives a full presentation of basic probability and inference
(16 of the 27 chapters in the printed text) but places it in the context
of statistics as a whole.
33.
Why Does theDistinction between
Population and Sample Not Appear in
Part I?
There is more to statistics than inference. In fact, statistical
inference is appropriate only in rather special circumstances. The
chapters in Part I present tools and tactics for describing data—any
data. These tools and tactics do not depend on the idea of inference
from sample to population. Many data sets in these chapters (for
example, the several sets of data about the 50 states) do not lend
themselves to inference because they represent an entire
population. Likewise, many modern big data sets are also viewed as
information about an entire population, for which formal inference
may not be appropriate. John Tukey of Bell Labs and Princeton, the
philosopher of modern data analysis, insisted that the population–
sample distinction be avoided when it is not relevant. He used the
word batch for data sets in general. We see no need for a special
word, but we think Tukey was right.
Why Not Begin with Data Production?
We prefer to begin with data exploration (Part I), as most students
will use statistics mainly in settings other than planned research
studies in their future employment. We place the design of data
production (Part II) after data analysis to emphasize that data-
analytic techniques apply to any data. However, it is equally
34.
reasonable to beginwith data production; the natural flow of a
planned study is from design to data analysis to inference. Because
instructors have strong and differing opinions on this question,
these two topics are now the first two parts of the book, with the text
written so that it may be started with either Part I or Part II while
maintaining the continuity of the material.
Another reason for beginning with data exploration is to give
students experience exploring data and thinking about how to
interpret what they discover. This experience provides a context for
how data production affects the reliability of conclusions one might
draw from data.
35.
Why Do NormalDistributions Appear
in Part I?
Density curves such as the Normal curves are just another tool to
describe the distribution of a quantitative variable, along with
stemplots, histograms, and boxplots. Professional statistical
software offers to make density curves from data just as it offers
histograms. We prefer not to suggest that this material is essentially
tied to probability, as the traditional order does. And we find it
helpful to break up the indigestible lump of probability that troubles
students so much. Meeting Normal distributions early does this and
strengthens the “probability distributions are like data distributions”
way of approaching probability when we get there.
Why Not Delay Correlation and
Regression Until Late in the Course, as
Was Traditional?
The Basic Practice of Statistics begins by offering experience working
with data and gives a conceptual structure for this
nonmathematical, but essential, part of statistics. Students profit
from more experience with data early and from seeing the
conceptual structure worked out in relationships among variables as
well as in describing single-variable data. Correlation and least-
squares regression are very important descriptive tools and are
36.
often used insettings where there is no population–sample
distinction, such as studies of all of a firm’s employees. Perhaps
most importantly, The Basic Practice of Statistics asks students to think
about what kind of relationship lies behind the data (confounding,
lurking variables, association not implying causation, and so on)
without overwhelming them with the demands of formal inference
methods. Inference in the correlation and regression setting is a bit
complex, demands software, and often comes right at the end of the
course. We find that delaying all mention of correlation and
regression to that point often means that students don’t master the
basic uses and properties of these methods. We consider Chapters 4
and 5 (correlation and regression) essential and Chapter 26
(regression inference) optional.
Why Use the z Procedures for a
Population Mean to Introduce the
Reasoning of Inference?
This is a pedagogical issue, not a question of statistics in practice.
The two most popular choices for introducing inference are z for a
mean and z for a proportion. (Another option is resampling and
permutation tests. We have included material on these topics but
have not used them to introduce inference.)
We find z for means quite accessible to students. Positively, we can
say up front that we are going to explore the reasoning of inference
37.
in the overlysimple setting described in the box on page 367 titled
“Simple Conditions for Inference about a Mean.” As this box
suggests, assuming an exactly Normal population and a true simple
random sample are as unrealistic as known s. All the issues of
practice—robustness against lack of Normality and application when
the data aren’t an SRS as well as the need to estimate s—are put off
until, with the reasoning in hand, we discuss the practically useful t
procedures. This separation of initial reasoning from messier
practice works well.
Negatively, starting with inference for p introduces many side issues:
no exact Normal sampling distribution but a Normal approximation
to a discrete distribution; use of p̂ in both the numerator and
denominator of the test statistic to estimate both the parameter p
and p̂’s own standard deviation; loss of the direct link between test
and confidence interval; and the need to avoid small and moderate
sample sizes because the Normal approximation for the test is quite
unreliable.
There are advantages to starting with inference for p. Starting with z
for means takes a fair amount of time, and the ideas need to be
rehashed with the introduction of the t procedures. Many
instructors face pressure from client departments to cover a large
amount of material in a single semester. Eliminating coverage of the
“unrealistic” z for means with known variance enables instructors to
cover additional, more realistic applications of inference. Also,
38.
many instructors believethat proportions are simpler and more
familiar to students than means.
Why Didn’t You Cover Topic X?
Introductory texts ought not to be encyclopedic. We chose topics on
two grounds: they are the most commonly used in practice, and they
are suitable vehicles for learning broader statistical ideas. Students
who have completed the core of the book, Chapters 1 through 12 and
15 through 24, will have little difficulty moving on to more elaborate
methods. Chapters 25 through 27 offer a choice of slightly more
advanced topics, as do the optional supplemental chapters, available
online.
Why Are Some Chapters and Sections
Listed as Optional?
Many users have requested that we include the content listed as
optional. However, as noted above, many instructors face pressure
from client departments to cover many topics in a single semester.
We have identified some material that can safely be omitted because
it is not required for later parts of the book. Instructors can cover
this optional content if they wish, but they can also omit it in order
to cover topics that client departments have requested.
39.
The content wedesignate as optional is not less important than other
material in the book. For example, many instructors will want to
cover Chapters 6 and 25 because they consider relationships
between categorical variables an essential topic for their students.
We have enjoyed the opportunity to once again rethink how to help
beginning students achieve a practical grasp of basic statistics. What
students actually learn is not identical to what we teachers think we
have “covered,” so the virtues of concentrating on the essentials are
considerable. We hope this new edition of The Basic Practice of
Statistics offers a mix of concrete skills and clearly explained
concepts that will help many teachers guide their students toward
useful knowledge.
40.
PREFACE
Empowering Problem Solvingand Real-World Decision
Making
Now available with Macmillan’s new, ground-breaking online
learning platform Achieve, the ninth edition of The Basic Practice
of Statistics teaches statistical thinking through an investigative
process of problem solving with pedagogy designed to help
students of all levels. Examples and exercises from a wide
variety of topic areas use current, real data to provide students
with insight into how data is used to make decisions in the real
world.
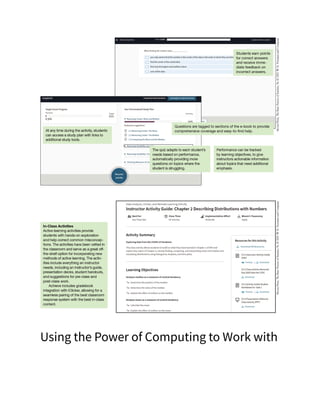
Achieve for The Basic Practice of Statistics connects the book’s
trusted Four-Step problem-solving approach and real-world
examples to rich digital resources that foster understanding and
facilitate the practice of statistics. The tools in Achieve support
learning before, during, and after class for students and equip
instructors with class performance analytics in an easy-to-use
interface.
41.
Overview of keyfeatures
Support for Learners on Every Page
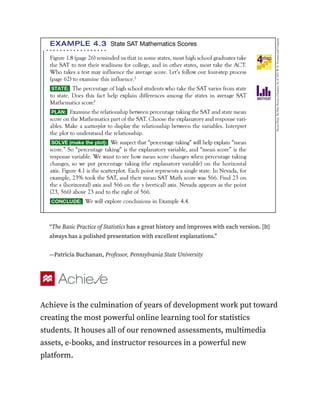
Four-Step Problem-Solving examples guide students through
the Four-Step process for working through statistical problems:
State, Plan, Solve, Conclude. Students are instructed to apply
this process in designated exercises.
Apply Your Knowledge exercises at the end of each section
encourage students to read actively and to cement new concepts
by applying them as they learn.
Examples of Technology, located where most appropriate,
display and comment on the output from popular statistical
software applications (notably Excel, Minitab, JMP, and R) and
TI 83/84 graphing calculators in the context of worked
examples. Students learn to interpret output from any standard
statistical package.
Definition and Theorem Boxes in the text alert students to key
concepts, terms, and procedures.
Caution Boxes warn students of common mistakes or
misconceptions.
Statistics in Your World margin notes further connect statistics
topics to the real world, highlighting interesting examples and
42.
applications from avariety of fields.
The main themes of the text are strongly aligned to the GAISE
guidelines (from the Guidelines in Assessment and Instruction
in Statistics Education College Report).
New to the Ninth Edition
Examples and exercises clearly emphasize reaching
conclusions and making decisions based on data exploration
and statistical inference.
Chapter Summaries are in concise list form, and Skills Reviews
(in Review Chapters) refer to relevant chapter sections to help
students check their knowledge and review for exams.
Data in examples and exercises have been updated for
relevance, and new examples and exercises explore
contemporary issues such as social media usage.
Displayed in boldface type, key terms are clearly defined in
running text or in the margin, to build understanding without
focusing on vocabulary.
Highlight Four-Step Problem-Solving
43.
Expanded in theNinth Edition
Equips Students to Solve Complex Statistical Problems
Recognizing which approach to take and how to get started on a
problem are often challenging for statistics students. David Moore
and William Notz reduce student stress and support learning by
using a problem-solving framework throughout The Basic Practice of
Statistics.
44.
“The Basic Practiceof Statistics has a great history and improves with each version. [It]
always has a polished presentation with excellent explanations.”
—Patricia Buchanan, Professor, Pennsylvania State University
Achieve is the culmination of years of development work put toward
creating the most powerful online learning tool for statistics
students. It houses all of our renowned assessments, multimedia
assets, e-books, and instructor resources in a powerful new
platform.
45.
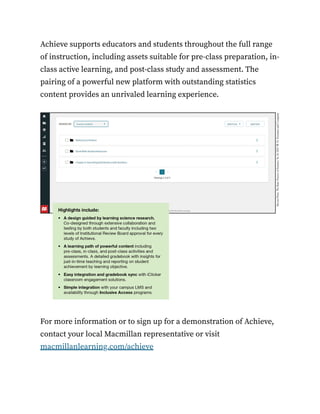
Achieve supports educatorsand students throughout the full range
of instruction, including assets suitable for pre-class preparation, in-
class active learning, and post-class study and assessment. The
pairing of a powerful new platform with outstanding statistics
content provides an unrivaled learning experience.
For more information or to sign up for a demonstration of Achieve,
contact your local Macmillan representative or visit
macmillanlearning.com/achieve
46.
Robust tutorial-style assessmenttools in Achieve help students
develop problem-solving and statistical reasoning skills. Achieve
contains more than 3,000 assessment questions designed for both
pre-class foundational learning and post-class homework. For select
questions, our formative assessment environment responds to
students’ incorrect answers with feedback to guide their study. This
Socratic feedback mechanism emulates the office-hours experience,
encouraging students to think critically about their identified
misconceptions. Students make the most out of homework with
Achieve’s hallmark hints, detailed feedback, and fully worked
solutions.
LearningCurve Adaptive Quizzing
LearningCurve’s game-like quizzing motivates students to engage
with the course content, and reporting tools help teachers get a
handle on what their class needs.
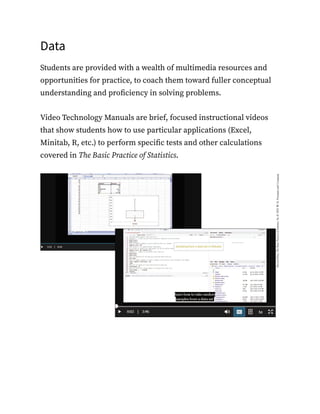
Data
Students are providedwith a wealth of multimedia resources and
opportunities for practice, to coach them toward fuller conceptual
understanding and proficiency in solving problems.
Video Technology Manuals are brief, focused instructional videos
that show students how to use particular applications (Excel,
Minitab, R, etc.) to perform specific tests and other calculations
covered in The Basic Practice of Statistics.
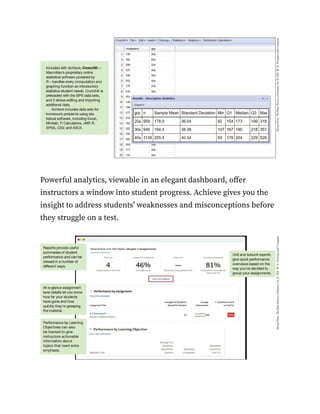
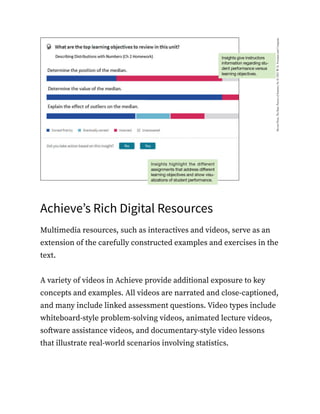
49.
Powerful analytics, viewablein an elegant dashboard, offer
instructors a window into student progress. Achieve gives you the
insight to address students’ weaknesses and misconceptions before
they struggle on a test.
50.
Achieve’s Rich DigitalResources
Multimedia resources, such as interactives and videos, serve as an
extension of the carefully constructed examples and exercises in the
text.
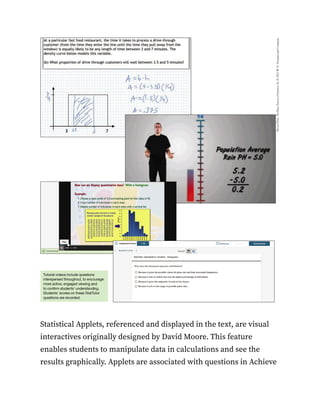
A variety of videos in Achieve provide additional exposure to key
concepts and examples. All videos are narrated and close-captioned,
and many include linked assessment questions. Video types include
whiteboard-style problem-solving videos, animated lecture videos,
software assistance videos, and documentary-style video lessons
that illustrate real-world scenarios involving statistics.
51.
Statistical Applets, referencedand displayed in the text, are visual
interactives originally designed by David Moore. This feature
enables students to manipulate data in calculations and see the
results graphically. Applets are associated with questions in Achieve
 Most read
 Most read