3
The Analysis ofBiological Data
Third Edition
Michael C. Whitlock and Dolph Schluter
Austin • Boston • New York • Plymouth
6.
4
Vice President, STEM:Daryl Fox
Program Director: Andrew Dunaway
Director, Development: Lisa Samols
Senior Program Manager: Jennifer Edwards
Executive Development Editor: Katrina Mangold
Editorial Project Manager: Michele Mangelli
Assistant Editor: Justin Jones
Editorial Assistant: Nathan Livingston
Senior Marketing Manager: Nancy Bradshaw
Marketing Assistant: Maddie Inskeep
Director of Content: Daniel Lauve
Lead Content Developer: Aaron Gladish
Content Development Manager: Ava Cas
Executive Media Editor: Catriona Kaplan
Associate Media Editor: Doug Newman
Director, Content Management Enhancement: Tracey Kuehn
Senior Managing Editor: Lisa Kinne
Content Project Manager: Elizabeth Dziubela
Project Manager: Linda DeMasi, Lumina Datamatics, Ltd.
Director of Digital Production: Keri DeManigold
Senior Media Project Manager: Elton Carter
Permissions Manager: Jennifer MacMillan
Executive Permissions Editor: Robin Fadool
Photo Researcher and Lumina Project Manager: Brittani Morgan
Director of Design, Content Management: Diana Blume
Design Services Manager: Natasha A. S. Wolfe
6
In 1946, WilliamFreeman founded W. H. Freeman and Company
and published Linus Pauling's General Chemistry, which
revolutionized the chemistry curriculum and established the
prototype for a Freeman text. W. H. Freeman quickly became a
publishing house where leading researchers can make significant
contributions to mathematics and science. In 1996, W. H. Freeman
joined Macmillan and we have since proudly continued the legacy of
providing revolutionary, quality educational tools for teaching and
learning in STEM.
8
Contents in brief
Preface
Aboutthe authors
Acknowledgments
SaplingPlus for statistics
Online resources for students
PART 1 INTRODUCTION TO STATISTICS
1. Statistics and samples
INTERLEAF 1 Correlation does not require causation
2. Displaying data
3. Describing data
4. Estimating with uncertainty
INTERLEAF 2 Pseudoreplication
5. Probability
6. Hypothesis testing
INTERLEAF 3 Why statistical significance is not the same
as biological importance
PART 2 PROPORTIONS AND FREQUENCIES
7. Analyzing proportions
INTERLEAF 4 Biology and the history of statistics
8. Fitting probability models to frequency data
INTERLEAF 5 Making a plan
11.
9
9. Contingency analysis:Associations between categorical
variables
Review Problems 1
PART 3 COMPARING NUMERICAL VALUES
10. The normal distribution
INTERLEAF 6 Controls in medical studies
11. Inference for a normal population
12. Comparing two means
INTERLEAF 7 Which test should I use?
13. Handling violations of assumptions
Review Problems 2
14. Designing experiments
INTERLEAF 8 Data dredging
15. Comparing means of more than two groups
INTERLEAF 9 Experimental and statistical mistakes
PART 4 REGRESSION AND CORRELATION
16. Correlation between numerical variables
INTERLEAF 10 Publication bias
17. Regression
INTERLEAF 11 Meta-analysis
Review Problems 3
PART 5 MODERN STATISTICAL METHODS
18. Analyzing multiple factors
INTERLEAF 12 Using species as data points
19. Computer-intensive methods
11
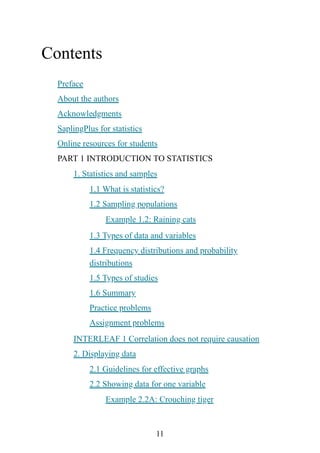
Contents
Preface
About the authors
Acknowledgments
SaplingPlusfor statistics
Online resources for students
PART 1 INTRODUCTION TO STATISTICS
1. Statistics and samples
1.1 What is statistics?
1.2 Sampling populations
Example 1.2: Raining cats
1.3 Types of data and variables
1.4 Frequency distributions and probability
distributions
1.5 Types of studies
1.6 Summary
Practice problems
Assignment problems
INTERLEAF 1 Correlation does not require causation
2. Displaying data
2.1 Guidelines for effective graphs
2.2 Showing data for one variable
Example 2.2A: Crouching tiger
14.
12
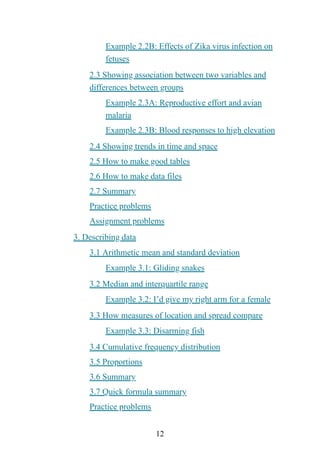
Example 2.2B: Effectsof Zika virus infection on
fetuses
2.3 Showing association between two variables and
differences between groups
Example 2.3A: Reproductive effort and avian
malaria
Example 2.3B: Blood responses to high elevation
2.4 Showing trends in time and space
2.5 How to make good tables
2.6 How to make data files
2.7 Summary
Practice problems
Assignment problems
3. Describing data
3.1 Arithmetic mean and standard deviation
Example 3.1: Gliding snakes
3.2 Median and interquartile range
Example 3.2: I’d give my right arm for a female
3.3 How measures of location and spread compare
Example 3.3: Disarming fish
3.4 Cumulative frequency distribution
3.5 Proportions
3.6 Summary
3.7 Quick formula summary
Practice problems
15.
13
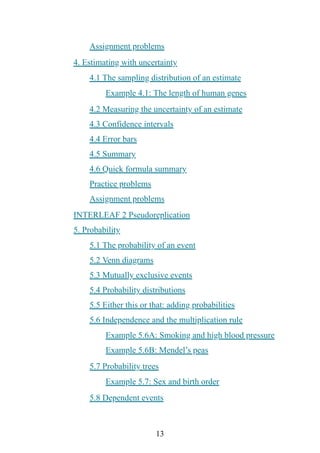
Assignment problems
4. Estimatingwith uncertainty
4.1 The sampling distribution of an estimate
Example 4.1: The length of human genes
4.2 Measuring the uncertainty of an estimate
4.3 Confidence intervals
4.4 Error bars
4.5 Summary
4.6 Quick formula summary
Practice problems
Assignment problems
INTERLEAF 2 Pseudoreplication
5. Probability
5.1 The probability of an event
5.2 Venn diagrams
5.3 Mutually exclusive events
5.4 Probability distributions
5.5 Either this or that: adding probabilities
5.6 Independence and the multiplication rule
Example 5.6A: Smoking and high blood pressure
Example 5.6B: Mendel’s peas
5.7 Probability trees
Example 5.7: Sex and birth order
5.8 Dependent events
16.
14
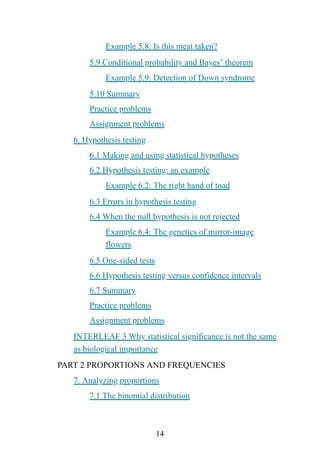
Example 5.8: Isthis meat taken?
5.9 Conditional probability and Bayes’ theorem
Example 5.9: Detection of Down syndrome
5.10 Summary
Practice problems
Assignment problems
6. Hypothesis testing
6.1 Making and using statistical hypotheses
6.2 Hypothesis testing: an example
Example 6.2: The right hand of toad
6.3 Errors in hypothesis testing
6.4 When the null hypothesis is not rejected
Example 6.4: The genetics of mirror-image
flowers
6.5 One-sided tests
6.6 Hypothesis testing versus confidence intervals
6.7 Summary
Practice problems
Assignment problems
INTERLEAF 3 Why statistical significance is not the same
as biological importance
PART 2 PROPORTIONS AND FREQUENCIES
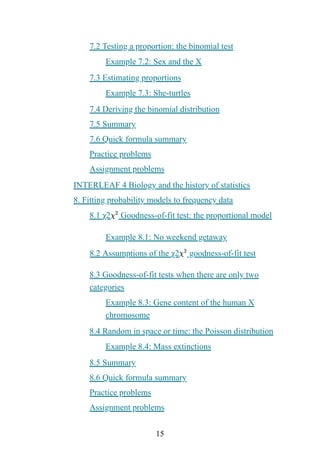
7. Analyzing proportions
7.1 The binomial distribution
17.
15
7.2 Testing aproportion: the binomial test
Example 7.2: Sex and the X
7.3 Estimating proportions
Example 7.3: She-turtles
7.4 Deriving the binomial distribution
7.5 Summary
7.6 Quick formula summary
Practice problems
Assignment problems
INTERLEAF 4 Biology and the history of statistics
8. Fitting probability models to frequency data
8.1 χ2 Goodness-of-fit test: the proportional model
Example 8.1: No weekend getaway
8.2 Assumptions of the χ2 goodness-of-fit test
8.3 Goodness-of-fit tests when there are only two
categories
Example 8.3: Gene content of the human X
chromosome
8.4 Random in space or time: the Poisson distribution
Example 8.4: Mass extinctions
8.5 Summary
8.6 Quick formula summary
Practice problems
Assignment problems
18.
16
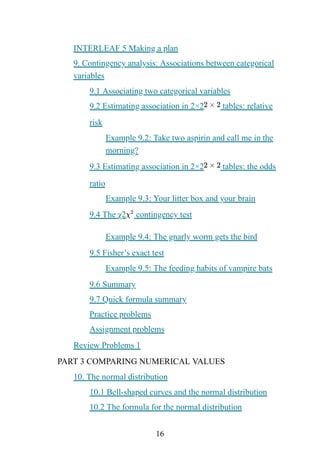
INTERLEAF 5 Makinga plan
9. Contingency analysis: Associations between categorical
variables
9.1 Associating two categorical variables
9.2 Estimating association in 2×2 tables: relative
risk
Example 9.2: Take two aspirin and call me in the
morning?
9.3 Estimating association in 2×2 tables: the odds
ratio
Example 9.3: Your litter box and your brain
9.4 The χ2 contingency test
Example 9.4: The gnarly worm gets the bird
9.5 Fisher’s exact test
Example 9.5: The feeding habits of vampire bats
9.6 Summary
9.7 Quick formula summary
Practice problems
Assignment problems
Review Problems 1
PART 3 COMPARING NUMERICAL VALUES
10. The normal distribution
10.1 Bell-shaped curves and the normal distribution
10.2 The formula for the normal distribution
19.
17
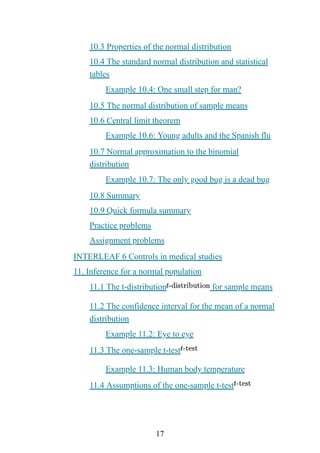
10.3 Properties ofthe normal distribution
10.4 The standard normal distribution and statistical
tables
Example 10.4: One small step for man?
10.5 The normal distribution of sample means
10.6 Central limit theorem
Example 10.6: Young adults and the Spanish flu
10.7 Normal approximation to the binomial
distribution
Example 10.7: The only good bug is a dead bug
10.8 Summary
10.9 Quick formula summary
Practice problems
Assignment problems
INTERLEAF 6 Controls in medical studies
11. Inference for a normal population
11.1 The t-distribution for sample means
11.2 The confidence interval for the mean of a normal
distribution
Example 11.2: Eye to eye
11.3 The one-sample t-test
Example 11.3: Human body temperature
11.4 Assumptions of the one-sample t-test
20.
18
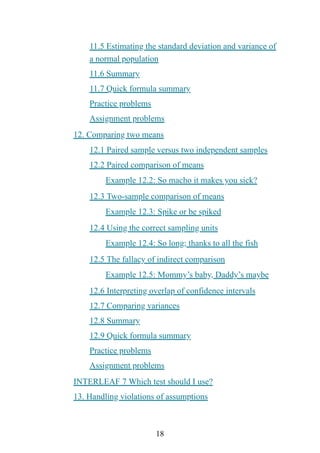
11.5 Estimating thestandard deviation and variance of
a normal population
11.6 Summary
11.7 Quick formula summary
Practice problems
Assignment problems
12. Comparing two means
12.1 Paired sample versus two independent samples
12.2 Paired comparison of means
Example 12.2: So macho it makes you sick?
12.3 Two-sample comparison of means
Example 12.3: Spike or be spiked
12.4 Using the correct sampling units
Example 12.4: So long; thanks to all the fish
12.5 The fallacy of indirect comparison
Example 12.5: Mommy’s baby, Daddy’s maybe
12.6 Interpreting overlap of confidence intervals
12.7 Comparing variances
12.8 Summary
12.9 Quick formula summary
Practice problems
Assignment problems
INTERLEAF 7 Which test should I use?
13. Handling violations of assumptions
21.
19
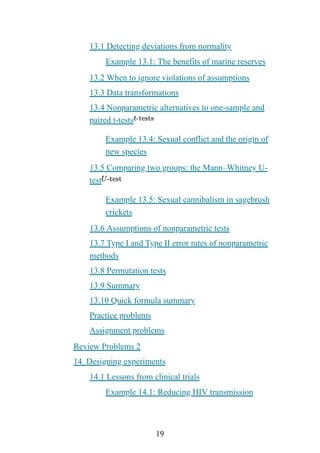
13.1 Detecting deviationsfrom normality
Example 13.1: The benefits of marine reserves
13.2 When to ignore violations of assumptions
13.3 Data transformations
13.4 Nonparametric alternatives to one-sample and
paired t-tests
Example 13.4: Sexual conflict and the origin of
new species
13.5 Comparing two groups: the Mann–Whitney U-
test
Example 13.5: Sexual cannibalism in sagebrush
crickets
13.6 Assumptions of nonparametric tests
13.7 Type I and Type II error rates of nonparametric
methods
13.8 Permutation tests
13.9 Summary
13.10 Quick formula summary
Practice problems
Assignment problems
Review Problems 2
14. Designing experiments
14.1 Lessons from clinical trials
Example 14.1: Reducing HIV transmission
22.
20
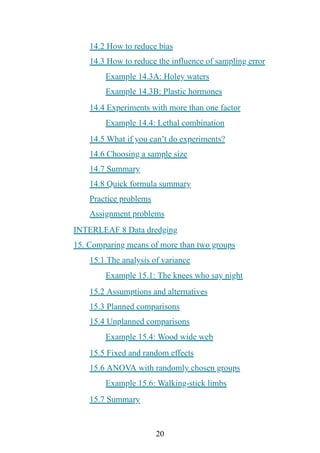
14.2 How toreduce bias
14.3 How to reduce the influence of sampling error
Example 14.3A: Holey waters
Example 14.3B: Plastic hormones
14.4 Experiments with more than one factor
Example 14.4: Lethal combination
14.5 What if you can’t do experiments?
14.6 Choosing a sample size
14.7 Summary
14.8 Quick formula summary
Practice problems
Assignment problems
INTERLEAF 8 Data dredging
15. Comparing means of more than two groups
15.1 The analysis of variance
Example 15.1: The knees who say night
15.2 Assumptions and alternatives
15.3 Planned comparisons
15.4 Unplanned comparisons
Example 15.4: Wood wide web
15.5 Fixed and random effects
15.6 ANOVA with randomly chosen groups
Example 15.6: Walking-stick limbs
15.7 Summary
23.
21
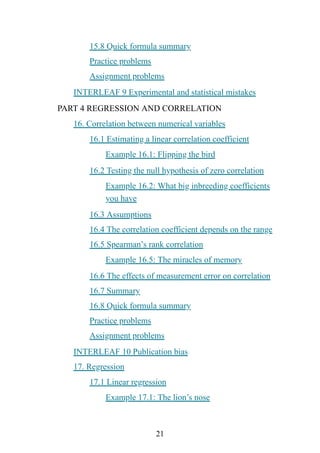
15.8 Quick formulasummary
Practice problems
Assignment problems
INTERLEAF 9 Experimental and statistical mistakes
PART 4 REGRESSION AND CORRELATION
16. Correlation between numerical variables
16.1 Estimating a linear correlation coefficient
Example 16.1: Flipping the bird
16.2 Testing the null hypothesis of zero correlation
Example 16.2: What big inbreeding coefficients
you have
16.3 Assumptions
16.4 The correlation coefficient depends on the range
16.5 Spearman’s rank correlation
Example 16.5: The miracles of memory
16.6 The effects of measurement error on correlation
16.7 Summary
16.8 Quick formula summary
Practice problems
Assignment problems
INTERLEAF 10 Publication bias
17. Regression
17.1 Linear regression
Example 17.1: The lion’s nose
24.
22
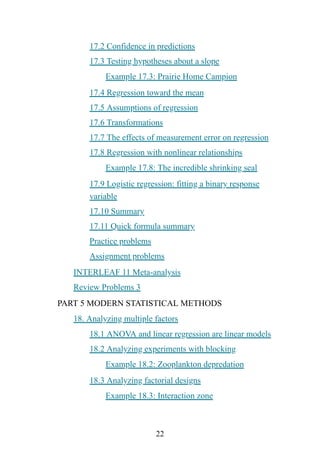
17.2 Confidence inpredictions
17.3 Testing hypotheses about a slope
Example 17.3: Prairie Home Campion
17.4 Regression toward the mean
17.5 Assumptions of regression
17.6 Transformations
17.7 The effects of measurement error on regression
17.8 Regression with nonlinear relationships
Example 17.8: The incredible shrinking seal
17.9 Logistic regression: fitting a binary response
variable
17.10 Summary
17.11 Quick formula summary
Practice problems
Assignment problems
INTERLEAF 11 Meta-analysis
Review Problems 3
PART 5 MODERN STATISTICAL METHODS
18. Analyzing multiple factors
18.1 ANOVA and linear regression are linear models
18.2 Analyzing experiments with blocking
Example 18.2: Zooplankton depredation
18.3 Analyzing factorial designs
Example 18.3: Interaction zone
25.
23
18.4 Adjusting forthe effects of a covariate
Example 18.4: Mole-rat layabouts
18.5 Assumptions of linear models
18.6 Summary
Practice problems
Assignment problems
INTERLEAF 12 Using species as data points
19. Computer-intensive methods
19.1 Hypothesis testing using simulation
Example 19.1: How did he know? The non-
randomness of haphazard choice
19.2 Bootstrap standard errors and confidence
intervals
Example 19.2: The language center in chimps’
brains
19.3 Summary
Practice problems
Assignment problems
20. Likelihood
20.1 What is likelihood?
20.2 Two uses of likelihood in biology
20.3 Maximum likelihood estimation
Example 20.3: Unruly passengers
20.4 Versatility of maximum likelihood estimation
Example 20.4: Conservation scoop
26.
24
20.5 Log-likelihood ratiotest
20.6 Summary
20.7 Quick formula summary
Practice problems
Assignment problems
21. Survival analysis
21.1 Survival curves
Example 21.1: Ebola outbreak
21.2 Compare survival curves
Example 21.2: Tumor genetics
21.3 Summary
21.4 Quick formula summary
Practice problems
Assignment problems
Statistical tables
Using statistical tables
Statistical Table A: The χ2 distribution
Statistical Table B: The standard normal (Z) distribution
Statistical Table C: Student’s t-distribution
Statistical Table D: The F-distribution
Statistical Table E: Mann–Whitney U-distribution
27.
25
Statistical Table F:Tukey–Kramer q-distribution
Statistical Table G: Critical values for the Spearman’s rank
correlation
Literature cited
Answers to practice problems
Index
28.
26
Preface
Modern biologists needthe powerful tools of data analysis. As a
result, an increasing number of universities offer, or even require, a
basic data analysis course for all their biology and premedical
students. We have been teaching such a course at the University of
British Columbia for the last three decades. Over this period, we
have sought a textbook that covered the material we needed in an
introductory course at just the right level. We found that most texts
were too technical and encyclopedic, or else they didn’t go far
enough, missing methods that were crucial to the practice of modern
biology and medicine. We wanted a book that had a strong emphasis
on intuitive understanding to convey meaning, rather than an
overreliance on formulas. We wanted to teach by example, and the
examples needed to be interesting. Most importantly, we needed a
biology book, addressing topics important to biologists and health
care providers handling real data.
We couldn’t find the book that we needed, so we decided to write
this one to fill the gap. We include several unusual features that we
have discovered to be helpful for effectively reaching our audience:
Interesting biology examples and exercise
sets.
Our teaching has shown us that biology students learn data analysis
best in the context of interesting examples drawn from the medical
and biological literature. Statistics is a means to an end, a tool to
learn about the human and natural world. By emphasizing what we
29.
27
can learn aboutthe science, the power and value of statistics
becomes plain. Plus, it’s just more fun for everyone concerned.
Every chapter has several biological or medical examples of key
concepts, and each example is prefaced by a substantial description
of the biological setting. The examples are illustrated with photos of
the real organisms, so that students can look at what they’re learning
about. The emphasis on real and interesting examples carries into the
problem sets; each chapter has many questions based on real data
about biological and medical issues. These include Calculation
Practice Problems that take the student step-by-step through the
important procedures described in the chapter. Two or three such
problems are at the start of most of the chapter problem sets. We
include three sections of review problems (after Chapters 9, 13, and
17) to allow cumulative review of the important concepts up to that
point in the book. In this third edition, we have added dozens of new
problems.
Intuitive explanations of key concepts.
Statistical reasoning requires a lot of new ways of thinking. Students
can get lost in the barrage of new jargon and multitudinous tests. We
have found that starting from an intuitive foundation, away from all
the details, is extremely valuable. We take an intuitive approach to
basic questions: What’s a good sample? What’s a confidence
interval? Why do an experiment? The first several chapters establish
this basic knowledge, and the rest of the book builds on it.
30.
28
Practical data analysis.
Asits title suggests, this book focuses on data rather than the
mathematical foundations of statistics. We teach how to make good
graphical displays, and we emphasize that a good graph is the
beginning point of any good data analysis. We give equal time to
estimation and hypothesis testing, and we avoid treating the P-value
as an end in itself. The book does not demand a knowledge
of mathematics beyond simple algebra. We focus on practicality over
nuance, on biological usefulness over theoretical hand wringing. We
not only teach the “right” way of doing something but also highlight
some of the pitfalls that might be encountered.
We demonstrate how to carry out the calculations for most methods
so that the steps are not mysterious to students. At the same time, we
know that a computer will be available for most calculations. Hence,
we focus on the concepts of biological data analysis and how
statistics can help extract scientific insight from data. With the power
of modern computers at hand, the challenge in analyzing data
becomes knowing what method to use and why. We imagine and
hope that every course using this book will have a component
encouraging students to use computer statistical packages. The
diversity of such packages is immense, and so we have not tied the
book to any particular program. Nevertheless, many biologists and
users of this book analyze data with the R statistical computing
package. Accordingly, we provide R scripts for all the examples in
this book at the book’s web site (whitlockschluter3e.zoology.ubc.ca).
This site also includes a series of self-guided labs to teach students
1
31.
29
the basics ofusing R at a reasonable pace, and in an order that
matches the presentation of the concepts in the book.
Practical experimental design.
A biologist cannot do good statistics—or good science—without a
practical understanding of experimental design. Unlike most books,
our book covers basic topics in experimental design, such as
controls, randomization, pseudoreplication, and blocking, and we do
it in a practical, intuitive way.
Coverage of modern topics.
Modern biology uses a larger toolkit than the one available a
generation ago. In this book, we go beyond most introductory books
by establishing the conceptual principles of important topics such as
likelihood, non-linear regression, permutation tests, survival
analysis, and the bootstrap.
Useful summaries.
Near the end of each chapter is a short, clear summary of the key
concepts, and most chapters end with Quick Formula Summaries
that put most equations in one easy-to-find place.
Interleaves.
Between chapters are short essays that we call interleaves. These
interleaves cover a variety of conceptual topics in a nontechnical
way—ideas that are nevertheless crucial for the interpretation of
statistical results in scientific research. Several of them focus on
32.
30
common mistakes inthe analysis and interpretation of biological
data and how to avoid them. Although the interleaves are pressed
between the chapters, they complement the material in the core
chapters in important ways. We believe that the interleaves discuss
some of the most important topics of the book, such as the difference
between correlation and causation (Interleaf 1), the meaning of
statistical significance (Interleaf 3), why control treatments are
necessary (Interleaf 6), and the distortions caused by publication bias
(Interleaf 10). Interleaf 7 summarizes what statistical test should be
used and when, and it is a good place to start when reviewing for
exams.
We think The Analysis of Biological Data provides a good
background in data analysis for biologists and medical practitioners,
covering a broad range of topics in a practical and intuitive way. It
works for our classes; we hope that it works for yours, too.
Organization of the book
The Analysis of Biological Data is divided into five parts, each with
a handful of chapters as indicated in the table of contents. We
recommend starting with the first part, because it introduces many
basic concepts that are used throughout the book, such as sampling,
drawing a good graph, describing data, estimating, hypothesis
testing, and concepts in probability. These early chapters are meant
to be read in their entirety.
After the first block, most chapters progress from the most general
topics at the start to more specialized topics by the end. Each chapter
33.
31
is structured sothat a basic understanding of the topic may be
obtained from the earliest sections. For example, in the chapter on
analysis of variance (Chapter 15), the basics are taught in the first
two sections; reading Sections 15.1 and 15.2 gives roughly the same
material that most introductory statistics texts provide about this
method. Sections 15.3–15.6 explain additional twists and other
interesting applications.
The last block of chapters (Chapters 18–21) is mainly for the
adventurous and the curious. These chapters introduce topics, such
as likelihood, bootstrapping, and a brand-new chapter on survival
analysis (Chapter 21), that are commonly encountered in the
biological and medical literature but not often mentioned in an
introductory course. These chapters introduce the basic principles of
each topic, discuss how the methods work, and point to where you
might look to find out more.
A basic course could be taught by using only Chapters 1–17 and,
within this subset of chapters, by stopping after Sections 5.8, 7.3,
8.4, 9.4, 12.6, 13.6, 15.2, 16.4, and 17.6 in their respective chapters.
We suggest that all courses highlight specific topics covered only in
the interleaves.
Each chapter ends with a series of problems that are designed to test
students’ understanding of the concepts and the practical application
of statistics. The problems are divided into Practice Problems and
Assignment Problems. Short answers to all Practice Problems and
Review Problems are provided in the back of the book; answers to
34.
32
the Assignment Problemsare available to instructors only from the
publisher. For a copy, please send an email to DL-
WhitlockSchluter3e@macmillan.com. Other teaching resources for
the book are available online at whitlockschluter3e.zoology.ubc.ca.
A word about the data
The data used in this book are real, with a few well-marked
exceptions. For the most part, these data were obtained directly from
published papers. In some cases, we contacted the authors of articles
who generously provided the raw data for our use. Often, when raw
data were not provided in the original paper, we resorted to obtaining
data points by digitizing graphical depictions, such as scatter plots
and histograms. Inevitably, the numbers we extracted differ slightly
from the original numbers because of measurement error. In rare
cases, we generated data by computer that matched the statistical
summaries in the paper. In all cases, the results we present are
consistent with the conclusions of the original papers. Most of the
data sets are available online at whitlockschluter3e.zoology.ubc.ca.
35.
33
About the authors
MichaelWhitlock is an evolutionary biologist and population geneticist.
He is a professor of zoology at the University of British Columbia, where
he has taught statistics to biology students since 1995. Whitlock is known
for his work on the spatial structure of biological populations, genetic
drift, and the genetics of adaptation. He has worked with fungus beetles,
rhinos, and fruit flies; mathematical theory; and statistical genetics. He is a
member of the American Academy of Arts and Sciences and a Fellow of
the Royal Society of Canada. He has been editor-in-chief of The American
Naturalist and on the editorial boards of nine scientific journals.
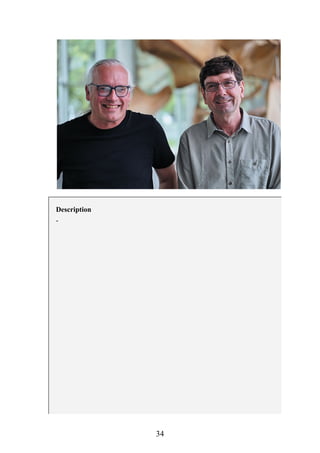
Dolph Schluter is a professor and Canada Research Chair in the Zoology
Department and Biodiversity Research Center at the University of British
Columbia. He is known for his research on the ecology and evolution of
Galapagos finches and threespine stickleback, and on the evolution of
large-scale biodiversity gradients. He is a Fellow of the Royal Societies of
Canada and London and a foreign member of the U.S. National Academy
of Sciences.
36
Acknowledgments
This book wouldnot have happened had the two of us had been left
to do it by ourselves. Many people contributed in substantial ways,
and we are forever grateful. The clarity and accuracy of its contents
were improved by the careful attention of a lot of generous readers,
including Anwar Ahmad, Arianne Albert, Sulekha Anand, Corey
Devin Anderson, Brad Anholt, Cécile Ané, Eric Baack, Mitchell
Baker, Brandon Barton, Arthur Berg, Kelly Bodwin, Eline Boghaert,
Yaniv Brandvain, Chad Brassil, James Bryant, Martin Buntinas,
Mark Butler, Brett C. Byram, Chao Cai, Ashley J.R. Carter, Carrie
Case, C. Ray Chandler, Laurel Chiappetta, Mark Clemens, Bradley
Cosentino, Erika Crispo, Perry de Valpine, Flo Débarre, Tony
Desmond, Eric Dewar, Abby Drake, Christiana Drake, Joseph E.
Duchamp, Jonathan Dushoff, K. M. Flanagan, Matthias W. Foellmer,
Demba Fofana, Steven George, Aleeza Gerstein, George Gilchrist,
Brett Goodwin, Steven Green, B.E. Hagerty, Amanda Hale, Tim
Hanson, R.N. Hartnett, Mike Hickerson, Lisa Hines, Eric S. Ho,
Heather J. Hoffman, Dominique Ingato, Darren Irwin, Nusrat Jahan,
Philip Johns, Roger Johnson, John Kalbfleisch, Istvan Karsai, Karry
Kazial, Robert Keen, John Kelly, Rex Kenner, Ben Kerr, Yoon G.
Kim, Jamie Kneitel, Laura Kubatko, Joseph G. Kunkel, Terri
Lacourse, Robert Laird, Bret Larget, Theo Light, Todd Livdahl,
Heather J. Lynch, Rene Malenfant, Mike Marin, Michelle Marvier,
Virginia Matzek, Brian C. McCarthy, Kevin Middleton, Eli Minkoff,
Robert Montgomerie, Panagis Moschopoulos, Spencer Muse,
Courtney Murren, Claudia Neuhauser, Liam O’Brien, Maria Orive,
Sally Otto, Iain Pardoe, Elise Pasles, Patrick C. Phillips, Jay
39.
37
Pitocchelli, Danielle Presgraves,Angelica Pytel, Nathan Rank,
Bruce Rannala, Diann Reischman, Mark Rizzardi, James Robinson,
Simon Robson, Michael Rosenberg, Noah Rosenberg, Anirudh V. S.
Ruhil, Colin Rundel, Michael Russell, Ronald W. Russell, Paul
Sajda, Johnny Sellers, Andrew Schaffner, Andrea Schluter, Aimee
Schwab-McCoy, James Scott, Ye Shen, Joel Shore, Andrew Skelton,
John Soghigian, Drew M. Talley, William Thomas, Andrew
Tierman, Michael Travisano, Thomas Valone, Christopher Vitek,
Bruce Walsh, Claus Wilke, David H. Wise, Melissa Wuellner,
Michael Wunder, Grace A. Wyngaard, George Yanev, Sam Yeaman,
and Amanda Zellmer. Many of these good people read multiple
chapters, and we thank all for their invaluable aid and considerate
forebearance. Sally Otto, Allan Stewart-Oaten, and Maria Orive
earned our undying gratitude by reading and commenting on the
entire book. Of course, any errors that remain are our own fault; we
didn’t always take everyone’s advice, even perhaps when we should
have. If we have forgotten anyone, you have our thanks even if our
memories are poor.
We owe a debt to the students of BIOL 300 at the University of
British Columbia, who class-tested this book over the last several
years. The book also benefited by class testing at several colleges
and universities. George Gilchrist and his students gave us a very
detailed and extremely helpful set of comments at a crucial stage of
the book.
Many students and faculty from UBC and other institutions
uncovered errors in earlier versions of the book; we thank them by
40.
38
name at whitlockschluter3e.zoology.ubc.ca/acknowledgments.html.
Wesend special thanks to Nick Cox, who graciously read a previous
printing of this book with extraordinary care.
The book has benefited enormously from the efforts of a large team
of able people in the first two editions: John Murdzek, Gunder Hefta,
Kathi Townes, Tom Webster, Lori Heckelman, Mark Ong, and
Kristina Elliott all helped the book look and feel as nice as it does.
We are grateful to the team at Lumina for keeping the standards
high. Eric Baack, Holly Kindsvater, and Laura Melissa Guzman all
carefully checked answers to the Practice and Assignment Problems.
Steven Green pointed out several improvements to the answer key
and reviewed the answers to the review problem sets. For this third
edition, we are very grateful to the team at Macmillan, who made
this edition and the online media resources possible; thanks to
Jennifer Edwards (Program Manager), Andrew Dunaway (Program
Director), Elizabeth Dziubela (Content Project Manager), Natasha
Wolfe (Design Services Manager), Daniel Lauve (Director of
Content), Doug Newman (Associate Media Editor), and Justin Jones
(Assistant Editor). Our special thanks to Ms. Fabulous, Michele
Mangelli, who kept us on schedule and on point. Finally, Ben
Roberts has our thanks for all of his support and vision for the first
editions of this book and especially Clause 24.
The book was started while MCW was supported by the Peter Wall
Institute for Advanced Studies at UBC as a Distinguished-Scholar-
in-Residence, and the majority of the final stages of the book were
written while he was a Sabbatical Scholar at the National
41.
39
Evolutionary Synthesis Centerin North Carolina (NSF #EF-
0423641). DS began working on the book while a visiting professor
in Developmental Biology at Stanford University. The second
edition was aided by a sabbatical leave at the University of Texas
(MCW) and a Canada Council Senior Killam Fellowship (DS),
which included a wonderful stay at La Selva Biological Station. The
University of British Columbia has been a wonderful academic
home through all three editions. The scholarly support and
environment provided by each of these institutions were exceptional
—and greatly appreciated.
Finally, we would like to give great thanks to all of the people that
have taught us the most over the years. MCW would like to thank
Dave McCauley, Mike Wade, Nick Barton, Ben Pierce, Kevin
Fowler, Patrick Phillips, Sally Otto, and Betty Whitlock. Nancy
Heckman and Don Ludwig enlightened DS on many things about
data and the theory and practice of statistics.
42.
40
for
Statistics: Course Resources
TheAnalysis of Biological Data, Third Edition, is accompanied by a
media and supplements package that facilitates student learning and
enhances the teaching experience. Fully loaded with our interactive e-
book and all student and instructor resources, SaplingPlus is
organized around a set of pre-built units available for each chapter.
Formative Assessment
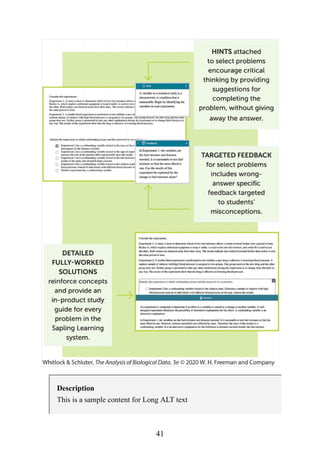
SaplingPlus provides online questions, including select assignment
problems, for every chapter and on every important learning objective
in the book. For select questions, students’ incorrect answers receive
error-specific feedback based on common misconceptions about the
topics.
43
Put “testing tolearn” into action. Based on educational research,
LearningCurve really works: Game-like quizzing motivates students
and adapts to their needs based on their performance. It is the perfect
tool to get students to engage before class and review after class.
Additional reporting tools and metrics help instructors get a handle on
what their class knows and doesn’t know. Available in SaplingPlus.
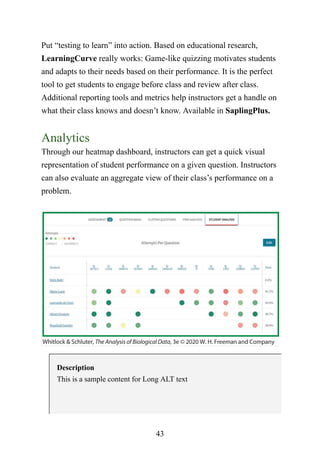
Analytics
Through our heatmap dashboard, instructors can get a quick visual
representation of student performance on a given question. Instructors
can also evaluate an aggregate view of their class’s performance on a
problem.
Description
This is a sample content for Long ALT text
45
For every chapterin the book, instructors are provided with a test
bank of relevant questions, clicker questions that address all key
concepts, and lecture PowerPoint presentations. All of these materials
have been prepared by a team of statistical education specialists.
48.
46
Online Resources forStudents
Many online resources are available to help students learn each of the
key concepts and skills in the book. These are located on the authors’
website at whitlockschluter3e.zoology.ubc.ca and via
www.saplinglearning.com.
A link to a web page listing all resources available for each chapter is
provided near the summary section of each chapter in the book.
Description
This is a sample content for Long ALT text
49.
47
Interactive e-book
With thee-book, students can search, highlight, and bookmark specific
information, making it easier to study and access key content. Media assets
50.
48
such as datasets and glossary terms are linked within the e-book in
SaplingPlus.
R Code for all Examples in the Book
R code is provided to reproduce the complete analysis of all examples
presented in the main text of the book. This resource enables students to
learn R further by example. The code is available online at
whitlockschluter3e.zoology.ubc.ca.
Labs Using R
A series of self-guided labs directs students through a week-by-week set of
activities to reinforce key concepts and introduce the powerful free statistics
package R. These labs are available online at
whitlockschluter3e.zoology.ubc.ca.
Visualizations
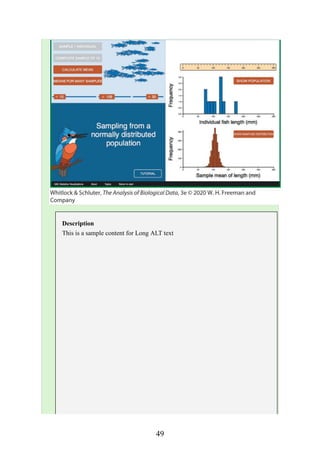
A series of interactive web visualizations allow active learning of many of
the key difficult concepts in introductory statistics. These resources are
available online at whitlockschluter3e.zoology.ubc.ca.