i
Free distribution by A.P. Government
SOCIAL STUDIES
Class X
Published by the Government of Andhra Pradesh, Hyderabad.
Respect the Law
Get the Rights
Grow by Education
Behave Humbly
Sri G. Gopal Reddy, Director,
S.C.E.R.T. ,A.P., Hyderabad.
Sri B. Sudhakar, Director,
A.P. Govt. Textbook Press, Hyderabad.
Dr. N. Upendar Reddy,
Professor & Head C&T Dept., S.C.E.R.T.,A.P., Hyderabad.
Prof. G. Omkarnath, Dept.of Economics,
University of Hyderabad, Hyderabad.
Sri C.N. Subramanyam,
Eklavya,M.P.
Prof. K.Vijaya Babu, Dept. of History,
KakatiyaUniversity,Warangal.
Dr. M.V. Srinivasan,Asst. Prof.
DESS, NCERT, New Delhi.
Sri K. Suresh,
Manchi Pustakam, Hyderabad.
Dr. Sukanya Bose, Consultant,
NIPFP, New Delhi.
Sri Alex. M.George,
Eklavya,M.P.
SriArvindSardana,Director,
Eklavya,M.P.
Dr. K. Narayana Reddy, Asst. Prof.
Dept.of Geography, O.U, Hyderabad.
Prof. I.Laxmi, Dept. of History,
OsmaniaUniversity,Hyderabad.
Prof.BhupendraYadav, AzimPremjiUniversity,
Bangalore
Dr. K.K. Kailash, Asst.Prof.
Dept. of Pol.Sc, University of Hyd, Hyd.
Dr. Chandra ShekharBalachandran,
TheIndianInstituteofGeography,Bangalore.
Dr. N. Chandrayudu,Asst.Prof.
Dept.ofGeography,S.V.University,Tirupati.
Textbook Development Committee
Editors
ii
© Government ofAndhra Pradesh, Hyderabad.
New Edition
First Published 2014
Allrightsreserved.
No part of this publication may be reproduced, stored
in a retrieval system, or transmitted, in any form or by
anymeanswithoutthepriorpermissioninwritingofthe
publisher, nor be otherwise circulated in any form of
bindingorcoverotherthanthatinwhichitispublished
andwithoutasimilarconditionincludingthiscondition
being imposed on the subsequentpurchaser.
The copy right holder of this book is the Director
of SchoolEducation,Hyderabad,AndhraPradesh.
We have used some photographs which are under
creative common licence. They are acknowledged
atlater(pageviii).
This Book has been printed on 70 G.S.M. S.S. Maplitho,
Title Page 200 G.S.M. WhiteArt Card
Free Distribution by Government of Andhra Pradesh
Printed in India
at the Andhra Pradesh Govt.Text Book Press,
Mint Compound, Hyderabad,
Andhra Pradesh.
iii
Free distribution by A.P. Government
Smt. M. Satyavathi Rao, Retd., PGT Political Science, Oxford S S School, Vikaspuri, New Delhi.
Dr. G.Anand,Asst. Prof. (C), Dept. of Geography, Osmania University, Hyderabad.
Dr. S. Venkataratnam,Asst. Prof. (PT), Dept. of History, Nizam College (OU), Hyderabad.
Dr. Venkateshwara Rao.T, Asst. Prof.(C), Dept. of History, PG College (OU), Sec-bad.
Sri Madithati Narasimha Reddy, GHM ZPHS Peddajangampally,Y.S.R.Kadapa.
Sri K. Laxminarayana,Lecturer, Govt. DIET,Angalur, Krishna.
Sri M. Papaiah, Lecturer, SCERT,A.P., Hyderabad.
SriAyachithula Laxman Rao, S.AGHS Dhangarwadi, Karimnagar.
Dr. Racharla Ganapathi, S.A. ZPHS Ladella, Warangal.
Sri UndetiAnanda Kumar, S.AZPHS Sujatha Nagar, Khammam.
Sri P. Jagan Mohan Reddy, S.AZPHS Pidchedu,Gajwel, Medak.
Sri P. Rathangapani Reddy, S.AZPHS Polkampally, Mahabubnagar.
Sri Korivi Srinivasa Rao, S.AMPUPS P.R.Pally,Tekkali,Srikakulam.
Sri. Kasam Kumaraswamy, S.A ZPHS Dowdepally,Adilabad.
Sri N.C. Jagannath, GHS, Kulsumpura, Hyderabad.
Smt Bandi Maria Rani, S.AM.P.U.P.S Chilukanagar, Rangareddy.
Sri M. Papaiah, Lecturer, SCERT,A.P., Hyderabad.
Smt. D. Vijaya Lakshmi, Lecturer, SCERT,A.P., Hyderabad.
Writers
Sri Kurella Srinivas, GHM, ZPHS,Kurmedu, Nalgonda.
Prof. Karen Hadyoc, HBSC, Mumbai.
Illustrators
Smt. Y. Vakula Devi, SKV Color Stream, Hyderabad.
Sri Kannaiah Dara, S.C.E.R.T.AP, Hyd.
Layout & Design
Co-ordinators
iv
– Editors
Letter to students
“Dear Young Friends,
Most of you are growing up in the 21st Century and soon will be old enough to take up a
profession and participate fully in public matters like voting in the elections. It is time you tried to
understand the ideas, processes and systems which determine life in our times. These were
shaped by people through very hard struggles, sacrifices and great acts of cooperative action. As
the next century unfolds it will be your turn to shape our future in similar manner. We hope this
book will help you to a small extent by going over with you how the people of the last century
shaped their ideas, processes and systems.
Your parents and teachers were witnesses and participants in this. As such they will surely
have strong and differing views on many of these matters. While you try to understand the last
century you also therefore need to understand why people hold such divergent views on it and
come to your own conclusions.
This book is in two parts. The first part deals with Resources Development and Equity and the
second part with Contemporary World and India. Under the theme “Resources Development and
Equity” we will explore how we have used the land in which we live and how we engage in
productive activities. Did we properly use the land and its resources? The way we engaged in
productive work and distributed its fruits among different people, was it just and sustainable?
Under the theme “Contemporary World and India” we will explore the impact of major events
of the last century. We will not only be studying what happened over the entire world, but also
what happened in our own country including the recent past. People act not only because they are
moved by different interests but also because they are inspired by different ideas. In the last
century ideas like socialism, fascism, nationalism, liberalism greatly influenced the thinking and
collective actions of people. We will be studying about some of these too.
Textbooks at school level tend not to discuss contemporary events, policies and politics. This is
not because it is too difficult to understand but because opinion about it is sharply divided and it is
feared that this will generate conflicts. However, to live in a democratic world, we also need to
learn to handle our differences and conflicts rather than avoid talking about them. This book is a
bold attempt at initiating our young adults to the world of political debates and differences. It will
be successful only if the teachers, students and the political community take it in the right spirit,
practice restraint and listen carefully to differing points of view with tolerance and understanding.
It may turn out that this book seems to give a particular view point and not represent some other
point of view in proper light. This is very difficult to avoid as textbook writers are human and have
their own understanding. When such issues come to light it is important for the teachers to present
the other view points too before the students and not treat the book as the only or correct source
of information. The students too should be encouraged to read current newspapers, magazines
etc attend public meetings to get more perspectives on these matters.
This book then should be seen as a starting point of enquiry rather than as the end of it.
Books can only tell you what others thought and did. At the end of it you need to decide for
yourself your understanding and what you want to do about the social problems you will be
studying. You have the responsibility of both understanding the society and acting to make it
better. We only hope that this book will help you in this.
v
Free distribution by A.P. Government
ABOUTTHISBOOK
This book is a part of your Social Science Curriculum and a part of various things you would
be doing to study the society around you. However, remember that it is only one small part of that
curriculum. The Social Science Curriculum requires you to analys and share in the class room what
you know. It requires you above all to ask questions – think why things are the way they are. It also
requires you and your friends to go out of the class room to the market, to the village fields, to
temples and mosques and museums and find out various things.You will have to meet and discuss
with a number of people, farmers, shopkeepers, officials, priests and so on.
This book will introduce you to a range of problems and enable you to study them and arrive
at your own understanding of them. So, the most important thing about this book is that it does not
have answers. In fact this book is not really complete. It can only be completed when you and your
friendsandteachersbringtheirownquestionsandexperiencesanddiscusseverythingthreadbarein
the class. You may disagree with many things in this book - do not be afraid to say so - only give
your reasons.Your friends may disagree with you, but try to understand why they have a different
view. Finally arrive at your own answers.You may not even be sure of your answer - you may want
tofindoutmorebeforeyoumakeupyourmind.Inthatcaselistyourquestionscarefullyandrequest
your friends, teachers or elders to help you to find out.
InthisclasswewillbemainlystudyingIndiainthecontextofthecontemporaryworld.The
lasthundredyearshavebeenyearsofmomentouschangeintheworldastwomajorWorldWars
werefought,scoresofcountriesemergedasindependentnations,andgreatexperimentsweredone
inordertobuildjust,equitableanddemocraticworld.
India,afteritsindependencepursuedpoliciestoharnessthenaturalresourcesofthecountry
for economic development to eradicate poverty, reduce dependence on other countries for food
grainsandindustrialgoods,andgenerategainfulemploymentwithinthecountry.Equallyimportant,
itembarkeduponanambitiousprojectofdevelopingIndiaasthelargestdemocracyintheworld–
with guarantee of personal liberty and freedom. We will be studying both aspects of India’s
development–itseconomyanditspolityinthisbook.Sincetheseissuesaffectusinourownlives
and affect different sections of the society differently, there are bound to be different viewpoints
aboutthem.Weneedtolearninourclassroomshowtoengagewiththesedifferentperspectives
andunderstandthemwithsensitivity.Thisisnecessarytostrengthenourdemocraticfabric.
As you study this book in the classroom, you will come across many questions - do stop and
try to answer those questions or do the activity suggested before you proceed ahead. It is not so
important to finish the lesson fast as it is to discuss the questions and do the activities.
Many lessons will suggest projects which may take a few days to do. These projects will
enable you to develop skills of social science enquiry and analysis and presentation - these are more
important than remembering what is written in the lessons.
Please remember that you don't have to memorise what is given in the lesson, but think about
them and form your own opinion about them.
Director, SCERT,
A P, Hyderabad.
vi
USING THIS BOOK: NOTE TO THE TEACHER AND STUDENTS
This textbook is not to be seen as the final authority, but has to be discussed, debated and
questioned.Infacteachchapterinthisbookprovidesopportunityforasystematicdiscussionon
someofthemainissuesrelatingtoatopic.Itwouldbegoodiftheteacherscouldensurethatthe
chaptersarereadoutintheclassanddiscussionsconductedalongthelinessuggested.
Thelanguageofthetext:Effortshavebeentakentowritethetextofthisbookinchildfriendly
manner.Howevertherearecertaintermsandjargonsthatwillneedexplanationandclarification.
Textisoftentryingtogiveexamplesthatmaybesuitabletotheconceptthatisdiscussed.Each
chapter has central ideas, these are often provided as subheadings. In a classroom, you may be
abletocover2or3subheadingsinaperiodroughly.
Thistextbookusesdifferentstyleofwriting,sometimestheyarenarrativeslikeNarasimhaand
Rajeshwari in chapter 3, to make the students understand the difference between both of them
withregardtotheirlivelihoodandworkingconditions.Thesenarrativesreflectthefactsexistingin
the society. In chapter 9, the students understand the economy of a village by reading the case
studyofRampurVillageandcomparetheactivitiesdiscussedherewiththeirownvillageeconomy.
There are also some tables, graphs like pie charts, bar graphs in chapters 6, 8, 9, 11 and 12.
Theseareforanalysisanddiscussionsoastocometoaconclusionondifferentissues.
Inearlierclasses,youhavecomeacrossnaturaldisastersandafewActsonWomenProtection,
a little bit about RTI and RTE.This year you could try to know the role and responsibility of
citizensaswellasthedepartmentsofthegovernmentbyreadingchapter22onRighttoInformation
Act.
Useofinbetweenquestionsandendtextquestions:Youwillnotethattherearequestionsin
between the text. Do not leave out these questions. These are integral to the teaching learning
process. These questions are of different types – some of them help you to recap, summare,
evaluatingimportantideasfromthepassagesthatyoumayhavereadout.Ortheyareforcollecting
moreinformationthatisaroundtheconceptsdiscussedintheprevioustopicorsub-topic.Donot
trytodictatetheanswerstothesequestions,allowthestudentstofindtheanswersontheirown.
Allowthemtohavediscussionsamongsteachotherintryingtofigureoutthemeaningofthese
questionsandtalkaboutpossibleanswers.
There are different types of questions used in the book:
They (i) ask students to write their experiences; (ii) compare their experiences with that of the
examplesgiveninthetext;(iii)comparetwoorthreedifferentsituationsgiveninthetextbooks;(iv)
arequestionsthataskstudentstogivetheiropinionaboutthesituationorcasestudy(whenthese
opinionsareaskeditneednotbethesameforallchildren,allowthemtoexpresstheiropinion)
and(v)evaluateaparticularsituationgiveninthechapter.
vii
Free distribution by A.P. Government
We would like to acknowledge contributions of following individuals
in various ways for different sections in of the book. KJ Joy SOPPECOM
Pune, Dr. Ramani Atkuri Medical Practitioner Bhopal, Dr.Homen Thangjam
Manipur University, Dr.Ajai Niumai Hyderabad Central University, Ranjan
Rao Yerdoor Bangalore, and K. Bhagya Lakshmi Manchi Pustakam
Hyderabad. We also acknowledge few passages from NCERT textbooks and
illustrations drawn by Dr. Karen Haydoc. Some of the photographs used in
the book are taken from flickr, wikipedia or other internet sources, under
creative commons license as on 1 Dec 2013.
ACKNOWLEDGEMENT
Teacher may adopt different strategies in using these questions in the classroom. Some
questionsmaybewrittendowninthenotebook;othersmaybediscussedinsmallgroups;
afewmaybewrittenasindividualtasks.Inallsituationsitisimportanttoencouragethe
studenttowriteinherorhisownwords.Avoidinstructingallchildrentowritetheanswers
insamestyleandstructure.
Therearecertainboxesinthechapters.Theseareoftenadditionalinformationonthe
concepts discussed in the chapter. It is important to discuss them in the classroom, and
conducttheactivitiesaround,butdonotincludethemforyoursummativeevaluation.
Images used in the textbooks:We have also tried to use different styles of images like
photographs,linedrawings,cartoonsandpostersetc.Theseare takenfromdifferenthistorical
pointsoftimeandfromdifferentsources.Hencejustasdifferentstylesusedintextbooks
there is diversity in the images too. Many of the pictures have questions along with the
captions–thesemaybediscussedintheclassastheywillhelpyoutodrawtheattentionof
studentsonthesignificanceofimages.
Maps, tables and graphs: Maps in these books tell us about geographic, economic,
politicalandhistoricalaspects.Theyareusedtopresenttheinformationinaninteresting
manner.You will also find the use of tables and graphs. Reading tables and graphs are
essentialinSocialStudies.Theseoftenprovidemuchmoreclarityinexplainingtheconcepts.
Projects:Therearedifferentprojectssuggestedinthebook.Itmaynotbepossibleforall
projectstobeundertaken.Itisimportanttorememberthatwecannotteachallaspectsof
conceptsmerelybyreadingtextbook.Projectsthusenablestudentstointeractwithmembers
of the society, collect new information, arrange and present them in their own manner.
Makingquestionsforaninterview,planningforavisittothebank,orcreatingapresentation
thatcouldincludeimages,tabulateddataorgraphsbasedontheinformationtheycollected
are also important in acquiring Social Studies skills. These encourage children to work
togetheringroupsandconductexchangeandshareideas.
ACADEMIC STANDARDS
Time should be spent in making sure that children comprehend the passages given in
text. In between questions are useful in this context. These questions are of different types
that would include the aspects reasoning, cause and effect, justification, mind mapping /
concept mapping, observation, analysis, thinking and imagination, reflection, interpreting
etc. The key concepts have been discussed subconceptwise in every chapter with examples
and also given in the form of keywords.
1) Conceptual understanding: Promoting learning of basic concepts through inquiry, discussion,
reflection giving examples through case studies interpreting, observation etc.
2) Reading the text (given), understanding and interpretation : Occasionally there are case
studies about farmers, labourers in factory, or images that are used in text which do not
directly convey the concept. Time should be given for children to grasp the main ideas,
interpret images etc.
3) Information skills: Textbooks alone cannot cover all different aspects of social studies
methodology. For example children living in an urban area can collect information regarding
their elected representatives or children living in the rural area can collect information
about the way irrigation / tank facilities are made available in their area. These information
may not exactly match with that of the textbooks and will have to be clarified. Representing
the information that they have collected through projects are also an important ability. For
example if they collect information about a tank – they may decide to draw an illustration or
map etc along with written material. Or represent the information collected through images
or posters. Information skill includes, collection of informatic tabulation / records and
analysis.
4) Reflection on contemporary issues and questioning: Students need to be encouraged to
compare their living conditions along with that of different regions or people from different
times. There may not be a single answer to these situations of comparison. Giving reasons
for certain happening process and justification of informatic and interpretative.
5) Mapping skills: There are different types of maps and pictures used in the textbook.
Developing ability related to maps as abstract representation of places are important. There
are different stages of developing this ability, from creating a map of their classroom to
understanding height, distance as represented in a map. There are illustrations, posters and
photographs used in the textbook, these images often relate to the text and are not merely
for visual effect. Sometimes there are activities like write a caption or read the images that
are about architecture etc.
6) Appreciation and Sensitivity: Our country has vast diversity in terms of language, culture,
caste, religion, gender etc. Social studies does take into consideration these different aspects
and encourages students to be sensitive to these differences.
viii
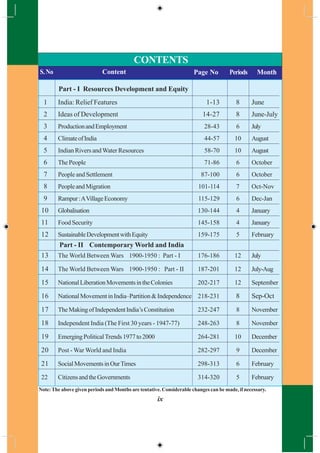
PeriodsS.No Content Page No Periods Month
Part - I Resources Development and Equity
1 India: Relief Features 1-13 8 June
2 Ideas of Development 14-27 8 June-July
3 ProductionandEmployment 28-43 6 July
4 ClimateofIndia 44-57 10 August
5 Indian Rivers andWater Resources 58-70 10 August
6 The People 71-86 6 October
7 PeopleandSettlement 87-100 6 October
8 PeopleandMigration 101-114 7 Oct-Nov
9 Rampur:AVillageEconomy 115-129 6 Dec-Jan
10 Globalisation 130-144 4 January
11 Food Security 145-158 4 January
12 SustainableDevelopmentwithEquity 159-175 5 February
Part - II Contemporary World and India
13 The World Between Wars 1900-1950 : Part - I 176-186 12 July
14 The World Between Wars 1900-1950 : Part - II 187-201 12 July-Aug
15 NationalLiberationMovementsintheColonies 202-217 12 September
16 NationalMovementinIndia–Partition&Independence 218-231 8 Sep-Oct
17 TheMakingofIndependentIndia’sConstitution 232-247 8 November
18 Independent India (The First 30 years - 1947-77) 248-263 8 November
19 EmergingPoliticalTrends1977to2000 264-281 10 December
20 Post - War World and India 282-297 9 December
21 SocialMovementsinOurTimes 298-313 6 February
22 CitizensandtheGovernments 314-320 5 February
CONTENTS
Note:The above given periods and Months are tentative. Considerable changes can be made, if necessary.
ix
x
OUR NATIONAL ANTHEM
- Rabindranath Tagore
Jana gana mana adhinayaka Jaya he
Bharatha bhagya-vidhata
Punjab Sindh Gujaratha Maratha
Dravida Utkala Banga.
Vindhya Himachala Yamuna Ganga
Uchchala Jaladhi taranga,
Tava shubha name jage
Tava shubha asisha mage
Gahe tava jaya gatha
Jana gana mangala-dayaka jaya he,
Bharatha bhagya –vidhatha,
Jaya he, jaya he, jaya he,
Jaya jaya jaya jaya he
WE, THE PEOPLE OF INDIA, having Solemnly resolved to constitute India
into a SOVEREIGN, SOCIALIST, SECULAR, DEMOCRATIC REPUBLIC and to
secure to all its citizens:
JUSTICE, Social, economic and political; LIBERTY of thought, expression, belief,
faith and worship; EQUALITY of status and of opportunity; And to promote among
them all FRATERNITY assuring the dignity of the individual and the unity and integrity
of the nation;
IN OUR CONSTITUENT ASSEMBLY This twenty-sixth day of November,
1949, do HEREBY ADOPT, ENACT AND GIVE TO OURSELVES THIS
CONSTITUTION.
PREAMBLE OF THE CONSTITUTION
PLEDGE
“India is my country; all Indians are my brothers and sisters.
I love my country, and I am proud of its rich and varied heritage.
I shall always strive to be worthy of it.
I shall give my parents, teachers and all elders respect,
and treat everyone with courtesy. I shall be kind to animals.
To my country and my people, I pledge my devotion.
In their well-being and prosperity alone lies my happiness.”
Free distribution by A.P. Government 1
CHAPTER
1India - Relief Features
In this chapter we shall study about relief features of India. In the subsequent
chapters such as Climate in India; Rivers and Water Resources; The People etc we
would be examining the linkages with relief features. These features are a reference
point that we would need to return often during the course of this book. What are
the relief features of Andhra Pradesh that you have read about in earlier classes?
Explain with the help of a wall map or your atlas. As you study further use the
atlas, wall maps & raised relief maps that are in the school.
Location
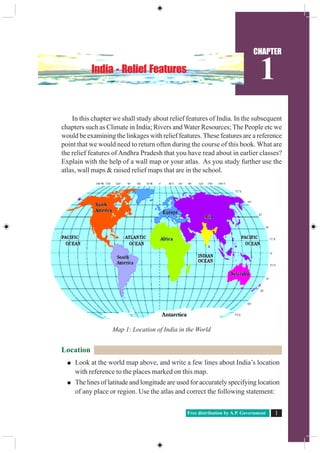
Look at the world map above, and write a few lines about India’s location
with reference to the places marked on this map.
The lines of latitude and longitude are used for accurately specifying location
of any place or region. Use the atlas and correct the following statement:
Map 1: Location of India in the World
Social Studies2 India Relief Features
“India is a very extensive country and lies totally in the southern Hemisphere
of the globe. The country’s mainland lies between 8 degree N and 50 degree
N longitude and 68 degree S and 9 degree E latitude.”
Why do we often use the term “Indian peninsula”?
Examine the map 1.1 above and imagine that India is located in the Arctic
Circle. How your life would be different?
Identify Indira point on the atlas. What is special about this?
Andhra Pradesh lies between ……..and ……..N latitudes, and …… and …..
E longitudes.
Using the scale given in your atlas estimate the length of the coast line for
Andhra Pradesh.
The geographical location of India provides its vast diversity in climatic
conditions. This has led to a variety of vegetation and life forms along with
advantages for growing many kinds of crops. Its long coast line and location in the
Indian Ocean enabled trade routes as well as fishing.
In class IX you had read about longitudes and question of time and travel. From
your atlas examine the Indian longitudinal
extension. For India the central longitude
82°30` E is taken as Standard Meridian
which passes near Allahabad. This is the
referenceforIndianStandardTime(IST)and
this is 5½ hours ahead of Greenwich Mean
Time(GMT).
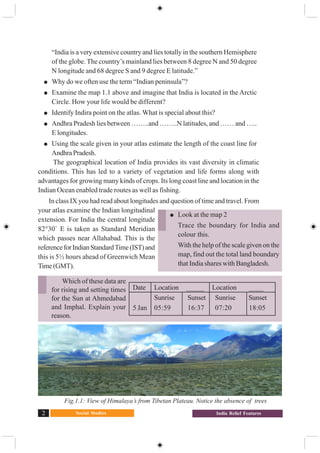
Fig.1.1: View of Himalaya’s from Tibetan Plateau. Notice the absence of trees
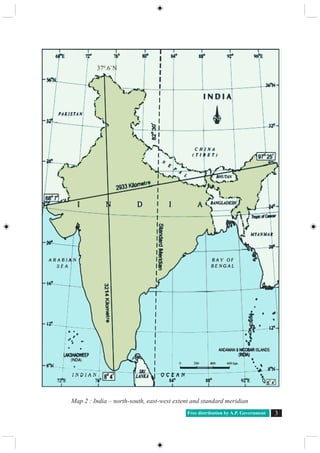
Look at the map 2
Trace the boundary for India and
colour this.
With the help of the scale given on the
map, find out the total land boundary
that India shares with Bangladesh.
Date Location _____ Location ____
Sunrise Sunset Sunrise Sunset
5 Jan 05:59 16:37 07:20 18:05
Which of these data are
for rising and setting times
for the Sun at Ahmedabad
and Imphal. Explain your
reason.
Free distribution by A.P. Government 3
Map 2 : India – north-south, east-west extent and standard meridian
370
.6`N
Social Studies4 India Relief Features
Geological background
Re-read movement of the Earth’s crust from the class IX book. Indian
landmass as part of Gondwana land originated due to geological formations and
several other processes like weathering, erosion and deposition. These processes,
over millions of years, have created and modified the physical features as they
appear to us today.
World land forms originated from two giant lands namely Angara land
(Laurasia) and Gondwana land. The Indian peninsula was part of Gondwana land.
Over 200 million years ago Gondwana land split into pieces and the peninsular
Indian plate moved towards North-East and collided the much larger Eurasian Plate
(Angara land). Owing to the collision and immense compression force mountains
evolved through a folding process over millions of years. The present form of the
Himalayas is a result of this process.
The breaking off from the northern corners of the peninsular plateau led
to the formation of a large Basin. In course of time, this basin slowly got filled
with sediments deposited by the Himalayan rivers from north and peninsular rivers
form south. This created the
very extensive, flat northern
plains of India. The Indian
landmass displays great relief
variations. The peninsular
plateau is one of the most
ancient land blocks on the
earth’s surface.
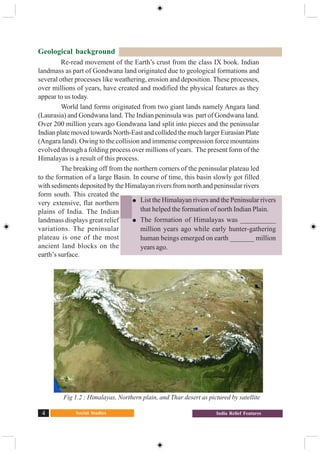
Fig 1.2 : Himalayas, Northern plain, and Thar desert as pictured by satellite
List the Himalayan rivers and the Peninsular rivers
that helped the formation of north Indian Plain.
The formation of Himalayas was __________
million years ago while early hunter-gathering
human beings emerged on earth _______ million
years ago.
Free distribution by A.P. Government 5
Major Relief divisions
The relief divisions of Indian landmass can be divided into the following groups:
1. The Himalayas 2. The Indo-Gangetic Plain
3. The Peninsular Plateau 4. The Coastal plains
5. The Desert 6. The Islands.
The Himalayas
The Himalayan ranges run in the west-east direction in the form of an arch with
a distance of about 2400 kms. Their width differs from 500 kms, in the western
regions to 200 kms in central and eastern regions. It is broader in western region.
There are also altitudinal variations across the regions. The Himalayas comprise
three parallel ranges. These ranges are separated with deep valleys and extensive
plateaus.
The northern most range is known as Greater Himalayas or Himadri. This range
is the most continuous consisting of the highest peaks with an average elevation of
about 6100 mts above mean sea level.
Greater Himalayas are composed of snow and ice cover.You find glaciers here.
The seasonal cycle of accumulation of ice, movement and melting of glaciers are
the sources for the perennial rivers. The portion of range found south of the Greater
Himalayas is called “Lesser Himalayas” which has the most rugged relief. These
ranges are mainly composed of highly compressed rocks. The height ranges from
3,700 to 4,500 mts. The Pirpanjal and
Mahabharata ranges form the important
ranges of this region.
The Lesser Himalaya ranges consist of
the famous valley of Kashmir, the
Kangra and Kulu in Himachal
Pradesh. This region is well known
for many hill stations like Simla,
Mussorie, Nainital, Raniket etc., and
covered by evergreen forests.
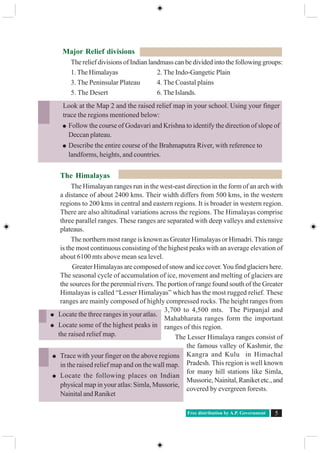
Look at the Map 2 and the raised relief map in your school. Using your finger
trace the regions mentioned below:
Follow the course of Godavari and Krishna to identify the direction of slope of
Deccan plateau.
Describe the entire course of the Brahmaputra River, with reference to
landforms, heights, and countries.
Trace with your finger on the above regions
in the raised relief map and on the wall map.
Locate the following places on Indian
physical map in your atlas: Simla, Mussorie,
Nainital and Raniket
Locate the three ranges in your atlas.
Locate some of the highest peaks in
the raised relief map.
Social Studies6 India Relief Features
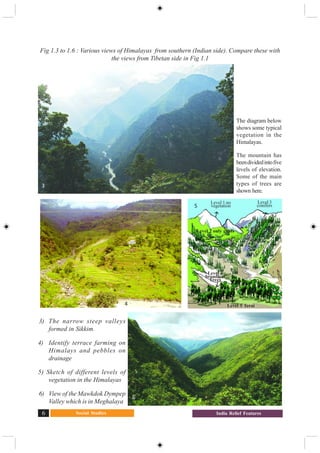
3) The narrow steep valleys
formed in Sikkim.
4) Identify terrace farming on
Himalays and pebbles on
drainage
5) Sketch of different levels of
vegetation in the Himalayas
6) View of the Mawkdok Dympep
Valley which is in Meghalaya
Fig 1.3 to 1.6 : Various views of Himalayas from southern (Indian side). Compare these with
the views from Tibetan side in Fig 1.1
4
6
The diagram below
shows some typical
vegetation in the
Himalayas.
The mountain has
beendividedintofive
levels of elevation.
Some of the main
types of trees are
shown here.
Level 1 no
vegetation
Level 2 only grass
Level 3
conifers
Level 4
broadleaf
Trees
Level 5 Terai
3
5
Free distribution by A.P. Government 7
The southern most range of the Himalayas are theShivaliks. Shivaliks extend
over a width of 10-50 kms, and have an altitude varying between 900 and 1100 mts.
These ranges are called by different names in different regions: Jammu hills in
Jammu region; Mishmi hills in Arunachal Pradesh; Cachar in Assom; etc. These
parts consist of thick gravel and alluvium. The valleys lying between the Lesser
Himalaya and Shivalik ranges are called as Duns - Dehradun, Kotli Dun and Patli
Dun are some of the prominent Duns.
The eastern most boundary of the Himalayas is the Brahmaputra valley. In
Arunachal Pradesh beyond the Dihang valley, the Himalayas take hair pin bend to
the south and act as eastern boundary of India and run through the north eastern
states. These divisions are known as ‘Purvanchal’ and mostly composed of
sedimentary sand stones. Regionally the Purvanchal are known as Patkai hills, the
Naga hills, Manipuri hills, Khasi and Mizo hills.
The formation of the Himalayas influences the climate in various ways. These
act as barriers protecting the great plains of India from the cold winds of central
Asia during severe winter.The Himalayas are reason for summer rains and monsoon
type climate in regions that are beyond the western ghats of India. In its absence
this region would have remained drier.The Himalayan Rivers have a perennial flow
since these are fed by the glaciers and bring a lot of silt, making these plains very
fertile.
The Indo-Gangetic Plain
The interaction of the three Himalayan rivers, Indus, Ganga and Brahmaputra
andtheirtributariesresultedintheformationofgreatnorthernplain.Inthebeginning
(about 20 million years ago) it was a shallow basin that was gradually filled with
varied alluvial soil that these rivers brought from the Himalayas.
The Indo-Gangetic Plains broadly consists of three divisions.
1. The Western Part 2. The Central Part 3. The Eastern Part
1) The western part was formed by the Indus and its tributaries, the Jhelum, the
Chenab, the Ravi, the Beas and the Sutlej flowing from the Himalayas. Most of the
Indus river basin is located in Pakistan leaving minor portion of Punjab and Haryana
plains in India. In this region the ‘Doab’ features dominate the fertile land between
the two rivers.
Locate the following ranges in Indian physical map of yourAtlas
Hills State/ states
Purvanchal
Patkai
Naga hills
Manipuri hills
Social Studies8 India Relief Features
2) The central part is known as the Ganga plain. It extends from the rivers
Ghaggar to Teesta. This part is mainly spread in the states of Uttar Pradesh, Bihar
and partly in Haryana, Jharkhand and West Bengal. Here the river Ganga,Yamuna
and their tributaries Sone, Kosi etc drain.
3) The Eastern part of the plain exists mostly in the Brahmaputra valley of
Assom and the river Brahmaputra is mainly responsible for its formation.
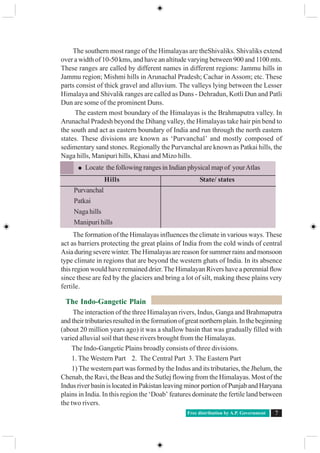
The Himalayan rivers while flowing down deposit gravel and pebble sediments
in a narrow belt of 8 to 16 kms width found parallel to foot hills of Shivaliks. This
feature is known as ‘Bhabar’. Bhabar is porous in nature. Small rivers and streams
flow underground through Bhabar and reappear in lower areas and form a swampy
and marshy region called Terai. The region had thick forest and rich variety of wild
life. However, owing to migrations at the time of India’s partition, most of the
Terai zone has now been cleared and used for agricultural operations. South of the
Terai region, fine alluvial plain regions are found.
Fig : 1.7 Cross Section of Northern Platau, the Gangetic plain, and the Himalaya’s
Fig 1.8 : A Village on the Brahmaputra Valley in Assom
The Himalayas
The Gangetic plains
Central Highlands
Fig 1.7 : Block diagram of Central Highlands,
Gangetic plains, Himalayas
Free distribution by A.P. Government 9
The Peninsular Plateau
The Indian plateau is also known as the peninsular plateau as it is surrounded
by the sea on three sides. It is mainly composed of the old crystalline, hard igneous
and metamorphic rock. Large amounts of metallic and non metallic mineral
resources are found in the Indian plateau. It has broad and shallow valleys with
rounded hills. The topography of the plateau is slightly tilted towards east and the
Western and Eastern Ghats form the western and eastern edges respectively. The
southernmost tip of the plateau is Kanyakumari.
The peninsular plateau consists of two broad divisions namely, the central
highlands(Malwaplateau)andtheDeccanPlateau.OnphysicalmapofIndia,adjunct
to and south of the Gangetic plains and north of the river Narmada you can identify
central highlands. Prominent plateaus here are Malwa plateau on the western side
and towards the east there is the Chhotanagapur plateau. In comparison to the
Gangetic plains the plateau region is dry.The rivers are not perennial.The irrigation
for the second crop depends on deep tube wells and tanks. Identify rivers that flow
in the Northern side of central high lands. Chhotanagpur plateau is rich mineral
resources.
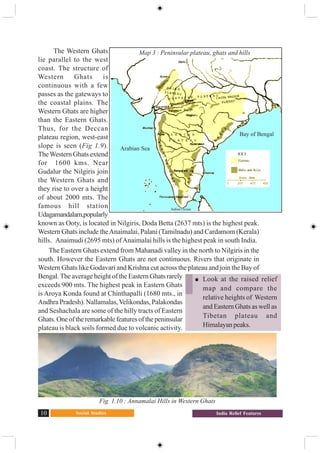
The portion of peninsular plateau lying to the south of Narmada, a triangular
landmass, is called the Deccan plateau. Satpura range forms the Deccan plateau’s
north edge while the Mahadev, the
Kaimur range and a portion of
Maikal range are the eastern edges.
Western Ghats, Eastern Ghats and
Nilgiris form western, eastern and
southern boundaries respectively.
Fig 1.9 : Block diagram of Peninsular plateau
Western
Coastal plain
Western
Ghats
Deccan Plateau Eastern
Ghats
Eastern coastal
plain
Locate the following on the Indian physical
mapof youratlasandontheraisedreliefmap:
Malwa plateau, Bundelkhand, Bhagelkhand,
Rajamahal Hills and Chhotanagapur plateau
Using an atlas compare the relative heights
of above plateaus with that ofTibetan plateau
Social Studies10 India Relief Features
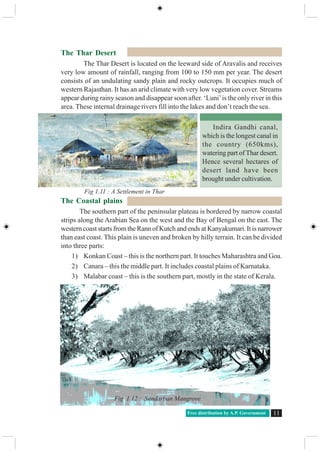
The Western Ghats
lie parallel to the west
coast. The structure of
Western Ghats is
continuous with a few
passes as the gateways to
the coastal plains. The
Western Ghats are higher
than the Eastern Ghats.
Thus, for the Deccan
plateau region, west-east
slope is seen (Fig 1.9).
TheWestern Ghats extend
for 1600 kms. Near
Gudalur the Nilgiris join
the Western Ghats and
they rise to over a height
of about 2000 mts. The
famous hill station
Udagamandalam,popularly
known as Ooty, is located in Nilgiris, Doda Betta (2637 mts) is the highest peak.
Western Ghats include theAnaimalai, Palani (Tamilnadu) and Cardamom (Kerala)
hills. Anaimudi (2695 mts) ofAnaimalai hills is the highest peak in south India.
The Eastern Ghats extend from Mahanadi valley in the north to Nilgiris in the
south. However the Eastern Ghats are not continuous. Rivers that originate in
Western Ghats like Godavari and Krishna cut across the plateau and join the Bay of
Bengal. The average height of the Eastern Ghats rarely
exceeds 900 mts. The highest peak in Eastern Ghats
is Aroya Konda found at Chinthapalli (1680 mts., in
Andhra Pradesh). Nallamalas,Velikondas, Palakondas
and Seshachala are some of the hilly tracts of Eastern
Ghats.Oneoftheremarkablefeaturesofthepeninsular
plateau is black soils formed due to volcanic activity.
Fig 1.10 : Annamalai Hills in Western Ghats
Look at the raised relief
map and compare the
relative heights of Western
and Eastern Ghats as well as
Tibetan plateau and
Himalayanpeaks.
Map 3 : Peninsular plateau, ghats and hills
Arabian Sea
Indian Ocean
Bay of Bengal
Free distribution by A.P. Government 11
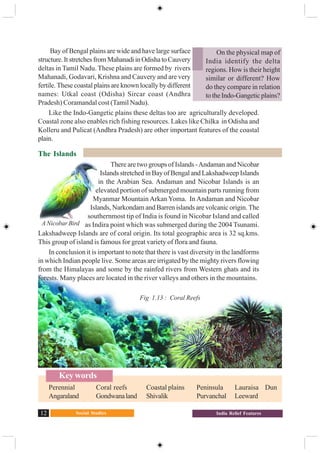
The Thar Desert
The Thar Desert is located on the leeward side of Aravalis and receives
very low amount of rainfall, ranging from 100 to 150 mm per year. The desert
consists of an undulating sandy plain and rocky outcrops. It occupies much of
western Rajasthan. It has an arid climate with very low vegetation cover. Streams
appear during rainy season and disappear soon after. ‘Luni’is the only river in this
area. These internal drainage rivers fill into the lakes and don’t reach the sea.
The Coastal plains
The southern part of the peninsular plateau is bordered by narrow coastal
strips along the Arabian Sea on the west and the Bay of Bengal on the east. The
western coast starts from the Rann of Kutch and ends at Kanyakumari. It is narrower
than east coast. This plain is uneven and broken by hilly terrain. It can be divided
into three parts:
1) Konkan Coast – this is the northern part. It touches Maharashtra and Goa.
2) Canara – this the middle part. It includes coastal plains of Karnataka.
3) Malabar coast – this is the southern part, mostly in the state of Kerala.
Indira Gandhi canal,
which is the longest canal in
the country (650kms),
watering part of Thar desert.
Hence several hectares of
desert land have been
brought under cultivation.
Fig 1.11 : A Settlement in Thar
Fig 1.12 : Sundarban Mangrove
Social Studies12 India Relief Features
On the physical map of
India identify the delta
regions. How is their height
similar or different? How
do they compare in relation
totheIndo-Gangeticplains?
Bay of Bengal plains are wide and have large surface
structure.ItstretchesfromMahanadiinOdishatoCauvery
deltas in Tamil Nadu. These plains are formed by rivers
Mahanadi, Godavari, Krishna and Cauvery and are very
fertile. These coastal plains are known locally by different
names: Utkal coast (Odisha) Sircar coast (Andhra
Pradesh) Coramandal cost (Tamil Nadu).
Like the Indo-Gangetic plains these deltas too are agriculturally developed.
Coastal zone also enables rich fishing resources. Lakes like Chilka in Odisha and
Kolleru and Pulicat (Andhra Pradesh) are other important features of the coastal
plain.
The Islands
There are two groups of Islands -Andaman and Nicobar
Islands stretched in Bay of Bengal and Lakshadweep Islands
in the Arabian Sea. Andaman and Nicobar Islands is an
elevated portion of submerged mountain parts running from
Myanmar Mountain Arkan Yoma. In Andaman and Nicobar
Islands, Narkondam and Barren islands are volcanic origin. The
southernmost tip of India is found in Nicobar Island and called
as Indira point which was submerged during the 2004 Tsunami.
Lakshadweep Islands are of coral origin. Its total geographic area is 32 sq.kms.
This group of island is famous for great variety of flora and fauna.
In conclusion it is important to note that there is vast diversity in the landforms
in which Indian people live. Some areas are irrigated by the mighty rivers flowing
from the Himalayas and some by the rainfed rivers from Western ghats and its
forests. Many places are located in the river valleys and others in the mountains.
Fig 1.13 : Coral Reefs
Key words
Perennial Coral reefs Coastal plains Peninsula Lauraisa Dun
Angaraland Gondwanaland Shivalik Purvanchal Leeward
A Nicobar Bird
Free distribution by A.P. Government 13
Improveyourlearning
1. The sun rises two hours earlier inArunachal Pradesh as compared to Gujarat in the
west. But the Clocks show the same time. How does this happen?
2. If the Himalayas would have not been in its present position how would be the
climatic conditions of the Indian sub continent?
3. The Himalayas do not extend into which of the following states:
Madhya Pradesh, Uttar Pradesh, Sikkim, Haryana, Punjab, Uttaranchal
4. Which are the major physiographic divisions of India? Contrast the relief of the
Himalayan region with that of the peninsular plateau.
5. What is the influence of the Himalayas on Indian agriculture?
6. Indo- Gangetic plains have high density of population. Find the reasons.
7. On an outline map of India show the following:
(i) Mountain and hill ranges – the Karakoram, the Zaskar, the Patkai Bum, the
Jaintia, the Vindhya range, theAravali, and the Cardamom hills.
(ii) Peaks – K2, Kanchenjunga, Nanga Parbat and theAnaimudi.
(iii)Plateaus - Chotanagapur and Malwa
( iv)The Indian Desert, Western Ghats, Lakshadweep Islands
8. Use an atlas and identify the following:
(i) The Islands formed due to Volcanic eruption.
(ii) The countries constituting Indian Subcontinent.
(iii) The states through which the Tropic of Cancer passes.
(iv) The northernmost latitude in degrees.
(v) The southernmost latitude of the Indian mainland in degrees.
(vi) The eastern and the western most longitudes in degrees.
(vii) The place situated on the three seas.
(viii)The strait separating Sri Lanka from India.
(ix) The Union Territories of India.
9. How are the Eastern coastal plains and western coastal plains similar or different ?
10. Plateau regions in India do not support agriculture as much as the plain regions –
what are the reasons for this?
Project
Using the raised relief map, and physical maps in your atlas make clay/ sand models
of India on the ground. Use different types of sand or soil to mark different types of relief
features. Ensure heights of the places are proportional and rivers are marked. Look at the
vegetation map in your atlas and try to use leaves and grasses to decorate them. May be
over the year you can also add other features of India into them.
Social Studies14 Ideas of Development
CHAPTER
2
We have aspirations about what we
would like to do and how we would like
to live. Similarly, we have ideas about
what a country should be like. What are
the essential things that we require? Can
life be better for all? Can there be more
equality? Development involves
thinkingaboutthesequestionsandabout
the ways in which we can work towards
achieving these goals. This is a complex
task and in this chapter we shall make a
beginning at understanding
development.
What Development Promises –
Different People, Different Goals
Let us try to imagine what
development or progress is likely to
mean to different persons listed in
Table 1.What are their aspirations?You
will find that some columns are partially
filled. Try to complete the Table. You
can also add any other category of
persons.
Ideas of Development
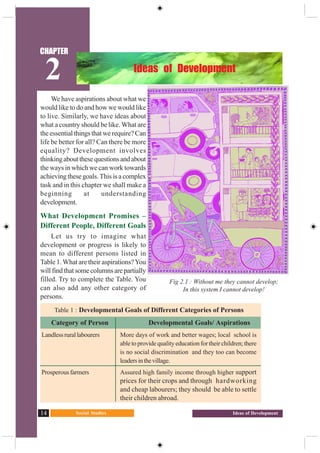
Fig 2.1 : Without me they cannot develop;
In this system I cannot develop!
Table 1 : Developmental Goals of Different Categories of Persons
Category of Person Developmental Goals/ Aspirations
Landlessrurallabourers More days of work and better wages; local school is
able to provide quality education for their children; there
is no social discrimination and they too can become
leadersinthevillage.
Prosperous farmers Assured high family income through higher support
prices for their crops and through hardworking
and cheap labourers; they should be able to settle
their children abroad.
Free distribution by A.P. Government 15
Having filled Table 1, let us now examine it. Do all these persons have the
same notion of development or progress? Most likely not. Each one of them
seeks different things. They seek things that are most important for them, i.e.,
that which can fulfil their aspirations or desires. In fact, at times, two persons or
groups of persons may seek things which are conflicting. Agirl expects as much
freedom and opportunity as her brother and that he also shares in the household
work. Her brother may not like this. Similarly, to get more electricity,
industrialists may want more dams. But this may submerge the land and disrupt
the lives of people
who are displaced
such as the tribals.
They might resent
this and may just
want small check
dams or tanks to
irrigate their land.
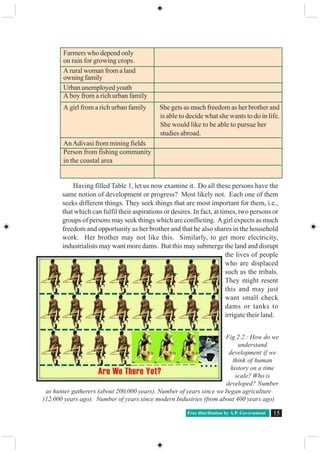
Fig 2.2 : How do we
understand
development if we
think of human
history on a time
scale? Who is
developed? Number
as hunter gatherers (about 200,000 years). Number of years since we began agriculture
(12,000 years ago). Number of years since modern Industries (from about 400 years ago)
Farmers who depend only
on rain for growing crops.
A rural woman from a land
owning family
Urban unemployed youth
A boy from a rich urban family
A girl from a rich urban family She gets as much freedom as her brother and
is able to decide what she wants to do in life.
She would like to be able to pursue her
studies abroad.
AnAdivasi from mining fields
Person from fishing community
in the coastal area
Are We There Yet?
○ ○ ○ ○
Social Studies16 Ideas of Development
Whose Development ?
If even the idea of what
constitutes development
can be varied and
conflicting, then certainly
there can be differences
about ways of developing.
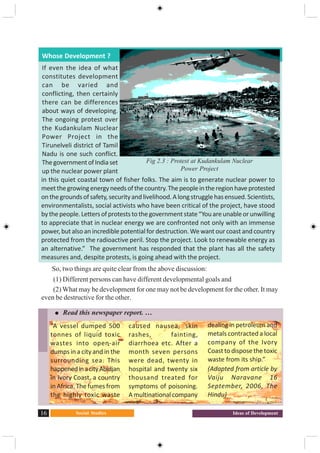
The ongoing protest over
the Kudankulam Nuclear
Power Project in the
Tirunelveli district of Tamil
Nadu is one such conflict.
ThegovernmentofIndiaset
up the nuclear power plant
in this quiet coastal town of fisher folks. The aim is to generate nuclear power to
meetthegrowingenergyneedsofthecountry.Thepeopleintheregionhaveprotested
onthegroundsofsafety,securityandlivelihood.Alongstrugglehasensued.Scientists,
environmentalists, social activists who have been critical of the project, have stood
bythepeople.Lettersofproteststothegovernmentstate“Youareunableorunwilling
to appreciate that in nuclear energy we are confronted not only with an immense
power,butalsoanincrediblepotentialfordestruction.Wewant ourcoastandcountry
protected from the radioactive peril. Stop the project. Look to renewable energy as
an alternative.” The government has responded that the plant has all the safety
measures and, despite protests, is going ahead with the project.
So, two things are quite clear from the above discussion:
(1) Different persons can have different developmental goals and
(2) What may be development for one may not be development for the other. It may
even be destructive for the other.
Fig 2.3 : Protest at Kudankulam Nuclear
Power Project
Read this newspaper report. …
“A vessel dumped 500
tonnes of liquid toxic
wastes into open-air
dumps in a city and in the
surrounding sea. This
happenedinacityAbidjan
in Ivory Coast, a country
in Africa. The fumes from
the highly toxic waste
caused nausea, skin
rashes, fainting,
diarrhoea etc. After a
month seven persons
were dead, twenty in
hospital and twenty six
thousand treated for
symptoms of poisoning.
A multinational company
dealing in petroleum and
metals contracted a local
company of the Ivory
Coasttodisposethetoxic
waste from its ship.”
(Adapted from article by
Vaiju Naravane 16
September, 2006, The
Hindu)
Free distribution by A.P. Government 17
Income and other Goals
If you go over Table 1 again, you will notice one common thing: what people
desire are regular work, better wages, and decent price for their crops or other
products that they produce. In other words, they want more income.
Besides seeking more income – one-way or the other, people also seek things
like equal treatment, freedom, security, and respect from others. They resent
discrimination. All these are important goals. In fact, in some cases, these may be
more important than more income or more consumption because material goods
are not all that you need to live. Money, or material things that one can buy with it,
are one factor on which our life depends. But the quality of our life also depends
on non-material things mentioned above. If it is not obvious to you, then just
think, of the role of your friends in your life. You may desire their friendship.
Similarly there are many things that are not easily measured but they mean a lot to
our lives. These are often ignored. Therefore, it will be wrong to conclude that
what cannot be measured is not important.
Consider another example.
If you get a job in a far off
place,youwouldtrytoconsider
many factors, apart from
income. This could be facilities
for your family, working
atmosphere or opportunity to
learn.Inanothercase,ajobmay
give you less pay but may offer
regular employment that
enhances your sense of
Now answer the following questions:
Who are the people benefited and who do not?
What should be the developmental goal for this country?
What can be some of the developmental goals for your village or town or
locality?
What are the issues of conflict between government and the people living in
regions of nuclear power plant?
Do you know of any such controversy around development projects/policies?
Find out the debates on either side.
working
near
family
reliable
pension
equal
wages
Social Studies18 Ideas of Development
security. Another job, however, may offer high pay but no job security and also
leave no time for your family. This will reduce your sense of security and freedom.
Similarly, for development, people look at a mix of goals. It is true that if
women are engaged in paid work, the family income increases and their dignity in
the household and society increases. However, it is also the case that if there is
respect for women there would be more sharing of housework and a greater
acceptance of women working outside.Asafe and secure environment may allow
more women to take up a variety of jobs or run a business.
Hence the developmental goals that people have are not only about better
income but also about other important things in life.
How to compare Different Countries or States
When we compare different things, they could have similarities as well as
differences. Which aspects do we use to compare them? Let us look at students
in the class itself. How do we compare different students? They differ in their
height, health, talents and interests. The healthiest student may not be the most
studious one. The most intelligent student may not be the friendliest one. So,
how do we compare students? The criterion we may use depends on the purpose
of comparison. We use different criteria to choose a sports team, a debate team,
a music team or a team to organise a picnic. Still, if for some purpose, we have to
choose the criteria for the all-round progress of children in the class, how do we
do it?
Usually we take one or more important characteristics of persons and compare
them based on these characteristics. For comparing countries, their income is
Why do different persons have different notions of development? Which of
the following explanations is more important and why?
a. Because people are different.
b.Because life situations of persons are different.
Do these two statements mean the same thing? Justify your answer.
a. People have different developmental goals.
b.People have conflicting developmental goals.
Give some examples where factors other than income are important aspects
of our lives.
Explain some of the important ideas of the above section in your own words.
Free distribution by A.P. Government 19
considered to be one of the most important attributes. Countries with higher income
are more developed than others with less income. This is done on the understanding
that more income means more of all things that human beings need. Whatever
people like, and should have, they will be able to get with greater income. So,
greater income itself is considered to be one important goal.
Now, what is the income of a country? Intuitively, the income of the country is
the income of all the residents of the country. This gives us the total income of
the country.
However, for comparison between countries total income is not such a useful
measure. Since countries have different populations, comparing total income will
not tell us what an average person is likely to earn. Are people in one country
better off than others in a different country? Hence we compare the average
income, which is total income of the country divided by total population. The
average income is also called per capita income.
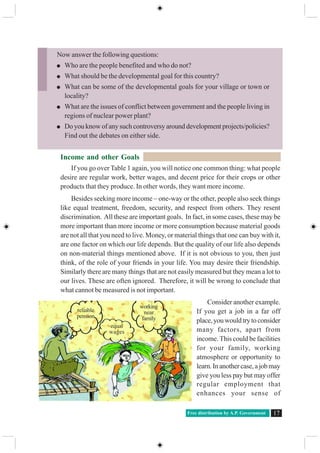
This criterion is used in World Development Report brought out by the World
Bank to classify countries. Countries with per capita income of US $12,600 and
above per annum in 2012 are called high income countries or rich countries. Those
with per capita income of US $1,035 or less per annum in 2012 are called low-
income countries. Until less than a decade ago, India came in the category of low
income countries. Now it falls under the category of middle income countries.As
the per capita income in India rose faster than that of many countries, its position
is improved. We will read more about growth of incomes of people in India in the
next chapter.
The rich countries, excluding countries of West Asia and certain other small
countries are generally called developed countries.
While ‘averages’ are useful for comparison, they also hide disparities.
For example, let us consider two countries,Aand B. For the sake of simplicity,
we have assumed that they have only five citizens each. Based on data given in
Table 2, calculate the average income for both the countries.
Table 2 Comparison of two countries
Country Monthly income of citizens in 2001 (in Rupees)
I II III IV V Average
CountryA 9500 10500 9800 10000 10200
Country B 500 500 500 500 48000
Social Studies20 Ideas of Development
Will you be equally happy to live in either of these countries?Are both equally
developed? Perhaps some of us may like to live in country B if we are assured of
being its fifth citizen but if it is a lottery that decides our citizenship number then
perhaps most of us will prefer to live in countryA. Though both the countries have
identical average income, country A is preferred because it has more equitable
distribution. In this country people are neither very rich nor extremely poor, while
most citizens in country B are poor and one person is extremely rich. Hence while
average income is useful for comparison it does not tell us how this income is
distributed among people.
Income and other criteria
When we looked at individual aspirations
andgoals,wefoundthatpeoplenotonlythink
of better income but also have goals such as
security, respect of others, equal treatment,
freedom etc in mind. Similarly, when we
think of a nation or a region, we may, besides
average income, think of other equally
important attributes.
Give three examples where an average is used for comparing situations other than
what is given here.
Why do you think average income is an important criterion for development?
Explain.
Suppose records show that the average income in a country has been increasing
over a period. From this, can we conclude that all sections of the economy have
become better? Illustrate your answer with an example.
From the text, find out the per capita income level of middle-income countries as
per World Development Report, 2012.
Write a paragraph on your notion of what India should do, or achieve, to become
a developed country.
We made the
chairs and
we use
them
Country with no rich and no poor Country with rich and poor
Table : 3 Per Capita Income per
annum of Select States
State Per Capita Income for
2012 (in rupees)
Punjab 78,000
Himachal
Pradesh 74,000
Bihar 25,000
Free distribution by A.P. Government 21
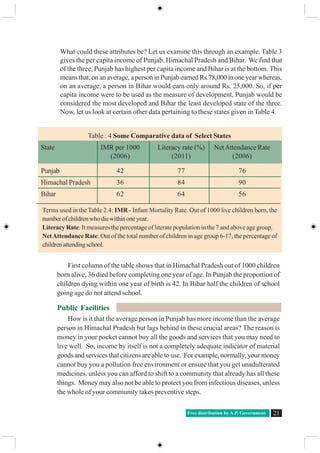
What could these attributes be? Let us examine this through an example. Table 3
gives the per capita income of Punjab, Himachal Pradesh and Bihar. We find that
of the three, Punjab has highest per capita income and Bihar is at the bottom. This
means that, on an average, a person in Punjab earned Rs.78,000 in one year whereas,
on an average, a person in Bihar would earn only around Rs. 25,000. So, if per
capita income were to be used as the measure of development, Punjab would be
considered the most developed and Bihar the least developed state of the three.
Now, let us look at certain other data pertaining to these states given in Table 4.
First column of the table shows that in Himachal Pradesh out of 1000 children
born alive, 36 died before completing one year of age. In Punjab the proportion of
children dying within one year of birth is 42. In Bihar half the children of school
going age do not attend school.
Public Facilities
How is it that the average person in Punjab has more income than the average
person in Himachal Pradesh but lags behind in these crucial areas? The reason is
money in your pocket cannot buy all the goods and services that you may need to
live well. So, income by itself is not a completely adequate indicator of material
goods and services that citizens are able to use. For example, normally, your money
cannot buy you a pollution free environment or ensure that you get unadulterated
medicines, unless you can afford to shift to a community that already has all these
things. Money may also not be able to protect you from infectious diseases, unless
the whole of your community takes preventive steps.
Table : 4 Some Comparative data of Select States
State IMR per 1000 Literacy rate (%) NetAttendance Rate
(2006) (2011) (2006)
Punjab 42 77 76
Himachal Pradesh 36 84 90
Bihar 62 64 56
Terms used in the Table 2.4: IMR - Infant Mortality Rate. Out of 1000 live children born, the
numberofchildrenwhodiewithinoneyear.
Literacy Rate: It measures the percentage of literate population in the 7 and above age group.
NetAttendance Rate: Out of the total number of children in age group 6-17, the percentage of
childrenattendingschool.
Social Studies22 Ideas of Development
Actually for many of the important things in life the best way, also the cheapest
way is to provide these goods and services collectively. Just think: will it be cheaper
to have collective security for the whole locality or for each house to have its
own security man? What if no one, other than you, in your village or locality is
interested in studying? Would you be able to study? Not unless your parents
could afford to send you to some private school elsewhere. So you are actually
able to study because many other children also want to study and because many
people believe that the government should open schools and provide other facilities
so that all children have a chance to study. Even now, in many areas, children,
particularly girls, are not able to achieve secondary level schooling because
government/ society has not provided required facilities.
Some states have lesser Infant Mortality Rate because they have adequate
provision of basic health and educational facilities. Similarly, in some states, the
Public Distribution System (PDS) functions well. If a PDS shop, i.e. ration shop,
does not function properly in such places, the people there are able to get it
rectified. Health and nutritional status of people of such states is certainly likely
to be better.
Look at data in Tables 3 and 4. Is Punjab as ahead of Bihar in literacy rate etc. as it
is in terms of per capita income?
Think of other examples where collective provision of goods and services is
cheaper than individual provision.
Does availability of good health and educational facilities depend only on amount
of money spent by the government on these facilities? What other factors could
be relevant?
For a family in rural area in Tamil Nadu and Andhra Pradesh in 2009-2010, rice
purchased from ration shops account for 53 and 33 per cent respectively. The rest
they buy from markets. In West Bengal andAssam, only 11 and 6 per cent of rice
is purchased from ration shops. Where would people be better off and why?
Human Development Report
Whenwerealisethateventhoughthelevelofincomeisimportant, itisaninadequate
measure of the level of development, we begin to think of other criterion. There could
be a long list of such criteria but then it would not be so useful. What we need is a
small number of the most important things. Health and education indicators, such as
the ones we used in comparison of Kerala and Punjab, are among them. Over the
past decade or so, health and education indicators have come to be widely used
along with income as a measure of development. For instance, Human Development
Report published by United Nations Development Programme (UNDP) compares
countries based on the educational levels of the people, their health status and per
capita income.
Free distribution by A.P. Government 23
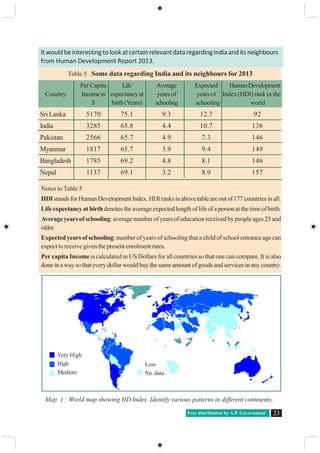
ItwouldbeinterestingtolookatcertainrelevantdataregardingIndiaanditsneighbours
from Human Development Report 2013.
Table 5 Some data regarding India and its neighbours for 2013
Per Capita Life Average Expected HumanDevelopment
Country Incomein expectancy at years of years of Index (HDI) rank in the
$ birth(Years) schooling schooling world
SriLanka 5170 75.1 9.3 12.7 92
India 3285 65.8 4.4 10.7 136
Pakistan 2566 65.7 4.9 7.3 146
Myanmar 1817 65.7 3.9 9.4 149
Bangladesh 1785 69.2 4.8 8.1 146
Nepal 1137 69.1 3.2 8.9 157
Notes to Table 5
HDIstandsforHumanDevelopmentIndex.HDIranksinabovetableareoutof177countriesinall.
Life expectancy at birthdenotes the average expected length of life of a person at the time of birth.
Average years of schooling: average number of years of education received by people ages 25 and
older.
Expected years of schooling: number of years of schooling that a child of school entrance age can
expect to receive given the present enrolment rates.
Per capita Income is calculated in US Dollars for all countries so that one can compare. It is also
done in a way so that every dollar would buy the same amount of goods and services in any country.
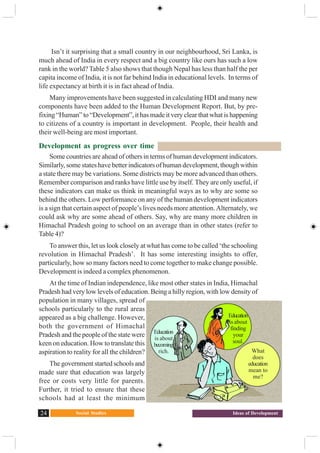
Very High
High
Medium
Low
No data
Map 1 : World map showing HD Index. Identify various patterns in different continents.
Social Studies24 Ideas of Development
Isn’t it surprising that a small country in our neighbourhood, Sri Lanka, is
much ahead of India in every respect and a big country like ours has such a low
rank in the world? Table 5 also shows that though Nepal has less than half the per
capita income of India, it is not far behind India in educational levels. In terms of
life expectancy at birth it is in fact ahead of India.
Many improvements have been suggested in calculating HDI and many new
components have been added to the Human Development Report. But, by pre-
fixing “Human” to “Development”, it has made it very clear that what is happening
to citizens of a country is important in development. People, their health and
their well-being are most important.
Development as progress over time
Some countries are ahead of others in terms of human development indicators.
Similarly, some states have better indicators of human development, though within
a state there may be variations. Some districts may be more advanced than others.
Remember comparison and ranks have little use by itself. They are only useful, if
these indicators can make us think in meaningful ways as to why are some so
behind the others. Low performance on any of the human development indicators
is a sign that certain aspect of people’s lives needs more attention.Alternately, we
could ask why are some ahead of others. Say, why are many more children in
Himachal Pradesh going to school on an average than in other states (refer to
Table 4)?
To answer this, let us look closely at what has come to be called ‘the schooling
revolution in Himachal Pradesh’. It has some interesting insights to offer,
particularly, how so many factors need to come together to make change possible.
Development is indeed a complex phenomenon.
At the time of Indian independence, like most other states in India, Himachal
Pradesh had very low levels of education. Being a hilly region, with low density of
population in many villages, spread of
schools particularly to the rural areas
appeared as a big challenge. However,
both the government of Himachal
Pradesh and the people of the state were
keen on education. How to translate this
aspiration to reality for all the children?
The government started schools and
made sure that education was largely
free or costs very little for parents.
Further, it tried to ensure that these
schools had at least the minimum
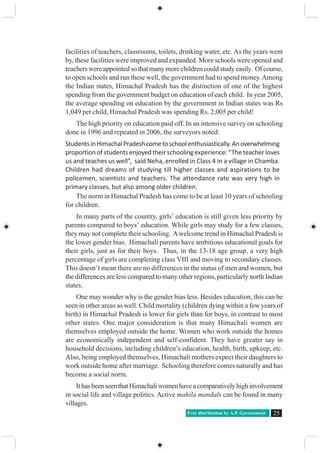
Education
is about
becoming
rich.
Education
is about
finding
your
soul.
What
does
education
mean to
me?
Free distribution by A.P. Government 25
facilities of teachers, classrooms, toilets, drinking water, etc. As the years went
by, these facilities were improved and expanded. More schools were opened and
teachers were appointed so that many more children could study easily. Of course,
to open schools and run these well, the government had to spend money.Among
the Indian states, Himachal Pradesh has the distinction of one of the highest
spending from the government budget on education of each child. In year 2005,
the average spending on education by the government in Indian states was Rs
1,049 per child, Himachal Pradesh was spending Rs. 2,005 per child!
The high priority on education paid off. In an intensive survey on schooling
done in 1996 and repeated in 2006, the surveyors noted:
StudentsinHimachalPradeshcometoschoolenthusiastically.Anoverwhelming
proportion of students enjoyed their schooling experience: “The teacher loves
us and teaches us well”, said Neha, enrolled in Class 4 in a village in Chamba.
Children had dreams of studying till higher classes and aspirations to be
policemen, scientists and teachers. The attendance rate was very high in
primary classes, but also among older children.
The norm in Himachal Pradesh has come to be at least 10 years of schooling
for children.
In many parts of the country, girls’ education is still given less priority by
parents compared to boys’ education. While girls may study for a few classes,
they may not complete their schooling. Awelcome trend in Himachal Pradesh is
the lower gender bias. Himachali parents have ambitious educational goals for
their girls, just as for their boys. Thus, in the 13-18 age group, a very high
percentage of girls are completing class VIII and moving to secondary classes.
This doesn’t mean there are no differences in the status of men and women, but
the differences are less compared to many other regions, particularly north Indian
states.
One may wonder why is the gender bias less. Besides education, this can be
seen in other areas as well. Child mortality (children dying within a few years of
birth) in Himachal Pradesh is lower for girls than for boys, in contrast to most
other states. One major consideration is that many Himachali women are
themselves employed outside the home. Women who work outside the homes
are economically independent and self-confident. They have greater say in
household decisions, including children’s education, health, birth, upkeep, etc.
Also, being employed themselves, Himachali mothers expect their daughters to
work outside home after marriage. Schooling therefore comes naturally and has
become a social norm.
IthasbeenseenthatHimachaliwomenhaveacomparativelyhighinvolvement
in social life and village politics. Active mahila mandals can be found in many
villages.
Social Studies26 Ideas of Development
Key words
PercapitaIncome; Humandevelopment; Publicfacilities; EducationandHealthindicators
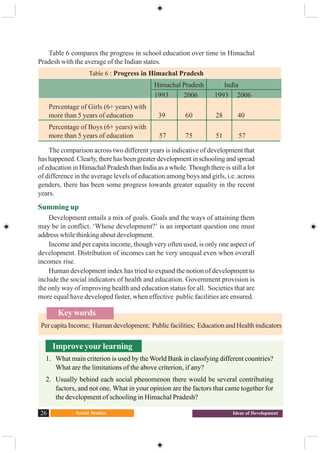
Table 6 compares the progress in school education over time in Himachal
Pradesh with the average of the Indian states.
Table 6 : Progress in Himachal Pradesh
Himachal Pradesh India
1993 2006 1993 2006
Percentage of Girls (6+ years) with
more than 5 years of education 39 60 28 40
Percentage of Boys (6+ years) with
more than 5 years of education 57 75 51 57
The comparison across two different years is indicative of development that
hashappened.Clearly,therehasbeengreaterdevelopmentinschoolingandspread
of education in Himachal Pradesh than India as a whole. Though there is still a lot
of difference in the average levels of education among boys and girls, i.e. across
genders, there has been some progress towards greater equality in the recent
years.
Summing up
Development entails a mix of goals. Goals and the ways of attaining them
may be in conflict. ‘Whose development?’ is an important question one must
address while thinking about development.
Income and per capita income, though very often used, is only one aspect of
development. Distribution of incomes can be very unequal even when overall
incomes rise.
Human development index has tried to expand the notion of development to
include the social indicators of health and education. Government provision is
the only way of improving health and education status for all. Societies that are
more equal have developed faster, when effective public facilities are ensured.
Improve your learning
1. What main criterion is used by the World Bank in classfying different countries?
What are the limitations of the above criterion, if any?
2. Usually behind each social phenomenon there would be several contributing
factors, and not one. What in your opinion are the factors that came together for
the development of schooling in Himachal Pradesh?
Free distribution by A.P. Government 27
3. In what respect is the criterion used by the UNDP for measuring development
different from the one used by the World Bank?
4. Do you think there are certain other aspects, other than those discussed in the
chapter that should be considered in measuring human development?
5. Why do we use averages? Are there any limitations to their use? Illustrate with
your own examples related to development.
6. What lessons can you draw about the importance of income from the fact that
Himachal Pradesh with lower per capita income has a better human development
ranking than Punjab?
7. Based on the figures in Table 6, fill the following:
Out of every 100 girls above 6 years of age, ___________girls had studied beyond
the primary level in Himachal Pradesh in year 1993. By year 2006, this proportion
reached ____________ out of 100. For India as a whole, the proportion of boys
who had studied beyond primary level was only _______out of 100 in year 2006.
8. What is the per capita income of Himachal Pradesh? Do you think higher incomes
can make it easier for parents to send children to school? Discuss. Why was it
necessary for government to run schools in Himachal Pradesh?
9. Why do you think parents accord less priority to girls education as compared to
boys? Discuss in class.
10. What is the relationship between women’s work outside their homes and gender
bias?
11. Right to EducationAct, 2009 (RTE) declares that all children of 6 to 14 years age
have the right to free education. And the government has to ensure building of
sufficient schools in the neighbourhood, appoint properly qualified teachers and
make all necessary provisions. In the light of what you have read in this chapter and
already know, discuss and debate the importance of this Act for (i) children, and
(ii) human development.
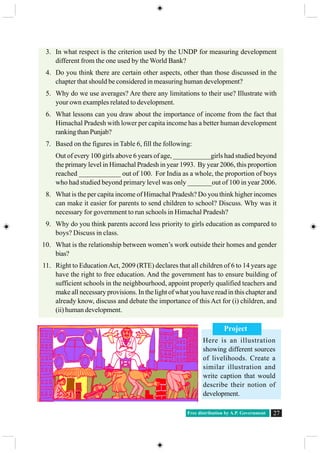
Project
Here is an illustration
showing different sources
of livelihoods. Create a
similar illustration and
write caption that would
describe their notion of
development.
Social Studies28 Production and Employment
CHAPTER
3 Production and Employment
Sectors of Economy
You may recall some of the chapters from class VIII and IX, where we
discussed how people are engaged in different activities to earn their livelihoods.
These activities are broadly categorised into three – 1) agriculture and related
activities such as fishing, forestry, mining where nature has a dominant role in
the production process; 2) manufacturing processes & other industries, where
goods are produced by people using tools or machines; and 3) those activities
that don’t directly produce a good but provide services that are required in
production and other services for people.
To recall these differences:
Classify the following list of occupations under agriculture, industry and
service sectors. Give reasons for your classification:
Occupation Classification
Tailor
Basket weaver
Flower cultivator
Milk vendor
Fishermen
Priest
Courier
India’s GDP grew only by
5 per cent in 2012-13.
The agriculture growth
also moderated, while a
slowdown was also
witnessed in
constructionandservices
.... Disappointed with the
dismal GDP figures,
Finanace Minister,
however, expressed
cautious optimism and
pointed to some signs of
recovery in some select
sectors. (The Hindu)
You may have come across such news. What is GDP that is being talked about?
What relation does it have to the sectors of the Indian economy? Let us try to
understand...
GDP growth slumps to 9 year low
Free distribution by A.P. Government 29
Gross Domestic Product
Suppose there are two families – one is a rich family whereas the other is a
poor family. We can make such judgements as “rich” or “poor” based on: the dress
people in the family wear, vehicles they use to travel, food that they eat, house they
live in, furniture and other equipment they have, hospitals they go for treatment
etc.Alternately, income that these families earn is an important overall indicator.
For the country as a whole, we use the total value of goods and services produced
in the country as the indicator of income for the country. The technical term to
denote this value is Gross Domestic Product (GDP).
The following Graph 1 shows the value of GDP for India for two different
years: 1972-73 and 2009-2010. One can compare what kind of increase has taken
place in production in the three sectors of the economy.
Workers in match factory
Money lender
Gardener
Potter
Bee-keeper
Astronaut
Call centre employee
The following table shows the percentage of workers employed in different sectors
in India in 1972-73 and in 2009-10, i.e. after 37 years.
Year Agriculture Industry Services
1972-73 74% 11% 15%
2009-10 53% 22% 25%
(i) What are the major changes that you observe from the above table?
(ii) From what you have read before, discuss what could be some of the reasons for
these changes.
Observe the Pictures and menstion the sector which they belong to :
1
2
3 4
1....................... 2........................ 3.......................4.....................
Social Studies30 Production and Employment
How do we estimate GDP?
People engaged in various economic activities in the above sectors produce a
very large number of goods and services. What we desire to find out is: how much
goods and services are produced.
With so many thousands of goods and services produced, you might think this
is an impossible task. Not only would the task be enormous, you might also wonder
how we can add up cars, computers, mobile phone service, baskets and pots. It
won’t make sense!
To get around this problem, economists suggest that the value of goods and
services should be used rather than adding up the actual numbers. For example, if
10,000 kilograms of paddy are sold at Rs. 25 per kg, the total value of paddy will be
Rs. 2,50,000. The value of 5000 coconuts at Rs. 10 per coconut will be Rs. 50,000.
Is it necessary to count every good (or service) that is produced and sold? How do
we estimate the total value of goods and services?
Take, for instance, a farmer who sells paddy to a rice mill for Rs. 25 per kg.
She sells 100 kilograms of paddy. Let us assume that she did not have to buy any
seeds. The total value of paddy produced by her is Rs. 2500. The rice mill takes out
rice and sells (i) 80 kilograms of rice to the hotelier for Rs. 40 per kg and (ii) 20
kilograms of husk at Rs. 20 per kg. The total value of goods produced by the rice
miller is: (80 x 40) + (20 x 20) = Rs. 3600. This is what the hotelier pays the rice
Answer the following questions
by looking at the chart:
Which was the largest
producing sector in 1972-73?
Which was the largest
producing sector in 2009-
2010?
Fill in the blank:
The total value of production of
goods and services in India increased
approximately ________ times
between 1972-3 and 2009-10.
2,09,352
1,33,912
2,43,082
25,78,165
11,73,089
7,64,817
(The data for 2009-10 has been adjusted for prices, which means that both for 1972-3 and 2009-10 the GDP
values can be compared. Both have been expressed in terms of prices existing in the same reference/ base year).
Aggregate (5,86,346)
Aggregate(45,16,071) Graph 1 : GDP by Agriculture,
Industry and Service Sectors
Free distribution by A.P. Government 31
miller. The hotelier makes idli, dosa and husk is used as fuel by him. The hotel
owner by using rice and husk makes out Rs. 5000 from the sale of idli, dosa.
Goods such as paddy and rice and husk in this example are at the intermediary
stages. They are not being used by the final consumer. They are used as inputs to
make the final good, in this example idli and dosa. If one were to add the value of
all the physical inputs in between plus the value of the final goods, we would be
double counting. The value of final goods already includes the value of all the in
between or intermediate goods that are used in making the final good. At each
stage the producer paid for these inputs produced by someone before. Hence, the
value of Rs. 5000 worth of hotel items sold by hotelier (final good) already includes
Rs. 3600, the value of rice and husk used as physical inputs. This was not made by
the hotelier but he only purchased them from the rice miller. Similarly the rice and
husk produced by the miller at Rs. 3600 already includes the value of physical
input paddy (Rs. 2500) purchased by him. He did not produce paddy. The farmer
produced this in stage 1. To count the value of the rice and paddy separately means
counting the value of the same things a number of times - first as paddy, then as
rice and husk and finally as idli and dosa.
The good becomes final if it is not used further in producing goods to be sold.
In the above example if the rice had been bought by a family for their consumption,
this would be the final point. Idli and dosa would be made by the family for
themselves and not as goods to be sold.
Total value of goods sold at each stage:
Stage 1 (sale of paddy by farmer to rice mill owner) Rs. 2500
Stage 2 (sale of rice and husk by rice mill owner to hotelier) Rs. 3600
Stage 3 (sale of idli, dosa ) Rs. 5000
Discuss: To find out the total value of goods produced should we add them up?
....But I should
be paid the full
value of the
wheat that I
produce !
In the above example, paddy or rice is the
intermediate goods and idli is the final
good. The following are a few goods we
consume in our daily lives. List some of
the intermediate goods against each one.
Final good Intermediate goods
Notebook
Car
Computer
Social Studies32 Production and Employment
Stage 1 (sale of paddy by farmer to rice mill owner) = Rs. 2500
Stage 2 (sale of rice and husk by rice mill owner to hotelier) = Rs. 3600
Stage 3 (sale of idli, dosa) = Rs. 5000
Discuss: Why do both methods give the same result?
Another way of looking at these stages is to focus only on value added at every
step by the producer of the good. To find out the value added by the producer to the
physical inputs purchased by him we relook at the above example:
It makes sense only to include the value added at each stage or to take the value
of final goods and services. The value of final goods and services produced in each
sector during a particular year provides the total production of the sector for that
year.And the sum of production in the three sectors gives what is called the Gross
Domestic Product (GDP) of a country. It is the value of all final goods and services
produced within a country during a particular year.
You might have noticed that the GDP figures are given for the year 2009-10.
This means the figures are pertaining toApril 2009 to March 2010. This period is
also called financial year.
GDP records the market value of all final goods and services produced. But
there are many items that are not sold/ purchased in the market. One important
exampleistheworkthatisdoneathomelikecooking,cleaning,organizing,bringing
up children, tending to plants and cattle, etc. In most instances, these do not involve
any monetary transaction and therefore remain outside the GDP measure, though
they are extremely important for the economy. Also, the unpaid work is done
mostly by women even today, in India and across the globe.
The value of GDP is given in the following table. Compute the growth rate of GDP as
shown for 2010-11.
Year GDP (in rupees crores) Percentage change in GDP over = Growth Rate
the previous year of GDP
2009-10 45,16,000 - -
2010-11 49,37,000 [ (49,37,000 – 45,16,000)/ = 9.32 %
45,16,000] *100
2011-12 52,44,000
2012-13 55,05,000
Free distribution by A.P. Government 33
Changes in the importance of sectors - value of goods and services
produced and employment of people
So far we know how the size of GDP has increased over the years, as more and
more goods and services are produced. It is essential to know how this increase
took place and what kind of activities contributed more to this growth of GDP. It
has been noted that many of the now developed countries had agriculture and other
allied activities as the most important contributor of GDP during the initial stages
of development.
As the methods of farming changed and agriculture sector began to prosper, it
produced much more food than before. Many people could now take up other
activities, as essential food requirements were met by other producers. There were
increasing number of craft-persons and traders. Buying and selling activities
increased many times, further increasing demand for goods and services, besides,
rulers employed large number of people as administrators, army etc. However, at
this stage, in an overall context most of the goods produced were from agriculture
and related sector and most people were also employed in this sector.
Recall what you have read about the industrial revolution in the earlier classes.
As new methods of manufacturing were introduced, factories came up and started
expanding. Those people who had earlier worked on farms now began to work in
factories in large numbers. People began to use many more goods. There was mass
production by factories at much lower rates and these goods reached markets all
over the world. For these countries industrial production gradually became the
most important sector, both in the total production of goods and services and also
in the employment of people. Hence, over time, a shift took place. This means that
the importance of the sectors had changed. The industrial sector became the
dominant sector and the importance of the agriculture sector both for employment
and production declined.
In the past 50 years, there has been a further shift from industry to service
sector for developed countries. The service sector has become the most important
in terms of total production. Most of the working people have also shifted and are
now employed in the service sector and most of the production activities are those
of services and not manufactured goods. This is the general pattern observed for
developed countries. Is a similar pattern observed for India?
Look at the following (2) pie charts . The contribution of various activities to
GDP is presented for two financial years – 1972-73 and 2009-2010. The circle or
the pie represents the GDP in the given year. GDP is made up of production from
the three sectors – agriculture, industry and services. Services in turn are seen to
comprise of three types.
Social Studies34 Production and Employment
During the 37-year period, the output share of agriculture sector has fallen
drastically. There was a small increase in the share of industrial output in GDP. In
contrast to this, there is a tremendous increase in the share of service activities -
two out of three sub-sectors of service activities have expanded.
Agriculture
Industry
Trade, hotels, transport & communication
Finance, insurance & real estate
Community, social & personal services
1972-73 2009-10
17%
26%
13%
17%
27%
43%
12%
15%
22%
8%
Graph 2 Share of different sectors in Gross Domestic Product
What do services comprise of?
Community, social and personal services Public Administration, Defence,
Education, Health, Veterinary
activities, Media, Library, archives,
museums and other cultural activities,
etc.
Finance, insurance and real estate services of banks, post-office savings
accounts, non-bank financial
companies, Life insurance and General
Insurance corporation, services of
brokers and real estate companies etc.
Trade, hotels, transport and communication
Can you find out some examples of trade, hotels, transport and communication?
Free distribution by A.P. Government 35
Employment – the working life in India
The Gross Domestic Product of a country has close relation with the total
number of working people in that country. In every country, as population increases,
it is essential that the country provides opportunities for those who are looking for
work. Unless people get jobs to earn, how do they get food and other requirements?
According to the Census of India, 2011, out of 1.2 billion persons in India, 460
million people are workers, i.e. people engaged in some productive activities. The
following table shows some basic facts about workers in India:
Unfortunately in India while there has been a change in the share of the three
sectors in GDP, a similar shift has not
taken place in employment. Graph 3.3
shows the share of employment in the
three sectors in 1972-73 and 2009-
10. The agriculture sector continues
to be the largest employer even now.
Why didn’t employment shift out of
agriculture sector? It is because not
enough jobs were created in the
industry and service sectors. Even
though production of industrial goods
went up by more than nine times
during the period, employment went
up only by around three times. The
same applies to service sector: while
production rose by more than 14 times, employment rose around five times.
As a result, more than half of the workers in the country are working in the
agriculture sector, producing only one-sixth of the GDP. In contrast to this, the
industry and service sectors produce three-fourth of the GDP whereas they employ
only about half the proportion of workers. Does this mean that the workers in
agriculture are not producing as much as they could?
Read the above table and fill in the blanks:
Majority of workers in agriculture are
living in ________.
Most _______workers are employed in
agriculture sector. Only a small section of
_________ is in industrial sector.
More than 90% of urban workers are
getting employment in ________and
______ sectors.
Compared to males, female workers are
getting employment in ________ and
______ sectors only to a small extent.
Table: 1 Distribution of Workers in India, 2009-2010 (%)
Sector Place of Residence Sex All workers
Rural Urban Male Female
Agriculture Sector 68 8 47 69 53
Industry Sector 17 34 34 16 22
Services Sector 15 58 19 15 25
Total 100 100 100 100 100
Social Studies36 Production and Employment
It means that there are more people in agriculture but everyone may not be
fully occupied. So, even if few people move out, production will not be affected.
In other words, workers in agricultural sector are underemployed.
Take the case of a small farmer, Gayathri, owning about two hectares of
unirrigated land dependent only on rain and growing crops like jowar and redgram.
All five members of her family work in the plot throughout the year. Why? They
have nowhere else to go for work. You will see that everyone is working, none
remains idle, but in actual fact their labour effort gets divided. Each one is doing
some work but no one is fully employed. This is the situation of underemployment,
where people are apparently working but all of them are made to work less than
their potential. This kind of underemployment is hidden in contrast to someone
who does not have a job and is clearly visible as unemployed. Hence, it is also
called disguised unemployment.
Supposing, a landlord hires one or two members of the family to work on his
land. Gayathri’s family is now able to earn some extra income through wages. Since
you do not need five people to look after that small plot, two people moving out
does not affect production on their farm. In the above example, two people may
move to work in a factory, or trade. Once again the earnings of the family would
increase and they would also continue to produce as much from their land.
There are lakhs of farmers like Gayathri in India. This means that even if several
people from agricultural sector are provided with proper work elsewhere,
agricultural production will not suffer. The incomes of the people who take up
other work would increase the total family income.
This underemployment can also happen in other sectors. For example there
are thousands of casual workers in the service sector in urban areas who search for
daily employment. They are employed as painters, plumbers, repair persons and
others doing odd jobs. Many of them don’t find work every day. Similarly, we see
Graph 3 : Sectoral shares of employment
1972- 73 2009-2010
Industry
11%
Services
15%
Agriculture
74%
Agriculture
53%
Services
25%
Industry
22%
Free distribution by A.P. Government 37
other people of the service sector on the streets pushing a cart or selling something
where they may spend the whole day but earn very little. They are doing this work
because they do not have better opportunities.
Graph 4 : Shares of three sectors in GDP
1972-73 2009-2010
Agriculture
42%
Services
35%
Industry
22%
Agriculture
17%
Services
57%
Industry
26%
Look at the above pie charts and fill in the following table.
S ector Employment (%) Gross Domestic Product (%)
1972-73 2009-10 1972-73 2009-10
Agriculture
Industry
Services
While service sector has grown, all service sector activities are not growing equally
well. Service sector in India employs many different kinds of people.At one end there are
a limited number of services that employ highly skilled and educated workers.At the other
end, there are a very large number of workers engaged in services such as small shopkeepers,
repair persons, transport persons, etc. These people barely manage to earn a living and yet
they perform these services because no alternative opportunities for work are available to
them. Hence, only a part of this sector is growing in importance.
Organised and unorganised sector employment in India
So far we have seen how different sectors contribute to Gross Domestic Product of
India and also realised the comparative importance of the three sectors. This helps us to
analyse the shifts that take place or don’t take place for both production and employment.
For our country we don’t see substantial shift in employment and to explore this we use
another classification method focusing on the nature of employment. The classification
discussed below emphasizes the problems of employment and the associated conditions
of work even more starkly.
Social Studies38 Production and Employment
Narasimha and Rajeshwari are illustrative examples of workers employed in
organised and unorganised sectors respectively. Do you see the differences in
conditions of work between them? The distinction between organised and
unorganised sectors helps us to understand the working situation and wages faced
by the majority of workers in the country. 92 per cent of workers in India are
found in unorganised sector and only 8 percent find work in the organised sector.
Narasimha
Narasimha works in a government office. He
attends his office from 9.30 am to 5.30 pm. He
uses his motorbike to travel from house to office
whichisabout5kilometres.Hegetshissalaryregu-
larly at the end of every month, deposited in his
bank account. In additional to the salary, he also
gets provident fund as per the rules laid down by
the government. He also gets medical and other
allowances.NarasimhadoesnotgotoofficeonSun-
days. This is a paid holiday. When he joined work,
he was given an appointment letter stating all the terms and condi-
tions of work.
Rajeshwari
Rajeshwari is working as a construction
worker. She goes for work at 7 am and re-
turns home at 7 pm. She travels about 8 to
10 kilometres daily for work by bus. Con-
struction workers get one hour lunch break
between 1pm and 2 pm. She gets work only
for 10 to 12 days a month. In the remaining
days she has no work, and she does not get
any wage. She gets Rs 150 per day as wages.
Mostly she is paid the wages on the spot in
the evening. When she works for three or
four days at the same spot she is paid after the work. She gets more work from
February to June. July to January is unseasonal. Rajeshwari is a member of a Self
Help Group in her locality. The government pays some compensation, if any death
or major injury while she is on work. There is no help from the government for
treatment in accidents while working. She is also part of a group that works under a
mason. There are 6 to 10 workers under each mason.
Free distribution by A.P. Government 39
Organised sector covers those enterprises or places of work where the terms
of employment are regular and therefore, people have assured work. They are
registered by the government and have to follow its rules and regulations which
are given in various laws such as the Factories Act, Minimum Wages Act, Shops
and Establishments Act etc. It is called organised because it has some formal
processes and procedures. Workers in the organised sector enjoy security of
employment. They are expected to work only for a fixed number of hours. If they
work more, they have to be paid overtime by the employer. They also get several
other benefits from the employers. They get paid leave, payment during holidays,
provident fund, etc. They are supposed to get medical benefits and, under the laws,
the employer has to ensure facilities like drinking water and a safe working
environment. When they retire, many of these workers get pensions as well. People
who work in the government or with companies or large establishments are all in
the organised sector.
The unorganised sector is characterised by small and scattered units which
have remained largely outside the control of the government. There are rules and
regulations but these are not followed or enforced. Jobs here are low-paid and not
regular. There is no provision for overtime, paid leave, holidays, leave due to
sickness etc. Employment is not secure. People can be asked to leave without any
reason. When there is less work during some seasons, some people may be asked
to leave.Alot also depends on the whims of the employer or changes in the market
situation.
Besides the above conditions, this sector includes a large number of people
who are employed on their own – self employed.Almost half the workers are self
employed. You would find them everywhere, doing small jobs such as selling on
the street or doing repair work or as hawkers. Similarly, farmers are largely self
employed and also hire labourers as and when they require.
The organised sector offers jobs that are the most sought-after. But the
employment opportunities in the organised sector have been expanding very slowly.
As a result, a large number of workers are forced to enter the unorganised sector
jobs, which pay a very low salary.They are often exploited and not paid a fair wage.
Theirearningsarelowandnotregular.Whenworkerslosetheirjobsintheorganised
sector they are forced to take up jobs in the unorganised sector with low earnings.
Besides the need for more work, there is also a need for protection and support of
the workers in the unorganised sector.
Who are these vulnerable people who need protection? In the rural areas, the
unorganised sector mostly comprises of landless agricultural labourers, small and
marginal farmers, sharecroppers and artisans (such as weavers, blacksmiths,
carpenters and goldsmiths). Nearly 80 per cent of rural households in India are in
small and marginal farmer category. These farmers need to be supported through
adequate facilities for timely delivery of seeds, agricultural inputs, credit, storage
Social Studies40 Production and Employment
facilities and marketing outlets.As farm labourers they require adequate work and
payment of minimum wages.
In the urban areas, unorganised sector comprises mainly of workers in small-
scale industry, casual workers in construction, trade and transport etc., and those
who work as street vendors, head load workers, garment makers, rag pickers etc.
Small-scale industry also needs government’s support for procuring raw material
and marketing of output. The casual workers in both rural and urban areas need to
be protected.
We also find that majority of workers from scheduled castes, tribes and
backward communities find themselves in the unorganised sector. It is worse if
one is a woman from these communities. Besides getting the irregular and low
paid work, these workers also face social discrimination. Protection and support
to the unorganised sector workers is thus necessary for both economic and social
development.
Let’s examine both the production of goods and services and employment from
these sectors. The unorganised sector also contributes to GDP. During 2004-05,
the unorganised sector workers accounted for 92 per cent of all workers that
contributed half of all production. On the other hand, only 8% of people had a
decent employment and contributed 50% of the production of goods and services.
The products and services of these companies find a market but they support a
very small section of the population with privileged jobs. This is an extremely
unequal situation. The rest find only insecure low paying jobs or are self employed
with low earnings or remain underemployed.
How to create more and better conditions of employment?
A large number of people should have found a decent employment in industry
and services but this has not taken place. Production (in industry and services) has
increased without a similar increase in employment. When we look at how people
are employed we find that most people are in the unorganised sector, barely able
to find work. The increase in production is benefitting only about 8% of workers.
Hence in what ways can one increase employment for all people? Let us look at
some of them.
Contribution (% of total)
Employment Gross Domestic Product
Organised 8 50
Unorganised 92 50
Total 100 100
Table 2 Contribution of organised and unorganised sectors
Sector
Free distribution by A.P. Government 41
Take the case of Gayathri with her two-hectare plot of un-irrigated land. The
government can spend some money or banks can provide a loan, to construct a well
for her family to irrigate the land. Gayathri will then be able to irrigate her land and
take a second crop, wheat, during the rabi season. Let us suppose that one hectare
of wheat can provide employment to two people for 50 days (including sowing,
watering, fertiliser application and harvesting). So, two more members of the family
can be employed in her own field. Now suppose many small dams are constructed
andcanalsaredugtoirrigatemanysuchfarms.Thiscouldleadtoalotofemployment
generation within the agricultural sector itself reducing the problem of
underemployment.
Now, suppose Gayathri and other farmers produce much more than before.
They would also need to sell some of this. For this they may be required to transport
their products to a nearby town. If the government invests some money in
transportation and storage of crops, or makes better rural roads so that mini-trucks
reach everywhere several farmers like Gayathri who now have access to water, can
continue to grow and sell these crops. This activity can provide productive
employment to not just farmers but also others such as those in services like
transport or trade.
Gayathri’s need is not confined to water alone. To cultivate the land, she also
needs seeds, fertilisers, agricultural equipments and pumpsets to draw water. Being
a poor farmer, she cannot afford many of these. So she will have to borrow money
from moneylenders and pay a high rate of interest. If the local bank gives her credit
at a reasonable rate of interest, she will be able to buy all these in time and cultivate
herland.Thismeansthatalongwithwater,wealsoneedtoprovidecheapagricultural
credit to the farmers for farming to improve.
Another way by which we can tackle this problem is to identify, promote and
locate industries and services in semi-rural areas where a large number of people
may be employed. For instance, many farmers decide to grow millets and other
cereals. Setting up a flour mill to procure and process these and sell in the cities is
one such example. Opening a cold storage could give an opportunity for farmers to
store their products like chillies and onions and sell them when the price is good.
In villages near forest areas, we can start honey collection centres where people
can come and sell wild honey. It is also possible to set up industries that process
vegetables and agricultural produce like tomato, chillies, mango, rice, red gram,
fruits, which can be sold in outside markets. This will provide employment in
industries located in semi-rural areas and not necessarily in large urban centres.
Today, we not only have to generate new employment opportunities but also
train many workers to work efficiently and with machines. We should invest in
many industries, in both rural and semi-urban areas, so that we are able to produce
many more goods and services.
Social Studies42 Production and Employment
Key words
Gross Domestic Product Final goods Sectoral goods
Employment shifts Organised and unorganised sector
Improveyourlearning
1. Fill in the blanks using the correct option given in the bracket:
(i) Employment in the service sector______increased to the same extent as
production.(has / has not)
(ii) Workers in the______sector do not produce goods. (service / agricultural)
(iii) Most of the workers in the______sector enjoy job security. (organised /
unorganised)
(iv) A______proportion of labourers in India are working in the unorganised sector.
(large / small)
(v) Cotton is a ______ product and cloth is a _________ product. [natural /
manufactured]
2. Choose the most appropriate answer.
(a) Production of a commodity, mostly through the natural process, is an activity in
_______ sector.
(i) primary
(ii) secondary
(iii) tertiary
(iv) information technology
(b) GDP is the total value of _____________ produced during a particular year.
(i) all goods and services
(ii) all final goods and services
(iii) all intermediate goods and services
(iv) all intermediate and final goods and services
(c) In terms of GDP the share of service sector in 2009-10 was
(i) between 20 to 30 per cent
(ii) between 30 to 40 per cent
(iii) between 50 to 60 per cent
(iv) 70 per cent
Free distribution by A.P. Government 43
3. Find the odd one out and say why.
(i) Teacher, doctor, vegetable vendor, lawyer
(ii) Postman, cobbler, soldier, police constable
4. Do you think the classification of economic activities into primary, secondary and
services sectors is useful? Explain how.
5. For each of the sectors that we came across in this chapter why should one focus on
employment and GDP? Could there be other issues which should be examined?
Discuss.
6. How is the service sector different from other sectors? Illustrate with few examples.
7. What do you understand by underemployment? Explain with an example each from
the urban and rural areas.
8. The workers in the unorganised sector need protection on the following issues:
wages, safety and health. Explain with examples.
9. A study in Ahmedabad found that out of 15,00,000 workers in the city, 11,00,000
worked are in the unorganised sector.The total income of the city in this year (1997-
1998) was Rs 6000 crores. Out of this Rs 3200 crores was generated in the organised
sector. Present this data as a table. What are the ways for generating more
employment in the city?
Social Studies44 Climate of India
CHAPTER
4
Climate and Weather
The state of atmospheric conditions over an area at a particular time refers
to weather. These weather conditions fluctuate very often even in a short period.
Climate refers to such conditions over a large area and follows a similar general
pattern over many years. What have been the general conditions, year after year,
over thirty years or more, gives us the climate. There are variations from year to
year but a basic pattern remains the same. On the basis of these generalised
conditions, the year is divided into seasons. The elements of weather and climate
are: temperature, atmospheric pressure, wind, humidity, and precipitation. The
pattern of these for a place can be shown using pictures called climographs or
climatographs. Climographs show average monthly values of maximum
temperature, minimum temperature, and rainfall for a given place.
Collect similar newspaper reports.
Are these indicators of some change or just a variation that happen once in a
long time? Invite some meteorological officials or college faculty to discuss these
developments.
Freak weather offshoot of climate change: Experts
After observing such
unforeseen situations
like extreme summer in
the country, sudden
hailstorm in Chevella
region of Ranga Reddy
district, cloudbursts in
Uttarakhand and early
onset of southwest
monsoon and a late
retreat, experts say that
weather systems are
behaving in a peculiar
way.
Ongole received 341
mm rainfall in one day,
which is more than one-
third of the state's total
annualrainfall.Theheavy
showers across the state
have damaged several
acres of crops,
particularly cotton. But
in a good news, 75% of
the around 80,000 tanks
in Andhra Pradesh are
full now.
(adapted from Oct 25,
2013 Times of India)
Intermittent showers in
Hyderabad have
bewilderedMeteorologi-
calofficials,whileclimate
change experts said it is
increasingly becoming
difficult to predict future
weather events in the
country. For the last two
years, we have noticed
thattheweathersystems
arebehavinginapeculiar
way resulting in unusual
weather events.
Climate of India
Free distribution by A.P. Government 45
Climographs of a few places in India.
The climographs below show that temperature and rainfall vary in different
parts of the country. Refer to your atlas and identify the relief region where these
places are located.Also, read the graphs below and fill the table on following page.
Mean Maximum Temperature (0
C)
Mean Minimum Temperature (0
C)
Mean Rainfall (mm)
All Graphs Courtesy: The Indian Institute of Geographical Studies.(CC)2013
Graph 1 to 4 : Climographs
January
February
March
April
May
June
July
August
September
October
November
December
January
February
March
April
May
June
July
August
September
October
November
December
January
February
March
April
May
June
July
August
September
October
November
December
10
9
8
7
6
5
4
3
2
1
0
40
30
20
10
0
-10
-20
250.0
200.0
150.0
100.0
50.0
0.0
40
35
30
10
20
15
10
5
0
400.0
350.0
300.0
250.0
200.0
150.0
100.0
50.0
0.0
40
35
30
25
20
15
10
5
0
January
February
March
April
May
June
July
August
September
October
November
December
250.0
200.0
150.0
100.0
50.0
0.0
45
40
35
30
25
20
15
10
5
0
Social Studies46 Climate of India
Factors influencing climate and weather
It is observed that for some places (e.g. Chennai) there is not much difference
in the temperature across months. Some places (e.g. Delhi) have wide differences
in temperature across the months. India experiences wide variations in temperature.
The northern portion is bounded by the Himalayas whereas southern peninsula is
surrounded by seas. Some places are far from the coasts; they are inland. Some
places are at high altitude, whereas others are on the plains. The factors that affect
climate are called climatic controls. These include:
1. Latitude 2. Land-water relationship 3. Relief 4. Upper air circulation
1. Latitude or distance from the equator
The average temperatures for the year drop as you go further away from the
equator. For this reason, we divide the regions on Earth as:
• Tropical, as those close to the Equator;
• Polar, as those close to the poles;
• Temperate, as those in between these two extremes.
If we compare the climate of, say, Indonesia and Japan, we can understand the
What are the warmest and coldest months in Leh?
FromtherangeoftemperaturesintheabovetablesaywhetherJaipuris,ingeneral,
hotter than Leh. Explain your answer.
Compare the climate of Delhi and Chennai. How are they different?
Read carefully the rainfall pattern for Leh. In what ways is this different from
the others? From your atlas can you find out some other places in the world that
have similar rainfall pattern.
Identify the wet months for Chennai. How is this different from Jaipur?
Place Relief
region
Range of
m a x i m u m
temperature,
duringtheyear
Rangeofminimum
temperature,
duringtheyear
Name the wettest
month and the
rainfall (mm) for
thatmonth
Namethedriest
month and the
rainfall(mm)for
thatmonth
Jaipur
Leh
New Delhi
Chennai
RangeofTemprature:From highestvaluetolowestvalue
Free distribution by A.P. Government 47
differences. The reason for these differences is the differential heating of Earth
thatyouhavereadinearlierclasses.Intensityoftemperaturedependsonthelatitude.
The temperature of the atmosphere at a particular
place near the Earth’s surface depends upon the
insolation (heat from sun rays) received at that
location. This is more intense in the low latitudes
than in the high latitudes. As we move away from
the equator towards the poles, the average annual
temperature decreases.
In India the southern part lies in the
tropical belt closer to the equator. Therefore
this region has higher average temperature
than the northern part. This is one reason for
the climate of Kanyakumari being entirely
different from Bhopal or Delhi. India is
situated roughly between 8o
and 37o
N
latitudes and the country is divided into almost
two equal parts by the Tropic of Cancer. The
part south of the Tropic of Cancer lies in the
tropical zone. The part north of the Tropic of
Cancer lies in the temperate zone.
Land water relationship
LookatamapofIndiashowinglandcover
and water bodies, and you will see another
important factor which has an influence on
climate: the land and water relationship . The
amount of sunlight that is first absorbed and
then radiated back or directly reflected
depends on the nature of the surface. Darker
areas, such as heavily vegetated regions, tend
to be good absorbers; lighter areas, such as
snow and ice-covered regions, tend to be good
reflectors. The ocean absorbs and loses heat
more slowly than land. This affects climate
in many ways. One of this is the formation of
land and sea breezes. Using Fig 4.2 explain
how this happens. Recall from class IX the
connection between pressure and direction of
wind.
Using a globe recall and
discuss what you may have
read earlier. How does the
angle of sun vary at different
latitudes? What impact does
this have?
Fig 4.1 : Influence of latitude on climate
Fig 4.2 : How does this ‘moderate’ the
temperature of such a place?
Night
Day
warm air
cool sea breeze
land warmer see cooler
cool land breeze warm air
land cooler sea warmer
Social Studies48 Climate of India
A large part of southern India, because
of its long coast line, comes under the
moderating influence of the sea. As such,
the difference between the temperature of
day and night and that of summer and winter
is not much. This is known as equable
climate. If we compare similar places on the
same latitude and altitude we can appreciate
the effect of the sea.
Relief
You have learnt that temperature decreases as altitude increases. Hence, hills
and mountains will have lower temperature than locations on the plain. Therefore,
relief or altitude of a region influences the
climate of the area. You would have heard
about several hill stations of the Himalayan
region like Shimla, Gulmarg, Nainital and
Darjeeling as places that have a cool climate
even during the peak summer months.
Similarly Kodaikanal and Udagamandalam
(Ooty) have cooler climate, compared to
places near the coast.
Upper atmospheric circulation
In the northern hemisphere, subtropical high pressure belt gives rise to
permanent winds. They blow toward the equatorial low pressure belt by reflecting
towardsthewestandarecalledtradewinds.TheGermanword‘trade’means‘track’
and stands for blowing steadily in the same direction and in a constant course.
India lies in the belt of dry north-east trade winds.
The climate of India is also affected by the movement of upper air currents
known as ‘jet streams’. These are fast flowing air currents in a narrow belt in the
upper atmosphere, above 12,000 m. The speed varies from about 110 km/h in
summer to about 184 km/h in winter. An easterly jet stream develops at about
250
N.Ajet stream causes the neighbouring atmosphere to cool.This cooling effect
of the easterly jet stream causes rain from clouds already found over this latitude
(250
N).
Seaons: Winter
The temperature in the Indian land mass considerably reduces from mid-
November and this cold season continues till February. January is usually the
coldest month-day temperature sometimes drops below 100
C in several parts of
the country. However, the cold weather is more pronounced in northern India. South
In your atlas, compare the
temperaturesofMumbaiandNagpur
for winter and summer months. How
are they similar or different? How
doesitexplaindistancefromthesea?
With the help of the climographs can
you explain the differences in
temperature for Jaipur and Chennai.
Are Shimla and Delhi located on very
different latitudes? Check with your
atlas. Is Shimla cooler than Delhi
during summer?
Why does Darjeeling have pleasant
weather as compared to Kolkata
during summer season?
Free distribution by A.P. Government 49
India, especially the coastal areas, enjoy a moderate climate as temperature remains
well above 200
C.
The lines in map 1 below indicate
places that have the same average
temperature for January.
During winter, the weather is
generally pleasant with clear sky, low
humidity and cool breeze. Cyclone
depressions coming from
Mediterranean Sea called Western
Disturbances cause low to moderate
rainfallovernorthernIndia.Thisrainfall
is boon to wheat crop which is generally cultivated in ‘Rabi’ season.
India lies in the trade wind belt of Northern Hemisphere – north-east trades
blow over India from land to sea and are therefore dry. However, some amount of
rainfall occurs on the Coramandel coast of Tamil Nadu from these winds, as they
pick up moisture from the Bay of Bengal while crossing it.
What would be the range for the average
temperature inAPfor January?
Using your atlas find some places located
on 150
C.
Close to the line showing places where
average temperature is 250
C, there’s a
small circle of places on 200
C. How is
this possible?
Map 1 : India Average
Temparature (0
C) January
Social Studies50 Climate of India
Summer
During the hot season,
as we move from southern
to northern part of the
country, the average
temperature increases.
Starting in April, the
temperature rises and
slowly the maximum day
temperature exceeds 370
C
in northern plains of India.
By mid-May, day
temperature may touch 410
C to 42 0
C in many parts
of the country, especially
in the north-west plains
and central India. Even
minimum temperature
does not go below 200
C.
The northern plain
experiences dry and hot
winds called ‘Loo’.
Towards the end of the
summer season, pre-monsoon showers
(‘bursting monsoon’) are common in the
Deccan Plateau. These help in the early
ripening of mangoes and other plantation
crops in peninsular India. Hence they are
locally known as mango showers inAndhra Pradesh.
Advancing monsoon
The climate of India is strongly influenced by the monsoon winds. The sailors
who came to India during olden days noticed the regular periodic reversal of winds.
They used these winds to sail towards the Indian coast. Arab traders named this
seasonal reversal of wind system ‘monsoon’.
The monsoon forms in the tropical area approximately between 200
N and 200
S latitudes. The south-east monsoon winds from the southern hemisphere carry
moisture as they flow over the Indian Ocean and towards the equatorial low pressure
zones. After crossing the equator, these winds deflect towards the low pressure
formed in the Indian sub-continent. The heating of land creates low pressure on the
land mass of Indian sub-continent, especially over central India and the Gangetic
Map: 2.4 Average Temperature
in 0C (May)
From the climographs (Graph 1-4), note
theapproximateaveragetemperaturefor
May for the four places and mark them
on the above map.
Map 2 : India Average
Temparature (0
C)
in the month of May
Free distribution by A.P. Government 51
plain.Together with this, theTibetan plateau gets intensely heated and causes strong
vertical air currents and the formation of low pressure over the plateau at above 9
kms altitude.
They then flow as the southwest monsoon. The Indian peninsula divides them
into two branches - theArabian Sea branch and the Bay of Bengal branch. The Bay
of Bengal branch strikes the Bengal coast and the southern face of the Shillong
plateau. Then it gets deflected and flows westward along the Gangetic valley. The
Arabian Sea branch arrives at the west coast of India and moves north ward. Both
the branches reach India by the beginning of June, which is known as “onset of
monsoon”. They gradually spread over the entire country in four to five weeks. The
bulkoftheannualrainfallinIndiaisreceivedfromsouth-westmonsoon.Theamount
of rainfall is very high along the west coast due to the Western ghats, and in north-
east India due to the high peaked hills. Tamil Nadu coast (Coramandel), however,
remains mostly dry during this season as it is in the rain shadow area of theArabian
Sea branch and is parallel to the Bay of Bengal branch.
Retreating Monsoon
October - November is a period of transition from a hot wet conditions to dry
winter condition (Fig 4.7). The retreat of the monsoons is marked by clear skies
and rise in temperature. The land is still moist. Owing to the conditions of high
temperature and humidity, the weather becomes rather oppressive. This is
commonly known as “October heat”.
The low pressure conditions which once prevailed over north-western India
move far South to the centre of the Bay of Bengal by early November. During this
period cyclonic depressions are common which originate over theAndaman area.
These tropical cyclones are often very destructive. The thickly populated deltas of
the Godavari, Krishna and Cauveri are their targets. No year is ever found disaster
free. Occasionally, these tropical cyclones visit Sundarbans and Bangladesh too.
Bulk of the rainfall of the Coromandel Coast is derived from depressions and
cyclones.
High
Pressure
Low
Pressure
North
East
Monsoon
South West
Monsoon
January July
Fig 4.3 : Pressure and monsoon wind
Social Studies52 Climate of India
Map 3 : India - Onset of
south-west monsoon
Map 4 : India - Withdrawal of
south-west monsoon
Seasons Months Months
According to the According to the
Indian (lunar) calendar Western (solar) calendar
Vasantha Chaitra – Vaishakha March – April
Grishma Jyestha – Ashadha May – June
Varsha Sraavana – Bhadra July – August
Sharad Aswayuja – Karthika September – October
Hemanta Margashira – Pushya November – December
Shishira Magha – Phalguna January – February
In the Indian tradition, a
year is divided into six two-
monthly seasons. This
cycle of seasons that the
peopleinnorthandcentral
India follow is based on
their practical experience
and age-old perception of
weather phenomena.
There is a slight variation in
the timing of the seasons
between northern and
southern India.
Traditional Indian Seasons
Free distribution by A.P. Government 53
Global Warming and Climate Change
As Earth started to take shape from a fire ball to a planet, many gases were
released. These gases did not escape into outer space because of the Earth’s
gravitational pull. It still holds them back.The result?Athin layer of gases surrounds
Earth and provides us several important benefits. For example: the oxygen that we
breathe, the ozone that protects us from harmful ultraviolet rays from the sun, the
nitrogen that our plants use to make proteins that we need, the medium through
which fresh water is circulated, and keep us warm (look at the image from Class IX
Chapter 4).
Keeping us warm is one of the most important things that the atmosphere does
for us. It is like a light, but effective, blanket enveloping Earth.You will recall from
Class IX that the atmosphere traps a lot of the solar energy that reaches Earth by
preventing it from totally escaping back into space. This is called Green house
effect. This is important and vital for life to survive on this planet. If it did not have
this atmosphere, earth would be very cold indeed.
However, since the 19th
century the planet has been warming up very rapidly.
There is an increasing concern about this. Why this concern? After all, Earth has
been through many cycles of warming and cooling (in fact, freezing!). So what is
so special about it now?
Earlier cycles of cooling and warming happened over very long periods of time.
This allowed much of the life on Earth the time to adapt to the changes. The problem
now is that the heating is much more rapid and could lead to catastrophic changes.
Much of the warming that has been occurring since the Industrial Revolution is
because of human activities. Hence, the current global warming trend is called
AGW(Anthropogenic GlobalWarming; anthropogenic means caused by humans).
More recently, scientists are discovering large volumes of methane under the
frozen tundras of the far northern latitudes (mainly in the vast expanses of northern
Russia). As global temperature increases, the ice in the tundra melts more. The
methane that is trapped under the ice escapes into the atmosphere, increasing the
global temperatures. In turn, this causes even more ice to melt, releasing even
more methane, and so on. Methane is said to be even more powerful than carbon
dioxide as a greenhouse gas.
AGW and climate change
AGW is causing many changes in the distribution of heat in the Earth system.
Remember how atmospheric and oceanic circulations keep re-distributing the heat
in the world? AGW disturbs this system and the re-distribution system. The
disturbance itself is not so much of a problem. It is the rapidity with which it is
happening.
When the redistribution system is disrupted, weather and climate patterns
Social Studies54 Climate of India
change.Long-termchanges(climaticchanges)happenfromaccumulationsofshort-
term changes (weather changes).
An international effort to form an agreement whereby all countries try to reduce
their emission of greenhouse gases has so far not been achieved.An international
organization called Inter-governmental Panel on Climate Change (IPCC) was
formed to address this issue. It has held many conferences to work out a treaty
among the nations of the world to reduceAGW and try to slow down the process
of climate change. None of these have been successful. The latest attempt was
made at the IPCC conference in Warsaw (Poland), in 2013. This has also failed to
achieve any agreement.
Broadly, the disagreements are between the ‘developed’ countries (mainly
industrialised, economically more advanced countries of theWest) and ‘developing’
countries (countries that are not as industrialised). Developed countries want
developing countries to cut down on burning coal and other activities that add
greenhouse gases to the atmosphere. Developing countries argue that developed
countries developed precisely by burning fossil fuels in their development.
Developing countries say that their economic development will be seriously
damaged if they don’t burn fossil fuels
(mainly coal), and that developed
countries should do their fair share of
work to help find alternatives that can
help the developing countries to
progress.
Most scientists from around the
world agree on this much:AGW is real,
it is happening, and it is leading to rapid
and drastic climate change. They warn
that severe weather and other changes
will increase in the coming years and
threaten life as we know it.
One of the human activities that
contribute to global warming is deforestation. Discuss with your teacher and your
classmates and try to answer the questions on the right in a few sentences.
Impact of climate change on India
Though a rise of 20
C in average temperature may appear to be small, it
would result in a rise of one meter in sea levels by early next century. This would
affect large portions of our coastal areas and millions of people would have to be
shifted. They would lose their livelihood.
What is deforestation?
Does deforestation happen only in forest
areas?Howaboutinyourlocalarea,even
if there are no forests?
How does deforestation affect global
warming? (You will need to recall your
study of photosynthesis in your science
class.)
What are some other ways in which
human action contributes to global
warming?
Free distribution by A.P. Government 55
Nearly 200 squatter families living in Nonadanga in east Kolkata for the past
few years are in the process of being evicted by the Kolkata Metropolitan
Development Authority (KMDA). Many of the families came to Kolkata in search
of work, after the Aila super-cyclone ravaged Sundarbans in 2009.
On March 30, the slum was bulldozed amid heavy police presence and some
hutments were set on fire. The recurrent thunderstorms over the past few days
has meant sleepless and soiled nights for nearly 700 people who have been ren-
dered homeless. They work as house helps, rickshaw pullers and construction
labourers.
The other effect would be on rainfall. This is likely to be more erratic and lead
to greater imbalances: some places are likely to receive excess rainfall whereas
others would get less than normal. Hence droughts and floods are expected to
increase. This would greatly affect the agriculture pattern and people’s livelihood.
The faster melting of Himalayan
glaciers would disturb the livelihood of
fresh water fisher folk as their natural
habitatoffishisaffected.Similarlyfreak
weather conditions that you read
about are likely to increase. Climate
change is something that happens
at a global level. Therefore, it affects
all of us.
Fig 4.8 : Impact of Aila : (left)
broken embankment, (below)
repairing embankment
Imagine how one would cope with a
situation, if millions of people were
affected. Where would you find land for
resettlement? What jobs would they do?
Social Studies56 Climate of India
Improveyourlearning
1) Read the following statements and mark if it is an example of weather or climate
a) During the last few years many glaciers have melted in Himalayas
b) During the last few decades drought in Vidarbaha region has increased
2) Match the following. Use maps if you cannot locate the places. (There
could be multiple correct answers)
a) Trivandrum is farther from the equator and temperature
would be lower in winter
b) Gangtok is closer to the equator but not close to the
seas and has low rainfall
c) Anantapur is closer to sea, and climate has big
impact of the seas
3. Describe India’s climate controls.
4. Write a short note on factors influencing climatic variations in hilly areas and
deserts.
5. How are human activities contributing to global warming?
6. Whataredisagreementsbetween‘developed’and‘developing’countriesaboutAGW?
7. How is climate change causing global warming? Suggest measures to minimise the
influence of the global warming.
8. On an outline map of India, show the following:
(i) Areas recorded with more than 400
C annual mean temperature
(ii) Areas recorded with annual mean temperature less than 100
C
(iii) The direction of the south-west monsoon over India.
9. Observe the following climograph and answer the following questions.
A. Which month received highest rainfall?
B. Which months experience highest and lowest temperature?
C. Why is the maximum amount of rainfall between June and October?
D. Why is the temperature high between March and May?
E. Identify relief conditions causing variation in temperature and rainfall.
Key words
Climograph Weather Monsoon Insolation
Jet Streams Pressure Zone Global warming
Free distribution by A.P. Government 57
Mean Maximum Temperature (0
C)
Mean Minimum Temperature (0
C)
Mean Rainfall (mm)
Courtesy:TheIndianInstituteofGeographicalStudies.(CC)2013
January
February
March
April
May
June
July
August
September
October
November
December
200.0
180.0
160.0
140.0
120.0
100.0
80.0
60.0
40.0
20.0
0.0
45
40
35
30
25
20
15
10
5
0
Project
Collect proverbs/ sayings that are related to climate and weather in your region.
ARainbow in the morning is the Sailor’s Warming.
ARainbow at night is the Sailor’s delight.
When the dew is on the grass rain will never come to pass.
Social Studies58 Indian Rivers and Water Resources
On a map of India identify and mark the Himalayas and the Western Ghats.
Using the colour code, identify the height range in which some of the rivers
originate. Using the atlas and the raised relief map follow the course of these
rivers and locate the direction in which they are flowing.
Discuss: About 5% of water is used for domestic purposes and yet a large
section of the population does not have access to the water.
40 million hectares of land in India is flood-prone and an equally large part of
the country is also drought prone. What are the causes of this?
70% of our surface water resources are polluted. Why?
Map 1 : India Relief and Drainage
0 to 300 mts
301 to 1000 mts
1001to3000mts
above 3000mts
Indian Rivers and Water Resources
CHAPTER
5
Free distribution by A.P. Government 59
The drainage of India has evolved and adjusted itself with the evolution of the
three physiographic units: 1) the Himalayas 2) peninsular plateau and 3) the Indo-
Gangeticplain.Onthebasisofitsorigin,thedrainagesysteminIndiacanbebroadly
divided into two categories: i) The Himalayan rivers and ii) The Peninsular rivers.
The Himalayan Rivers
The Himalayan Rivers belong to the three principal systems: the Indus, the
Ganga and the Brahmaputra. These rivers originate from almost the same region
within few kilometers of each other separated by water divides. They first flow
parallel to the main axis of the mountains. Then they take a sudden bend towards
the south cutting through the massive mountain chain to reach the north Indian
plains. In the process they have carved out deep ‘v’ shaped valleys. This is well
exhibited by Indus and the Brahmaputra rivers.
The Himalayan Rivers are perennial. This is because the rivers are supplied on
rainfall as well as the melting snow.
The Indus System
The Indus originates in the northern slopes of the Kailash range in Tibet near
Lake Manasarovar. It follows a north-westerly course throughTibet. It enters Indian
Territory in Jammu and Kashmir. The main
tributariesoftheIndusinIndiaareJhelum,Chenab,
Ravi, Beas and Sutlej. It covers Jammu and
Kashmir, Punjab and Himachal Pradesh states of
India.
The Ganga System
The Ganga has twin sources. The main one is the Gangotri glacier where it is
called the Bhagirathi. The other is the Satopanth glacier north-west of Badrinath
where it is called theAlakananda.The two join at Devprayag to form the Ganga that
emerges from the hills of Haridwar. The Ganga is joined by a large number of
tributaries. A majority of them
originate in the Himalayan
ranges but some of them have
their sources in the peninsular
plateau.
The Brahmaputra system
The Brahmaputra (known as the Tsangpo in Tibet) rises from the snout of the
Chemayungdung glacier of the Kailas range near Manasarovar. It flows eastwards
through southern Tibet. Near Lhotse Dzong, it opens out into a wide navigable
channel for about 640 kms. Thereafter, the river breaks through a succession of
With the help of an atlas trace
thecourseofIndusbothinIndia
and Pakistan.
Look at the map of river Ganga (5.2) and name
the states which are drained by it.
From the above map list out the north-flowing
and south-flowing tributaries of the Ganga.
Social Studies60 Indian Rivers and Water Resources
rapids. It enters in a
great loop southwest
through Arunachal
Pradesh in India, first
as the Siang and then
as the Dihang.
Emerging into the
Assam valley it is
joined by two
tributaries-TheDibang
and the Lohit. From
here,theriverisknown
as the Brahmaputra.
The Peninsular Rivers
The Western Ghats are the water divide between the major peninsular rivers,
discharging their water in the Bay of Bengal and as small rivulets joining theArabian
Sea. Most of the major Peninsular Rivers except Narmada and Tapati flow from
west to east. The Chambal, Sind,
Betwa, Ken, and Son, originating in
the northern part of the peninsular
belongtotheGangariversystem.The
other major river systems of the
peninsulardrainagearetheMahanadi,
theGodavari,theKrishnaandCauveri.
Peninsular rivers are characterised by
fixed course, absence of meanders
and largely non- perennial flow of
water.
The Godavari is the largest
peninsular river system. The source
of this river is in theTriambak plateau
near Nasik in Maharashtra and
discharges its water into the Bay of
Bengal.
Water use
Water is a resource that becomes available to us as an annual flow i.e. we try to
estimate how much we would be able to use during the year. In order to do this we
need to recall the ‘water-cycle’ and estimate the inflows and outflows during the
year. Outflows and inflows can be estimated at different levels - for small watershed
or an entire river basin.
Map 2 : Ganga joining with Brahmaputra
From the Map and using your atlas describe
the following:
The Godavari originates in ____and____
The Krishna is the second largest east
flowing peninsular river which rises near
__________ .
The Mahanadi rises near Sihawa in
Chattishgarh and runs through____
The Narmada originates near ________in
Madhya Pradesh.
The Tapati originates from ____and flows
____(fill in the direction of flow)
Free distribution by A.P. Government 61
Now let us explore
the idea of a ‘water
budget’ as it would
apply to a small or
large region such as a
village or a district.
Inflows
For any area inflow =
precipitation + surface
flow + ground water
flow. Surface flow
includes rivers,
streams, canals, and other flows on the surface. Ground water flow is difficult to
estimate, but it can be done. Precipitation includes snow, dew, hail etc. To estimate
the percipitation of an area we take an average over many years since percipitation
varies from year to year.
Surface and ground water flows: For your area, whether a village or a town, list
the surface water inflows from the river, or canals of irrigation projects.
A small region such as a village may receive
water through canals, pipelines etc- list all
outside sources. This has to be added to
the amount of rainfall to get an idea of the
total inflow for the village. However it is more difficult to get an idea of ground
water inflows but the general slope of the land helps one make a guess as to the
possible direction of the flow.
Outflows
Evapotranspiration: Evaporation, the turning of water into vapour, takes place
all the time in water bodies. It can happen to any exposed surface water such as
lakes,rivers, seasetc.Livingthingsalsogive
off water into the atmosphere through their
breathing process. This is called
transpiration. The total amount of water
added to the atmosphere from both
evaporation and transpiration is called evapotranspiration.
Precipition
(Rainfall)
Evapotranspiration
(from non-crop biomass stands)
Surface
water
inflow
Rootzone
Storage
Groundwater
inflow
Groundwater
storage
Surface Storage
Evaporation
from surface
storage
Evaporation from
saturated surfaces
Evapotranspiration
from crops Water use for domestic
and industrial purposes
Surface water
outflow
Groundwater outflow
©SuhasParanjpeandKJJoyPanlotkshetravokassachyanavyadisha,Maharashtracouncil
Fig 5.1 : Water
Cycle
Discuss the term
“watershed”.
From the nearest Mandal office find
out the total annual rainfall for your
area over the past 5 years.
Recall from your science lessons
what happens to the water that plants
draw through their roots.
Social Studies62 Indian Rivers and Water Resources
Water flowing out via surface flows and groundwater: Imagine a region
such as a village. Some amount of water would flow out of the village as surface
flows through streams. During monsoon months this surface flow would increase
substantially. A portion of the rainfall percolates into the soil and travels to the
underground strata and re-charges the aquifers. Some of it flows into and becomes
available for use through wells and bore wells and a portion of it goes into very
deep aquifers that do not become available. Some of the underground water becomes
part of flows that eventually appear in streams or rivers.
Water for agriculture: Water reaches the root zone of crops either through
rainfall or some process of irrigation. There’s a capacity of the soil to store moisture.
If there’s excess water, such as a flood, and this isn’t able to percolate below it
would damage the roots. On the other hand, in a drought situation, if there isn’t
enough moisture in the root zone, the crops will wither/ wilt.
Water use for domestic purpose and for animals: Water used for drinking,
cooking, washing, cleaning and for animals is vital. Planning for this component is
needed to increase the availability so that a minimum amount is actually made
available to all, irrespective of their income.
Water for industrial use: Water is required for manufacturing processes and
this demand often competes with domestic and agricultural uses. This needs to be
taken into account as this conflict is on the increase. The challenge areas facing
industrial use are recycling of water and control of pollution.
What is available to a region or a village does not only depend on the inflows
but also what is already available as ‘stock’that we use. We often have to keep this
distinction between stock and flow clear in our analysis. For example imagine a
tank that is constantly being filled by an inlet pipe and water is also constantly used
by an outlet pipe. We can measure the inflow as the amount of water liters/ minute
and the outflow similarly as the water liters/ min that flows out. The amount of
water in the tank keeps varying but at any one moment in time, say at 8.30 am, we
can measure the amount in liters. This is the stock of water at that time.
A village may have tanks, ponds, lakes, these are all surface storages. Most
villagesinIndiadrawwaterfromwellsandtubewells.Theyaredependentonground
water storage. These inflows and storage are connected. While some of the water
flowing in is used directly, one part of this is recharging or replenishing the storage.
Similarly, the use of tube wells draws water from storages and lowers the water
available in them. Depending on comparative rates of inflow and outflow we can
judge what is happening to the stock of water over many years. The question that we
face today is the depletion of ground water storages and a tendency not to care
about the availability for future generations.
The annual flows and stocks that recharge wells and tube wells is the water that
is available for use. We should keep our needs in this range. When we dig into
deeper aquifers - this is like mining water that has collected over thousands of
Free distribution by A.P. Government 63
years. This is to be done only in extreme drought situations and replenished in
good rainfall years. We will come back later to this question of ‘sustainability’.
Water use in the Tungabhadra river basin
Tungabhadra,sharedbythetwosouthernstatesofKarnatakaandAndhraPradesh,
is a tributary of the larger river system Krishna. It originates in the Western Ghats
with a catchment area of 71,417 km2
, of which 57,671 km2
are in Karnataka. The
Tungabhadra basin has two parts: 1) the upper and middle catchment in Karnataka,
and 2) the lower portion of the catchment inAndhra Pradesh.
According to official statistics, farmland is the main land cover in these states.
Others such as trees, groves, fallow land, cultivable
waste, permanent pastures, forests and natural
vegetation cover the rest of the area. Some of the
territory is used for storage by water harvesting systems called tanks. The lower
portions of the basin, in Andhra Pradesh are characterised by lower rainfall and
drought conditions. Some regions depend on rainfall and underground water (wells
and tube wells). Other areas depend on surface flows by canals that carry water
from dams built alongTungabhadra.There is a lot of difference in water availability
between these two types of regions.
Encroachment of public lands for cultivation is common. It results in more
land being brought under cultivation at the
expense of tree cover. Rampant felling of
trees and mining activity is resulting in
forest degradation, along with the
destruction of the habitat of highly
threatened flora and fauna. Inflows of
groundwater depend on the tree cover in
the catchment areas. Inadequate tree cover
leads to water run-off as surface flow
without getting a chance to recharge the
underground system. Moreover this also
causes flash floods. If we wish to be fair
to both the rainfed and canal irrigated
regions, we must adopt a different plan for
waterconservationandasystemofsharing
water.
Tungabhadradamhasgraduallylostits
water storage capacity over the decades.
About 50 years ago, the capacity of the
reservoir was 3,766 million cubic meters,
now with accumulation of silt due to
mining, dust, soil erosion, debris, the
On a map of India trace the
course ofTungabhadra river.
Fig 5.2 : Tungabhadra Dam Construction - 1952
Social Studies64 Indian Rivers and Water Resources
reservoir has lost its storage capacity by as much as 849 million cubic meters of
water. As one study says, “No proper mining standards are followed in iron ore
extraction. The mining of iron ore at Kudremukh and manganese in Sandur has
seriously affected the stability of the catchments in the form of soil erosion and
siltation of several small reservoirs, traditional tanks and Tungabhadra reservoir.”
Conflicts between Karnataka andAndhra Pradesh are generally related to what
is available for use. Water is a flow resource and its storage or use upstream affects
what is available to people downstream. Water is shared based on agreements
between state governments.
Access to water is a precondition in this farmland area where 80% of the
population depending on agriculture for their livelihoods. Irrigation is provided
through canal systems, while in rainfed regions farmers extract groundwater through
bore wells. The major crops grown include paddy, jowar, sugarcane, cotton and
finger millet.
Although the area is ideal for semi-arid crops, the major crops grown demand a
lot of water (paddy and sugarcane). Cultivation of such crops throughout the basin
has dramatically altered the water sharing balance. When all areas desire water for
these crops, conflict becomes inevitable. Hence, there is a significant difference
between those farmers with access to land and irrigated water, and those without
access. For a fair use of water for all, a change in cropping pattern would have to be
encouraged throughout the basin.
During the last two decades there has been an increasing trend in the number of
small towns and industrial areas. This has made the competing demands for water
more complex. While increased industrialisation and growth of urban areas have
improved standards of living for some, the same activities have caused pollution
especially by industrial units. There are 27 functioning large units and 2543 small
units in this river basin. They consume a big amount of water per day. Industries
were permitted to discharge effluents into the river but following public protests
in 1984 regarding discharge of molasses that killed fish on a large scale, laws were
enacted requiring industry to discharge only treated effluents. These laws are not
implemented forcefully. Hence, severe pollution of the river system continues.
There has been a mismatch between keeping pace with development activities
on various fronts and providing sanitation and drinking water supply for all sections
of society, both in small towns and rural areas. Some say that drinking water and
sanitation are basic needs and a minimum amount has to be provided irrespective
of the ability to pay for these. When we experiment with metered water we have to
allow that a certain section of society would not be able to afford the water that
they must get as a basic requirement.Areport for this river basin says, “…provision
of drinking water to townships is not planned well, particularly the small towns
have serious access and equity related issues, more so during summer.”
Free distribution by A.P. Government 65
Thus, the socio-economic aspects are of very
important to water use management. Conflicts
withincommunitiesinaregionandacrosssectors
such as use for agriculture, industry or drinking
water are common. Apart from this, interstate
disputes between Karnataka andAndhra Pradesh
arise due to the trans-boundary nature of the river.
Rational and equitable Use of water - an example
We have read about the use of water and the need to look at all the inflows and
outflows so that a judicious use and with fairness can be worked out. This could be
for a river basin or a village. Such plans and implementation schemes are possible.
Hiware Bazar village is an example.
Hiware Bazar was selected under the Adarsh Gram Yojana of Maharashtra
governmentforwatershedandall-rounddevelopmentofthevillage.HiwareBazar
is located in Ahmednagar district in Maharashtra. It is situated on the eastern
(rainshadow) side of the Sahayadri mountain ranges that run north-south and
separate Konkan, the coastal region, from the rest of Maharashtra. Ahmednagar
district is drought prone with an average annual rainfall of about 400 mm.
The soil and water conservation works in Hiware Bazar were implemented
on common lands and on private grasslands. Continuous contour trenches (CCTs)
were dug on the hill slopes to arrest the erosion of soil, harvest water and en-
courage growth of grass. A number of water harvesting structures were also
built in the village - check dams, percolation tanks, and loose boulder structures.
Plantations on forest lands and roadsides were also part of the programme.
When Adarsh Gram Yojana was launched in Maharashtra, there were also
some pre-conditions set for selection of villages. Most important were the four
bandis (orbans)madefamousbytheRalegaonSiddhiexperience.Thefour bandis
were kurhad bandi (ban on felling trees), charai bandi (ban of free grazing),
nasbandi (family planning), and nashabandi (ban on liquor). People also had to
agree to a certain amount of shramdaan (voluntary physical labour), except for
the landless who were exempt from it.
The significance of these five ideals needs to be understood keeping in mind
the situation in Hiware Bazar at that time, the late 1980s. Tree felling and open
grazing was common amongst both rich and poor households. The surrounding
hillocks,accordingtomanylocalpeople,hadabarrenlook,soilerosionwaspromi-
nent and groundwater levels very low. In addition to this, fodder and fuel wood
shortage were common in the village. Though there was a ban on free grazing
people were allowed to cut grass and carry it to feed animals.
How would it help if there was a
government river basin authority
for overall planning of water use?
What are the different conflicts in
the use of water for Tungabhadra
river basin?
Social Studies66 Indian Rivers and Water Resources
There are other bans in the village which were added later. Most significant
was the ban on borewells for irrigation, growing sugarcane and banana and sell-
ing one’s land to any outsider. These measures illustrate that issues of long-term
sustainability (especially in terms of water use) were very much central to the
strategy. The bandis were not mere proclamations but ways of community build-
ing aimed at people identifying with the common purpose. But it was not always
a smooth affair.
The area irrigated for summer crops has increased from 7 ha to 72 ha. In a
year of normal rainfall, there is enough water in the wells to irrigate not only the
kharif bajra, but also the rabi jowar and some summer vegetable crops. Even in
unirrigated land, the improvement in soil moisture level has helped to increase
productivity. The range of crops is also considerably more diverse than in the
past with people growing cash crops such as potatoes, onions, fruits (grapes and
pomegranates) and flowers, and wheat. Perhaps the most significant develop-
ment is that increased water availability has made a second crop possible and
hence migration elsewhere has reduced. Although this has not meant that small
and marginal farmers are able to eke out a living on their own lands only, it has
made their lands much more productive. The conditions of wage employment
have also improved with wage rates going up – though they remain on the low
side.
Continuous contour trenches
Fig 5.3 : Hiware Bazar - before and after soil and water conservation works
BEFORE
Deep C.C.T. (1x1 Metre)
Deep C.C.T.(1x1 Metre) filled with rain water
AFTER Plantation
Free distribution by A.P. Government 67
The main thing is the social control over ground water extraction and use –
no borewells for irrigation (only for drinking water), no water- intensive crops
like sugarcane. Water for irrigation should be taken only though dug wells. They
also worked out certain thumb rule type of things like if they get good rainfall
then they can take full rabi crop, if the rainfall is less then they bring down the
area under rabi, etc. They keep rainfall data meticulously and use it for crop plan-
ning and water use prioritisation. Because of this even in years of continuous
drought there was no drinking water shortage. This is mainly because they plan
according to the water available.
The improvement of the livestock economy has also helped marginal and
small farmers significantly. Concerted efforts have been made to promote Hiware
Bazar’s dairy industry as a means to improve the livelihood of all. Loans have
been given to many small farmers. As a result, the number of milch animals in
the village has increased. These developments are clearly linked to the fact that
fodder availability has increased due to better productivity. Milk production in
the village has also witnessed a more than 20 fold increase from 140 to 3,000
litres per day.
However one of the learnings has been that groundwater extraction cannot
be controlled at a small unit or within
a village boundary. Neighboring vil-
lages started going for deep borewells
and started extracting groundwater
over which Hiware Bazar had no con-
trol. Hence we need institutional
norms and understanding at a much
larger unit like sub-basin or river ba-
sin.
Water as common pool resource
Over the past few decades groundwater has become the main source, especially
for domestic use and agriculture. This tremendous increase in the use of groundwater
has significant impact on water availability and access to it.
The current laws about groundwater in many states are both outdated and
inappropriate. They were developed at a time when groundwater was a marginal
source of water. Today shallow and deep tube wells have the potential to draw a lot
of water. What should be the judicious way of using this water?
Current laws on ground water use are inappropriate because the basic link
between access to groundwater and land ownership on which these rules are based
are flawed. Since groundwater has to be extracted from the land above, a link was
established between land ownership and control. The water drawn from the
Underline sentences that reflect efforts
takenforwaterconservationinHiwareBazar.
What was the effort for planning agriculture
according to the available water ?
If you have access to internet, watch a
documentary about Hiware Bazar at http://
bit.ly/kothL1
Social Studies68 Indian Rivers and Water Resources
underground system was assumed to be ‘owned’ by the landowner. This implies
thatgroundwaterismostlycontrolledbyindividualsthatowntheland. Landowners
were not restricted in the amount of water they can take out.
Why is the above understanding flawed? Underground water does not obey
human land ownership boundaries that are made on the surface. Water is a flowing
resource and what is extracted from an individual tube well or well depends on the
underground rock formation, the recharge from rainfall or surface water.All these
factors are happening over a large area. Hence the actions of others in the region
will affect this particular well. For example, over-extraction from one tube well
often dries up other tube wells around. Each one competes to go deeper than their
neighbour and soon all tube wells up to a certain depth dry up, since these wells are
interconnected by the underground structures in the region. It is therefore
inappropriate to think of ‘ownership’of a flowing resource such as water. Compare
this to the air over the plot of land - it is always flowing and there’s no way one can
create boundaries. Similarly there are no boundaries in the flowing water
underground.
Today this is the major source of water for people. When there is so much
extraction it affects others in connected areas. It affects the stock of water that
would be available for future generations. Therefore one can’t allow individual
landowners to extract as much water as they wish from their land. There should be
some restrictions. These restrictions will be acceptable if we first delink the
connection between ownership of land and water drawn from the underground
system through tube wells on the land.
Where control over groundwater is linked to land rights, there are no pressures
on individual landowners to use water in a fair manner. Nor is there any way to
implement policies that take into account the welfare of a broader community and
the environment. In what is, for all practical purposes, an unregulated system, there
is, for instance, no authority that can determine how many wells, handpumps and
other tubewells can be sunk in a given area. Some form of regulation that takes
into account the broader aspects of groundwater use is necessary. Therefore water
should be thought of as a collective pool resource that is meant for all people.
Similar to roads, rivers, and parks, underground water is also ‘public property’, it
belongs to all. While this is being recognised today, by some state governments, it
has still not become widespread.
Regulation is not easy. This is also because for some resources like water,
electricity, oil, natural gas etc consumption by one person or a sector affects what
is available for others. In fact, in a number of states, the answer to falling water
tables has been not to address the issue itself. State governments have thus often
chosen to increase power subsidies to make extraction of ever deeper layers of
groundwater possible. The limits of an approach that not only refuses to control
access to groundwater but seeks to encourage it with specific subsidies have been
Free distribution by A.P. Government 69
clearly understood. The political thinking has to change to make regulation work.
This is the only way to stop the negative competition to finish off the common
pool resource, since each person wants their share before someone else. This is
the real contemporary challenge.
What is required are laws and rules to recognise that water is a common flowing
resource. Drinking water is the first priority as well as a human right and that
panchayati raj institutions must have control over the use of groundwater.
Let us see the dispute over water use between the Perumatty Grama
Panchayat in Kerala and the Coca Cola Company. The Panchyat decided not to
renew the license for extraction of water because of the lowering of the water
table in neighbouring areas. There was also decreasing water quality to the ex-
tent that the local government primary health centre had concluded that the
water was not fit for drinking. The issue was brought to the courts and is now
pending in the Supreme Court, as on Janury 2014. The two decisions given by
judges in Kerala gave two oppossing views of groundwater regulation. The first
judge found that groundwater is a public resource meant for all, and that the
state has a duty to protect it against excessive exploitation. Additionally the judge
made the link that drinking water is a priority. The second judge took a com-
pletely different perspective and asserted the primacy of landowners’ control
overgroundwater.Thesetwocontradictorydecisionsillustratetheconfusionover
our laws today.
In conclusion
In the first section, we looked at the river systems and the diverse
physiographic conditions that we find in India. Water use for any region, whether
small watershed or river basin, has to
take into account all the inflows and the
outflows. With this background we can
understand the inefficient and unfair
ways through which water is currently
used. How we could be more judicious
and fair is examined through the case
study of Tungabhadra river basin. This
is a complex exercise, but possible.
Similarly, for a small region through
careful planning and social initiative a more judicious use of water for all is feasible.
We looked at the effort of the people of Hiware Bazar village and hope that people
all over would be inspired towards creative action in their situation.Water resources
require both collective action at the local level and appropriate laws and policies at
the state and national level. Through the example of groundwater we can understand
the shortcomings in our thinking today.
Should groundwater regulation be
primarily community-led, as in the case
of Hiware Bazar?
“The groundwater laws are both outdated
and inappropriate.” Explain.
Should groundwater be considered a
common pool resource? Explain your
view.
Social Studies70 Indian Rivers and Water Resources
Improve your learning
1. Create a table to describe major river systems in India with the following items:
direction of flow, countries or regions through which they pass through, and relief
features of the areas.
2. Identifyandlistargumentsthatwouldsupportoropposeuseofgroundwaterinvarious
contexts, such as agriculture, industry etc.
3. What are the different inflow and outflow processes in the context of water resource?
4. Which of the inflow or outflow processes has most impact in the context of
groundwater resources?
5. Make a list of challenges faced in the water resources in the Tungabhadra basin.
Identify the solutions that have been discussed in the context of these problems
either in this chapter or elsewhere in different classes.
6. There has been various ways in which changes occurred in the context of water
resources. Describe the positive as well as negative social changes that got reflected
in this chapter.
7. Which aspects of farming practices were regulated in the context of Hiware Bazar
to improve the water conservation?
8. How significant are the laws, people’s actions, in the context of water resources?
Write a short note based on the ideas discussed in the last two sections of the chapter.
9. Ifyouhaveaccesstointernet,visitwww.aponline.gov.inandlearnmoreaboutAndhra
PradeshWALTA Act.
10. In what ways is water bought and sold in your area and for what purposses? Do you
think there should be some checks and balances for this? Discuss.
Key words
Flow resoruces Groundwater Drainage Water Sharing Law
Watershed CatchmentArea Drought Percolation
Project
Think of plans for your village or locality, which if implemented would help everyone.
Free distribution by A.P. Government 71
Population is a pivotal element in social studies. When we refer to ‘development
forall’itispeoplethatwehaveinmind,especiallytoincludethosewhoarenormally
marginalised in the process of development. The idea of equality is used with
reference to people. On the other hand, you often hear people blaming “population
growth” for all problems that we face.
They blame the lack of jobs, food, and
resources on the fact that we have to
sharethiswithmanypeople. Ninetytwo
percent of the working people in India
are in the unorganised sector.They have
to struggle for work and have no other
social security apart from their families
tosupportthem.Howdowemakesense
of these contradictions? It is important
to understand population numbers, its
distribution and characteristics that
provide the basic background for
understanding and appreciating the
other aspects.
CHAPTER
6
Map 1 : If we were to show the area of countries on the basis of population
it would look like this. How is it diffrent from other world maps? Discuss.
Talk to a few people in your
neighbourhood who have different
occupations and incomes. Find out about
their views on the ideal family size.
Have you ever wondered how information
about the people living in your locality or
village, and the country as a whole is
collected and recorded?Ask your teacher
to explain their experiences of collecting
census data.
What is the difference in collecting
information using a census or a sample
method? Discuss with few examples.
The People
Social Studies72 The People
The census of India provides us with information regarding the population of
our country. A census is the procedure of systematically acquiring and recording
information about the members of a given
population. Once in ten years information
is collected about all people living in India.
The people who do this survey go from
house to house and find out the number of
peoplelivingineveryhouseineveryvillage,
town and city.This census provides us with
a lot of information such as how old people
are, their occupation, houses, education,
religion etc. The Registrar General &
Census Commission of India, organises the
collection and recording of this information.
Before we find out more about the census, let us survey our own area and
examine the kind of work done by the census.
Conducting a Survey
Each group of two to three students will collect data from 10 families of their
locality. The survey form is given below.
Each group will fill in the details and construct the tables indicated.
Based on the tables presented by each group, the class will discuss the questions.
Household 1 Male Female Age School Occupation
Name Education for 15 +
Household 2
Name
Before the survey:
The class needs to discuss and arrive at a common meaning for all the terms
used in the survey form. Otherwise there willbe confusion in the actual survey
and we would not be able to compare the result of one group with another.With
the help of your teacher discuss the following:
Census in India
In India the first census was taken in 1872.
The first complete census however was
taken in 1881. Since then censuses have
been held regularly every tenth year. India’s
population as of 2011 is 121,01,93,422. Out
of these 1210 million people, 623,724,248
are men and 586,469,174 are women.
Free distribution by A.P. Government 73
1. How would a “household” be defined? Whom all would you include?
2. For “Education”, what are the categories that you would use?
Examples: child below six; studying in school/ college, class….; should be in
school but not enrolled; studied up to class ..; did not attend school
3. What categories would you use for occupation?
Examples: Homemaker, Student, self-employed as…, Unemployed, retired,
non-employed, senior citizen
After the survey:
A) Each group would construct a table to show number of people in the surveyed
families:
Male Female Total Population
B) What is the female/ male ratio for your group? Are the ratios very different
among the groups? Discuss.
For all children 6-14 years
Children Male Female Total
At school
Dropped out
Never enrolled
C) What is the percentage of dropouts & never enrolled children as a whole- for all
groups? What are the reasons for this?
D) For those above 20 years, what is the average time they have spent at school?
Find this for your group. Is this data useful?
E) For all people in the age group 15-59
Occupation No %
Self-employed
Homemaker
Job
Unemployed
Student
Total
How do you classify those who are “working” and those who are “dependent” in
your sample?
Social Studies74 The People
What does the census show?
Age Structure
The age structure of a population refers to the number of males and females
in different age groups in a country. It is one of the most basic characteristics of a
population. To an important degree, a person’s age influences what she requires,
her capacity to work, whether she is dependent on others, etc. Consequently, the
number and percentage of children in a population, people of working age, and
aged persons are notable determinants of the population’s social and economic
structure.
The population of a nation is generally grouped into three broad categories:
1. Children (generally below 15 years) : They are taken care of by the
family and like everyone else they require food, clothing, education and medical
care and all other opportunities for growth. However, usually they do not earn their
income to support themselves. It is not desirable that some children are forced to
work because of economic conditions.
2. Working Age (15-59 years) : Usually this group forms the working
population in a society. They are also biolgically reproductive. Most people in
this age group desire decent income and security of work. Children and the aged
often depend on the earning of this group.
3. Aged (Above 59 years) :
Those who have been in a
salaried employment or in
organised sector may get
retirement pension. However, a
vast majority of agricultural
labourers, domestic workers,
construction workers, and others
usually continue their work as
long as it is physically possible.
These groups also depend on
their families for support in old
agewhenunabletowork.Itisalso
possible that their medical
expenses are higher than that of other age groups.
From the age pyramid above identify a rough estimate of the percentage of children
in the population.
Based on your survey present following items in a table : Population, Children,
Working,Aged,
Male Female
Ageinyears
percentage
Graph 1 : Population Pyramid of India, 2011
Free distribution by A.P. Government 75
Think of various ways in which government should have special schemes for
different groups. Examples could be midday meal schemes; anganwadi
programmes etc. Why are they necessary?
Sex Ratio
Sex ratio is the number of females per 1000 males in the population. This
information is an important social indicator to measure the extent of equality
between men and women in a society. You have calculated this for the families
thatyousurveyed.Nowexamine
these figures for the country as
a whole.
We notice that the number
of females in India has
consistently been lower than
that of men. This female/ male
ratio, the ‘sex ratio’ is a cause
of concern since it indicates a
hidden form of discrimination.
Women and girls in particular
face inequal opportunities for education and development. In the most basic needs
of nutrition, child care and health also they are discriminated against – they get
less of these things than males. This happens within the same family. This
discrimination is not always obvious.
Medical research shows that given similar circumstances, girl children survive
much better than boys. Hence if there was no discrimination, the number of girls
should be higher or as much as boys. From the census survey, we get another
indicator. In India, 103 female babies are born against 100 male babies. However,
more female babies die than male babies. The census shows that in the age group
0-5,thenumberofgirlswhosurviveismuchlowerthanboys.Thiscanonlyhappen
if there is some discrimination in their care and nutrition because otherwise the
physical chance of survival is better for girls.
The other evidence that we have is from comparative figures. If we look at
societies or regions that have provided equality for women and provided equal
opportunities for them, the sex ratios are different. Regions that have unequal
gender relations that favour the males and discriminate against the females tend
towards unequal sex ratios. This can happen even though they have high incomes.
For example, look at the following data:
Area Haryana Punjab AP Kerala USA
Sex ratio 870 880 970 1040 1050
Graph 2 : India Population : Sex Ratio, 1951 - 2011
Social Studies76 The People
It is noted that within India
certain parts like Kerala have a
positive sex ratio while some other
regions are extremely biased
against women. A distressing
aspect of gender bias in India that
shows little sign of going away is
the preference for boys over girls.
One of the worst manifestations of
this pro-male bias is the relatively
higher mortality rates of girls
comparedwithboys.Thisismainly
because of the quiet violence of
the neglect of their health and
illness in comparison with the
attention that male children
receive. There has also been the
case of female fetus infanticide.
Due to the preference for male
children parents may decide to
abort the female child before birth.
Many families consider female
children as a burden. Studies have
shown that male priority in health
continues for adults, raising the mortality
rates of even adult women above those of
adult men.
Women’s education has been a
powerful force in reducing discrimination
against women. There is definitive
evidence that women’s literacy and
schooling reduce child mortality and work
against the selective neglect of the health
of girls. To understand such situations
discuss the questions on the right and
whether this would impact the sex ratio.
Literacy Rates
According to the Census of 2011, a person aged 7 years and above who can
read and write with understanding in any language, is treated as literate. Literacy is
a key for socio-economic progress.
Do girls get similar opportunities for
further studies as boys?
Do married women have opportunities
for travel and work outside home?
Are women expected to maintain a
separation from their natal family and
not ask for security or property rights?
Is there a strong boy preference in
your region?
Death
before
we
are
born
Treated less
equal than
brother
Married off
at early age
Fig 6.1
Free distribution by A.P. Government 77
At independence in 1947, 12% of the
population was literate. In 2001 it was 64.84%.
It grew to 74.04% by 2011. However, the 2011
census shows that there is a wide disparity in
literacy rates for men (82.14%) and women
(65.46%).
Working population
It was pointed out earlier that those who are in the age group 15-59 are working
people. They might work the whole year or only a part of the year. This depends on
the availability of work.As discussed earlier this does not cover the unpaid work of
home makers (see Table 1).
The Census of India groups them into
four categories. Cultivators are farmers,
who farm or supervise the land that they
own or take on rent.Agricultural labourers
are those who work on another’s farm for
wages in cash or kind. Workers in
household industries would be those who
are manufacturing or repairing some
product at home such as dehusking of
paddy, bidi workers, potters, weavers, repair of
footwear, manufacture of toys, matches, etc.
Other workers would be those who are
employed in factories, trading, causal labour
and all other occupations.
Changing population size
Population is dynamic. The numbers, distribution and composition of the
population are always changing. This is because of the interaction of the three
processes: (1) births, (2) deaths and (3) migrations.
Change in the size of a population is the difference in the number of inhabitants
of a country/ territory during a specific period, say during the last ten years. Such
a change can be expressed in two ways: (1) as absolute numbers, or (2) as percentage
change.
The absolute numbers added each decade is the magnitude of increase. It is
obtained by simply subtracting the earlier population (e.g. that of 1991) from the
later population (e.g. that of 2011). If the result is a positive number, the population
hasincreased.Ifitisanegativenumber,thepopulationhasdecreasedbythatnumber.
Population change (absolute numbers) = (population at later date) – (population
at earlier date)
Find out if there are illiterate
people in your village or town.
What does your survey reveal?
Discuss: How does literacy impact
development?
Table 1 : Distribution of workers as per
Census -2011
Workers Percentage of workers
Cultivators 25
Agri. Labourers 30
Workers in hous- 04
ehold industries 59
Other workers 41
How is an agriculture labourer
different from a cultivator?
Compare the type of workers that
you find in your survey with that of
the Census?
Social Studies78 The People
Population change in a place = (number of births + number of in-migrants) –
(number of deaths + number of out-migrants). A positive number means the
population has increased by that number.Anegaive number shows it has decreased
by that number.
Assume for the moment that there is no migration. In order to calculate these
increases we examine two rates. (1) Birth rate is the number of live births per
thousand persons in a year. In 1992 the birth rate in India was 29. This means that
for every 1000 people living in the country during that year 29 live births took
place. (2) Death rate is the number of deaths per thousand persons in a year. For
the year 1992, for every 1000 persons living at that time 10 people died during the
year. Therefore 19 people for every 1000, was the addition during the year. This
number can be expressed as a percentage i.e. 1.9%. Hence we say that the population
growth rate was 1.9% for the year 1992.
The rate or the pace of population increase is important. It is studied in per
cent per annum, e.g. a rate of increase of 2 per cent per annum means that in a given
year, there was an increase of two persons for every 100 persons in the base year.
This is calculated year by year like in compound interest. This is referred to as the
annual growth rate. India’s population has been steadily increasing.
In order to examine causes for the growth of the Indian population, as seen
from the graph above, we need to look at both death rates and birth rates. There has
been rapid decline in the death rates but till recent times birth rates were not
decreasing substantially. From 1900 onwards and especially post independence
impact of famines declined because of famine relief, movement of grain, ration
Observe the increment in
population of India and its
growth - 1901-2011
(Graph 3)
In which year did the
population decrease?
From which year onwards is
the population continuously
increasing?
What could be the reasons
for the speed with which
increases took place after
Indian independence?
Graph 3 : India Population (in millions) :
1901-2011
252.09
238.40
251.32
278.98
318.66
361.09
548.16
846.42
683.33
1028.74
1210.19
439.23
1901 1911 1921 1931 1941 1951 1961 1971 1981 1991 2001 2011
POPULATION(INMILLION)
1400.00
1200.00
1000.00
800.00
600.00
400.00
200.00
0.00
Year
Free distribution by A.P. Government 79
shops and an active public voice in a democracy. Similarly epidemics such as
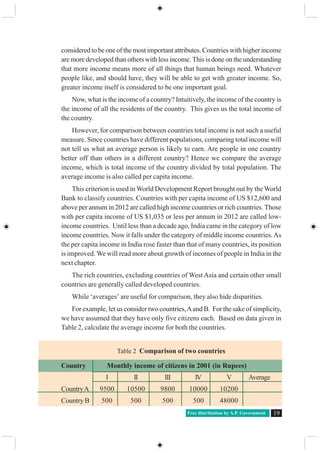
cholera, plague and to some extent malaria were controlled. Polluted water,
congested living and un-cleared garbage were the real causes of several diseases.
That these have to be met with better sanitation, clean water and nutrition began to
be accepted and several steps were initiated. Later on advances in medicine,
especially antibiotics and vaccines contributed to better health care. Compared to
1900, death rates fell rapidly. High birth rates together with declining death rates
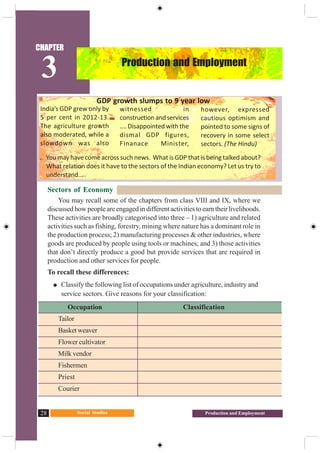
led to higher rates of population growth.
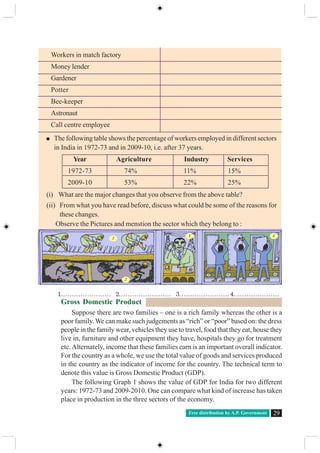
Why did birth rates remain high for such a long period? One set of reasons
has to do with what has happened in the past. If in the overall population the
percentage of young people is high, then in the coming years they would grow up,
get married and have children. The total number of such children added would be
high, because we began with a population with a large number of young people.
The other reason is the number of children that couples wish to have. This in
turn is related to how many children survive, what social security people have and
the preference of male child in society. For example look at three generations of
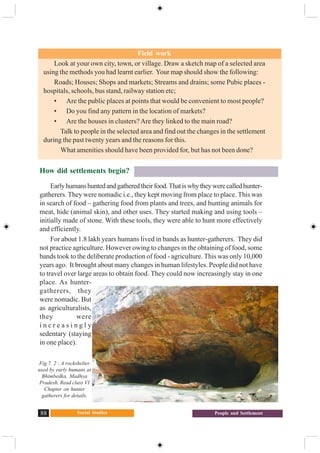
Umed Singh:
“Umed Singh’s grandfather and mother died because of a plague and chol-
era epidemic. His father, born around 1900 was brought up by his uncle. They
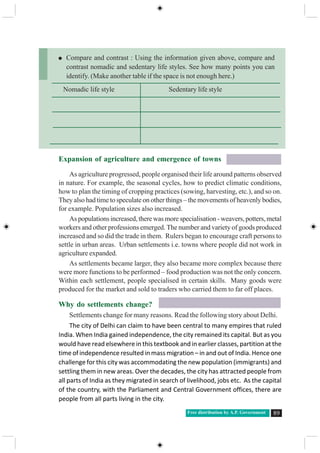
owned some land but faced constant crisis, sometimes crop failure and famine
with an only occasional good harvest. Umed Singh’s father had nine children
but six of them died very young. Out of the three surviving children, one was
Fig 6.1 : Here are two posters from other countries.
Can you guess the message given in them? Have you
seen similar posters in India? Discuss.
Social Studies80 The People
Umed Singh, born around 1935. He has two sisters. Umed was able to go to a
secondary school and become a policeman. Unlike his father he had regular sal-
ary and some income from land. Umed initially had two daughters but was wor-
ried about their survival. He also wanted a son. He then had four more children,
three of them were sons. However, now Umed’s eldest daughter who has trained
to be a teacher does not want more than three children.”
Since 1981, birth rates have also started declining gradually, resulting in a
gradual decline in the rate of population growth. Calculate the % change over the
decades 1951 to 2011 and see if this is happening in the table above.
How do we understand this trend? We use another concept called the Fertility
rate (total births per woman). Total fertility rate is the number of children that is
likely to be born to a woman if she were to live to the end of her childbearing years
and bear children in accordance with current pattern. If this declines then we can
say that couples are deciding to have fewer children. Factors both within the family
and outside are contributing to these
decisions. Examine the Graph 6.4.
The fertility rate for India in 1960 was
more than 5.6, which indicates that on an
averageeachwomanwaslikelytobearfive
or six children. The family decides the
numberofchildrentheywantdependingon
security, opportunity for children and
social norms. There have been some
changes in this outlook. Present fertility
rate in India is 2.7,Andhra Pradesh fertility
rate is 1.9.
Table 2 : The Magnitude and Rate of India’s Population Growth
(calculate the missing figures and write them down)
Year TotalPopulation Absoluteincreasein Percentage change in
(Inmillions) the decade the decade
1951 361
1961 439 78
1971 548 ?
1981 683 ?
1991 846 ?
2001 1029 ?
2011 1210 ?
Graph 4 : Fertility Rate in India, 1961 -2011
Free distribution by A.P. Government 81
The third component of population
change is migration. Migration is the
movement of people across regions and
territories. Migration can be internal
(within the country) or international
(betweenthecountries).Internalmigration
does not change the size of the population,
but influences the distribution of
population within the nation. Migration
plays a very significant role in changing
the composition and distribution of
population. You will know more about
migration in the forthcoming chapter.
We often hear people talk of
populationgrowthinalarmedtones.These
people are often literate and talk about
others not benefitting because there are
too many people who have to share few
resources. However, families decide the
numberofchildrentheywanttohavebased
on many considerations such as the
resources they own, their security in old
age etc. Most often families with larger
number of children are poorer than the
rest, don’t own many assets, and rely on their children for old age security. How
do we understand these different points of view?
Population density
Population density provides a better picture of its distribution. Population
density is calculated as the number of persons per unit area.
India is one of the most densely populated countries of the world. The
population density of India in the year 2011 was 382 persons per sq km. Densities
vary from 904 persons per sq km in West Bengal to only 13 persons per sq km in
Arunachal Pradesh. Assam and most of the peninsular states have moderate
population densities. Hilly, dissected and rocky nature of the terrain, moderate to
low rainfall, shallow and less fertile soils have influenced population densities in
these areas. The Northern Plains and Kerala in the south have high to very high
population densities because of the flat plains with fertile soils and abundant
rainfall.
Identify the three states of the Northern Plains with high population densities.
How does the density of population vary so much?We have to examine the history
When the fertility rate is near 2, what
does this imply? Discuss.
Talk to some couples who are recently
marriedbutdonothavechildren.How
many children do they plan for?
What are the reasons?
In your family trace the number of
children for every woman in three
generations. What changes do you
observe?
Usethesurveyyouhavedoneingroups
and find out total number of women
in the age group 45 and above and
number of their children. What is the
average number of children per
woman in your sample?
What are the factors that influenced
the decisions about children for Umed
Singh? Do you think his daughter is
thinking in a similar manner?
Social Studies82 The People
of the region, the terrain and climatic conditions to be able to understand this
variation. For example in chapter 9 read the section on ‘Land and other natural
resources’. Even though the fertile land & irrigation is able to support a larger
population than before, the impact on each group is different, especially for small
farmers and landless labourers.
By which year was all the land in the village cultivated?
How do you think landed people responded to increasing family’s size?
What was the response of small farmers, like Govind, when families expanded?
How far was tube well irrigation useful ?
Look at the map 2. Find out if there is any relationship between relief features
of India and population density. Identify major urban centers across the country.
How do you explain the high population density in the cities?
Map 2 : Population density of
India at district level
Index
(persons per square
Km)
Free distribution by A.P. Government 83
Here are the data for population density ofAndhra Pradesh -2011. On the above blank
district map ofAP plot them in ranges.
Compare a high density district and a low density district on the following
a. Terrain and potential for agriculture development
b. History of agriculture in that region- use of land, water and other natural resources
c. Migration to or from that region and reasons for this
Map3:OutlinemapofAndhraPradesh
Rank in District Population
2011 (2011)
1 Hyderabad 18480
2 Rangareddy 707
3 Krishna 519
4 West Godavari 508
5 East Godavari 477
6 Srikakulam 462
7 Guntur 429
8 Vishakapatnam 384
9 Vizianagaram 358
10 Karimnagar 322
11 Nizamabad 321
12 Medak 313
13 Chittoor 275
14 Warangal 274
15 Nalgonda 245
16 Kurnool 229
17 SPS Nellore 227
18 Mahabubnagar 219
19 Anantapur 213
20 Prakasham 192
21 YSR Kadapa 188
22 Khammam 175
23 Adilabad 170
Social Studies84 The People
Key words
Population growth Population density Sex Ratio Fertility Rate
Population distribution Infanticide Literacy rate
Improve your learning
1. Identify the false statements and correct them:
a) Census data is collected every 10 years
b) Sex ratio refers to the number of female in adult population
c) Age structure shows us the distribution of people according to their age
d) Population density is higher in mountains as people like the climate there
2. Based on the following table answer the questions below.
World historical and predicted populations (in millions)
Region/ year 1500 1600 1700 1800 1900 1950 1999 2012 2050 2150
World 458 580 682 978 1,650 2,521 5,978 7,052 8,909 9,746
Africa 86 114 106 107 133 221 767 1,052 1,766 2,308
Asia 243 339 436 635 947 1,402 3,634 4,250 5,268 5,561
Europe 84 111 125 203 408 547 729 740 628 517
Latin America and
the Caribbean 39 10 10 24 74 167 511 603 809 912
Northern America 3 3 2 7 82 172 307 351 392 398
Oceania 3 3 3 2 6 13 30 38 46 51
• Identify roughly how many centuries it took for the world population to double
for the first time.
• In earlier classes you had studied about colonisation. Look at the table and identify
in which of the continents the population decreased by 1800.
• Which continent has been most populous for most period of time?
• Is there any continent that is projected to show a significant decrease in population
in future?
3. List out the impacts on society if sex ratio is too low or too high.
4. Compare Indian literacy rates with other countries:
Brazil , Sri Lanka , SouthAfrica, Nepal , Bangladesh , Norway , Chile , Indonesia
What similarities and differences do you note?
5. Which areas ofAndhra Pradesh have high density of population and what may be
some of the reasons behind it?
6. Distinguish between population growth and population change.
7. Compare the population pyramid of India with data of three other countries given
here.
Free distribution by A.P. Government 85
Which country’s population
is likely to grow?
Which country’s population
is likely to reduce?
Compare the gender
balance: What can you tell
about each country’s family
and welfare policies?
8. Map work:
a. OnablankmapofIndiashowing
state boundaries, plot the state-
wise population density based
on the 2011census by taking
five ranges.
b. On a blank map ofAndhra Pradesh showing district boundaries, plot the population
distribution using the dot method (one dot is equivalent to 10,000 population).
Project
Look at following two maps of density and the graphs on growth of population. Use
various aspects of population you studied in this chapter and describe them.
Social Studies86 The People
Population density
Algeria
Population density
Bangladesh
Forest Loss
Population Increase
Free distribution by A.P. Government 87
What is a settlement?
Look around the city or town or village in which you live.You will find that the
buildings, roads, drains, etc. are organised in some way. This arrangement varies
widely across the world, as we shall see a little later.
The way we organise ourselves and our living spaces in a place is called a
settlement – that is, the geographic space where we live and work. In a settlement,
we have different kinds of activities – educational, religious, commercial, etc.
In this chapter we will take a brief look at some aspects of human settlement
and the geography related to it.
CHAPTER
7People and Settlement
Fig 7.1 : abc These are images of Himalayas.
Look at all the pictures of Himalayas in chapter-
1and compare the differences in settlement and the
risk they need to take while building houses, use of
land, type of settlement etc
a. The City of Simla orignally designed for a
population of 25,000 today it has nearly 2 lakh
people.
b. Land slide on Himalayas
c. A Village in trans-Himalaya’s, in Nubra Valley of
Ladakh. This village is located next to a stream that
lows with glacier melting. Stream flows only during
summer and farming is possible only during this
season.The region receives almost no rain fall, the
mountains are barren.
a b
c
Social Studies88 People and Settlement
How did settlements begin?
Earlyhumanshuntedandgatheredtheirfood.Thatiswhytheywerecalledhunter-
gatherers. They were nomadic i.e., they kept moving from place to place. This was
in search of food – gathering food from plants and trees, and hunting animals for
meat, hide (animal skin), and other uses. They started making and using tools –
initially made of stone. With these tools, they were able to hunt more effectively
and efficiently.
For about 1.8 lakh years humans lived in bands as hunter-gatherers. They did
not practice agriculture. However owing to changes in the obtaining of food, some
bands took to the deliberate production of food - agriculture. This was only 10,000
years ago. It brought about many changes in human lifestyles. People did not have
to travel over large areas to obtain food. They could now increasingly stay in one
place. As hunter-
gatherers, they
were nomadic. But
as agriculturalists,
they were
i n c r e a s i n g l y
sedentary (staying
in one place).
Field work
Look at your own city, town, or village. Draw a sketch map of a selected area
using the methods you had learnt earlier. Your map should show the following:
Roads; Houses; Shops and markets; Streams and drains; some Pubic places -
hospitals, schools, bus stand, railway station etc;
• Are the public places at points that would be convenient to most people?
• Do you find any pattern in the location of markets?
• Are the houses in clusters?Are they linked to the main road?
Talk to people in the selected area and find out the changes in the settlement
during the past twenty years and the reasons for this.
What amenities should have been provided for, but has not been done?
Fig 7. 2 : A rockshelter
used by early humans at
Bhimbedka, Madhya
Pradesh. Read class VI
Chapter on hunter
gatherers for details.
Free distribution by A.P. Government 89
Expansion of agriculture and emergence of towns
As agriculture progressed, people organised their life around patterns observed
in nature. For example, the seasonal cycles, how to predict climatic conditions,
how to plan the timing of cropping practices (sowing, harvesting, etc.), and so on.
They also had time to speculate on other things – the movements of heavenly bodies,
for example. Population sizes also increased.
As populations increased, there was more specialisation - weavers, potters, metal
workers and other professions emerged. The number and variety of goods produced
increased and so did the trade in them. Rulers began to encourage craft persons to
settle in urban areas. Urban settlements i.e. towns where people did not work in
agriculture expanded.
As settlements became larger, they also became more complex because there
were more functions to be performed – food production was not the only concern.
Within each settlement, people specialised in certain skills. Many goods were
produced for the market and sold to traders who carried them to far off places.
Why do settlements change?
Settlements change for many reasons. Read the following story about Delhi.
The city of Delhi can claim to have been central to many empires that ruled
India. When India gained independence, the city remained its capital. But as you
would have read elsewhere in this textbook and in earlier classes, partition at the
time of independence resulted in mass migration – in and out of India. Hence one
challenge for this city was accommodating the new population (immigrants) and
settling them in new areas. Over the decades, the city has attracted people from
all parts of India as they migrated in search of livelihood, jobs etc. As the capital
of the country, with the Parliament and Central Government offices, there are
people from all parts living in the city.
Compare and contrast : Using the information given above, compare and
contrast nomadic and sedentary life styles. See how many points you can
identify. (Make another table if the space is not enough here.)
Nomadic life style Sedentary life style
Social Studies90 People and Settlement
Today, Delhi is the second largest city with more than 1,60,00,000 people. In
1951 this was near 20,00,000. During the last 60 years it has grown 8 times.
This rise in population was mostly due to in-migration. This has changed the
composition and settlement patterns of the city.
LetusbeginbylookingatthetypesofareaswherepeopleliveinDelhi.Though
the data are for the year 2000, the pattern of settlement remains the same. We
find that there were different types of slum areas or areas of the poor in the city.
All of them started as being unauthorised colonies. Later on some of these areas
were regularised and accepted by local authorities as valid settlements. These
became the designated slum areas or resettlement colonies or regularised –
unauthorised colonies. However other areas continue without being accepted
as legal settlements such as the Juggi Jhopdi clusters and Unauthorised colonies.
There were also some villages within the city. In all, as seen in the table below,
only about 24% of the population was living in colonies that had proper legal
status.
Table 1 : Type of Settlement and Population
Type of Settlement Est Population in Percentage of Total
2000 (‘000s) Population of City
Juggi Jhopdi clusters 20.72 14.8
Slum designated areas 26.64 19.1
Unauthorised colonies 7.4 5.3
Juggi Jhopdi resettlement colonies 17.76 12.7
Rural villages 7.4 5.3
Regularised-unauthorised colonies 17.76 12.7
Urban villages 8.88 6.4
Planned colonies 33.08 23.7
Total 139.64 100
Source: Statement 14.4 of the Delhi Economic Survey 2008-09 (Government of Delhi 2009)
Every city usually has a master plan to design and allocate different types of
areas. In any city there should be housing areas, markets, schools, industrial
areas,officeareas,parksandrecreationalareasandsoon.Basedonthis,planners
can decide what types of roads, how much water or electricity, how to dispose
waste, how to clean sewage etc would be necessary. The city of Delhi had three
such master plans. However, if we look at the current scenario it would appear
that these plans have not been implemented. In fact, Delhi has grown in an
unplanned manner. A planned colony usually has all facilities in place.