Study of consolidation parameters
having special focus on dissolution
Prepared by Alakesh Bharali
M. Pharm 1st semester
Girijananda Chowdhury Institute of
Pharmaceutical Science(GIPS)
Ghy-07
Under the guidance of
Dr. Abdul Baquee Ahmed
Associate Professor,
GIPS, Ghy-07
Contents
Introduction
Consolidation Parameters
Dissolution
Why dissolution studies?
Different types of dissolution apparatus
Dissolution Acceptance Criteria
Dissolution Parameters
Dissolution Profile
Objectives
Importance
2
Contd..
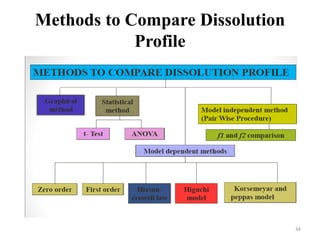
Methods to compare dissolution Profile
Graphical Method
Model dependant method
Model Independent Method
Pharmacokinetic Parameters
Heckel Equation
Application of Heckel Plot
Conclusion
References
3
Introduction
Consolidation: An increase in the mechanical
strength of the material resulting from particle
or particle interaction.
There are certain parameters to measure it.
By knowing these parameters and comparing ,
we can make appropriate necessary changes in
our formulation to achieve the same profile of
the BRAND LEADER.
4
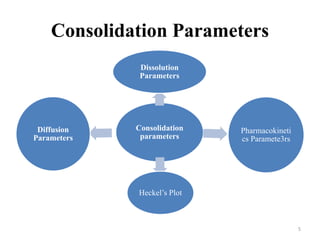
Consolidation Parameters
Consolidation
parameters
Dissolution
Parameters
Pharmacokineti
cs Paramete3rs
Heckel’s Plot
Diffusion
Parameters
5
Dissolution
Dissolution is a process in which a solid
substance solubilises in a given solvent i. e .
Mass transfer from the solid surface to the
liquid phase.
Dissolution and drug release tests are in-vitro
tests that measure the rate and extent of
dissolution or release of the drug substance
from a drug product.
6
Why dissolution studies?
To show that the rate of drug release is
uniform batch to batch
To show that the release is equivalent to those
batches proven to be bioavailable and
clinically effective.
Evaluation of bioavailability
Ensures quality and stability of the product.
7
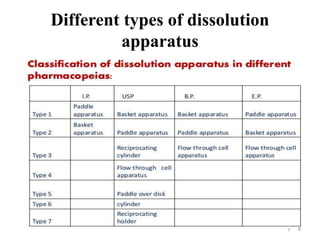
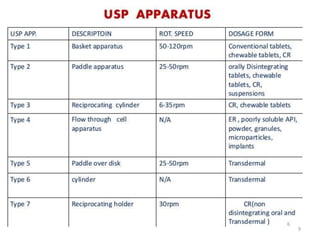
Different types of dissolution
apparatus
8
9
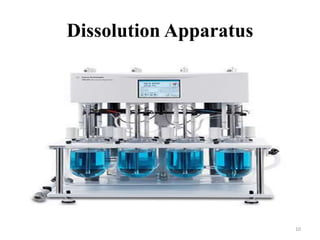
Dissolution Apparatus
10
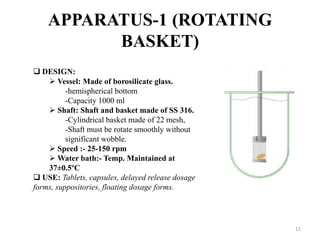
APPARATUS-1 (ROTATING
BASKET)
 DESIGN:
 Vessel: Made of borosilicate glass.
-hemispherical bottom
-Capacity 1000 ml
 Shaft: Shaft and basket made of SS 316.
-Cylindrical basket made of 22 mesh,
-Shaft must be rotate smoothly without
significant wobble.
 Speed :- 25-150 rpm
 Water bath:- Temp. Maintained at
37±0.5ºC
 USE: Tablets, capsules, delayed release dosage
forms, suppositories, floating dosage forms.
11
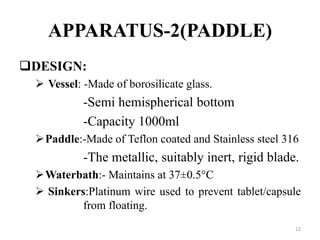
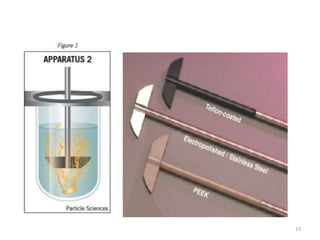
APPARATUS-2(PADDLE)
DESIGN:
 Vessel: -Made of borosilicate glass.
-Semi hemispherical bottom
-Capacity 1000ml
Paddle:-Made of Teflon coated and Stainless steel 316
-The metallic, suitably inert, rigid blade.
Waterbath:- Maintains at 37±0.5°C
 Sinkers:Platinum wire used to prevent tablet/capsule
from floating.
12
13
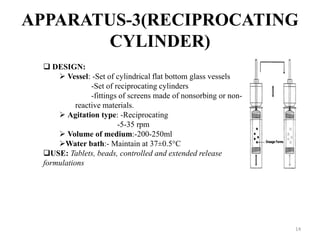
APPARATUS-3(RECIPROCATING
CYLINDER)
 DESIGN:
 Vessel: -Set of cylindrical flat bottom glass vessels
-Set of reciprocating cylinders
-fittings of screens made of nonsorbing or non-
reactive materials.
 Agitation type: -Reciprocating
-5-35 rpm
 Volume of medium:-200-250ml
Water bath:- Maintain at 37±0.5°C
USE: Tablets, beads, controlled and extended release
formulations
14
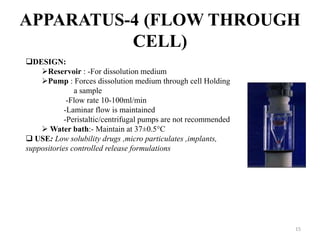
APPARATUS-4 (FLOW THROUGH
CELL)
DESIGN:
Reservoir : -For dissolution medium
Pump : Forces dissolution medium through cell Holding
a sample
-Flow rate 10-100ml/min
-Laminar flow is maintained
-Peristaltic/centrifugal pumps are not recommended
 Water bath:- Maintain at 37±0.5°C
 USE: Low solubility drugs ,micro particulates ,implants,
suppositories controlled release formulations
15
APPARATUS-5(PADDLE-OVER-
DISK)
 DESIGN:
 Vessel:- Made of borosilicate glass, Capacity 1000ml
 Shaft :- Stainless steel 316 and Teflon coated.
 Stirring elements- rotating speed 25-50 rpm
 Sample holder:
-disk assembly that hold a product in such a way
-that release surface is parallel with paddle
-Paddle is directly attached over disk assembly
-Samples are drawn between surface off the medium and top of the
paddle blade.
 Volume:900ml
 Temperature: 32 ± 0.5°C
 USE: Transdermal patches, ointments, floaters , emulsions etc.
 Modification: Disk design and volume
16
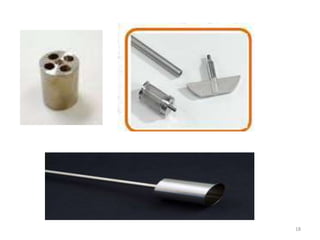
APPARATUS-6(ROTATING
CYLINDER)
DESIGN:
 Vessel : Same as apparatus 1.
 Shaft : Stainless steel 316, basket is replaced with
cylinder
 Sample : Mounted to inner porous cellulosic material
and adheres to cylinder.
-Dosage unit is placed in cylinder and release
from side out.
Water-bath: maintained at 32±0.5°C
USE: Transdermal patches and certain other solid
dosage forms
17
18
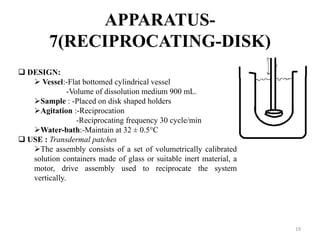
APPARATUS-
7(RECIPROCATING-DISK)
 DESIGN:
 Vessel:-Flat bottomed cylindrical vessel
-Volume of dissolution medium 900 mL.
Sample : -Placed on disk shaped holders
Agitation :-Reciprocation
-Reciprocating frequency 30 cycle/min
Water-bath:-Maintain at 32 ± 0.5°C
 USE : Transdermal patches
The assembly consists of a set of volumetrically calibrated
solution containers made of glass or suitable inert material, a
motor, drive assembly used to reciprocate the system
vertically.
19
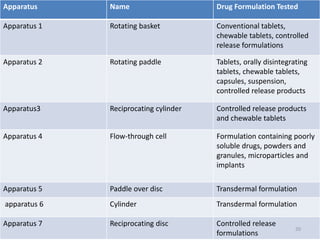
Apparatus Name Drug Formulation Tested
Apparatus 1 Rotating basket Conventional tablets,
chewable tablets, controlled
release formulations
Apparatus 2 Rotating paddle Tablets, orally disintegrating
tablets, chewable tablets,
capsules, suspension,
controlled release products
Apparatus3 Reciprocating cylinder Controlled release products
and chewable tablets
Apparatus 4 Flow-through cell Formulation containing poorly
soluble drugs, powders and
granules, microparticles and
implants
Apparatus 5 Paddle over disc Transdermal formulation
apparatus 6 Cylinder Transdermal formulation
Apparatus 7 Reciprocating disc Controlled release
formulations
20
Dissolution Acceptance Criteria
Based on Q value
Q is defined as the percentage of drug content
dissolved at a given period of time.
Value specified in the USP monograph of a
given drug product.
21
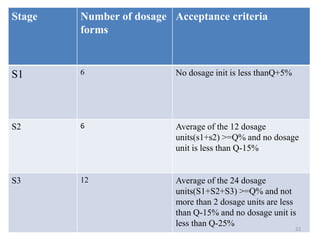
Stage Number of dosage
forms
Acceptance criteria
S1 6 No dosage init is less thanQ+5%
S2 6 Average of the 12 dosage
units(s1+s2) >=Q% and no dosage
unit is less than Q-15%
S3 12 Average of the 24 dosage
units(S1+S2+S3) >=Q% and not
more than 2 dosage units are less
than Q-15% and no dosage unit is
less than Q-25%
22
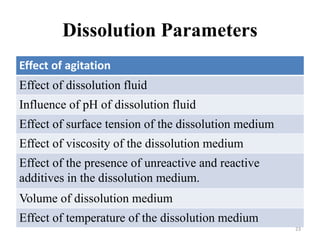
Dissolution Parameters
Effect of agitation
Effect of dissolution fluid
Influence of pH of dissolution fluid
Effect of surface tension of the dissolution medium
Effect of viscosity of the dissolution medium
Effect of the presence of unreactive and reactive
additives in the dissolution medium.
Volume of dissolution medium
Effect of temperature of the dissolution medium
23
Effect of agitation
Dissolution test using high speed agitation may
lack discriminative value and can yield
misleading results.
For the basket method, 100 rpm usually is
utilized, while for the paddle procedure, a 50 –
75 rpm is recommended.
24
Effect of dissolution fluid
Selection of proper medium for dissolution
testing depends largely on the physicochemical
properties of the drug.
25
Influence of pH of dissolution fluid
Changes in pH exerts the greatest effect in terms
of solubility
For weak acids, the dissolution rate increases with
increasing pH , whereas for weak bases, the
dissolution rate increases with decreasing pH
However , for tablets whose API is independent of
pH, the dissolution rate does not significantly
varies with change in pH unless they contain
certain excipients that are influenced by pH.
26
Volume of dissolution medium
The proper volume of the dissolution medium
depends mainly on the solubility of the drug in
the selected fluid.
If the drug is poorly soluble in water, a
relatively large amount of fluid should be used
if complete dissolution is to be expected.
27
Deaeration of the dissolution
medium
Presence of dissolved air or other gases in the
dissolution medium may influence the
dissolution rate of certain formulations and
lead to variable and unreliable results.
Example, the dissolved air in distilled water
could significantly lower its pH and
consequently affect the dissolution rate of
drugs that are sensitive to pH changes.
28
Effect of temperature of the
dissolution medium
Drug solubility is temperature dependent,
therefore careful temperature control during
the dissolution process is extremely important.
 Generally a temperature of 37°±0.5 is
maintained during dissolution determination of
oral dosage forms and suppositories.
For topical preparations as low as 30° and
25°have been used.
29
Dissolution profile
Definition:
It is graphical representation [in terms of
concentration vs. time] of complete release of
drug from a dosage form in an appropriate
selected dissolution medium.
i.e. in short it is the measure of the
release of A.P.I from a dosage form with
respect to time.
30
Objectives
To develop in-vitro-in-vivo correlation which
can help to reduce cost, speed up product
development and reduced the need of
performing the costly human volunteer studies.
Establishing the similarity of pharmaceutical
dosage forms, for which composition,
manufacture site, scale of manufacture,
manufacturing process and/or equipment may
have been changed within defined limits.
31
Importance of Dissolution profile
Dissolution profile of an API reflects its release
pattern under the selected condition sets.
For optimizing the dosage formula by
comparing the dissolution profile of various
formulas of the same API
Dissolution profile comparision between pre
change and post change products under
SUPAC related changes , helps to assure the
similarity in the product performance and green
signal to bioequivalence.
32
Contdd..
By knowing the dissolution profile of
particular product of the BRAND LEADER,
we can make appropriate necessary change in
our formulation to achieve the same profile of
the brand leader.
33
Methods to Compare Dissolution
Profile
34
Graphical method
 Here, we plot graph of Time V/S concentration of
solute (drug) in the dissolution medium or biological
fluid
 The shape of two curves is compared for comparison of
dissolution pattern and the concentration of drug at
each point is compared for extent of dissolution.
 If two or more curves are overlapping then the
dissolution profile is comparable.
 If difference is small then it is acceptable but higher
differences indicate that the dissolution profile is not
comparable.
35
Model dependent methods
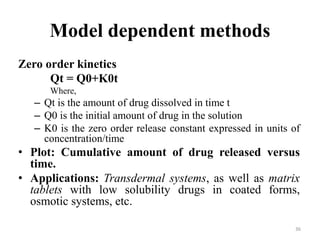
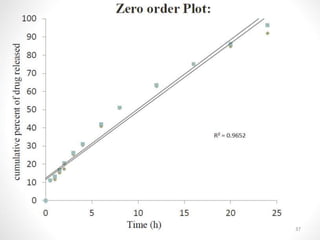
Zero order kinetics
Qt = Q0+K0t
Where,
– Qt is the amount of drug dissolved in time t
– Q0 is the initial amount of drug in the solution
– K0 is the zero order release constant expressed in units of
concentration/time
• Plot: Cumulative amount of drug released versus
time.
• Applications: Transdermal systems, as well as matrix
tablets with low solubility drugs in coated forms,
osmotic systems, etc.
36
37
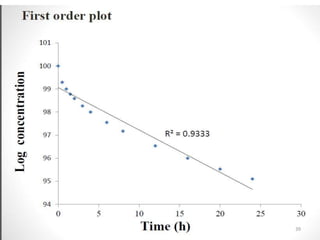
First order model
log C = log C0 - Kt / 2.303
Where,
C0 is the initial concentration of drug,
K is the first order rate constant, and
t is the time.
 Plot: log concentration of drug remaining vs. time which
would yield a straight line with a slope of -K/2.303.
 Application: This relationship can be used to describe the
drug dissolution in pharmaceutical dosage forms such as
those containing water soluble drugs in porous matrices.
38
39
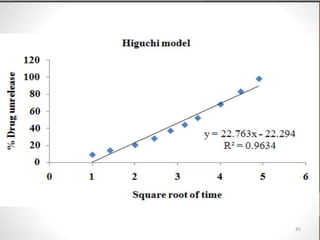
Higuchi model (Diffusion matrix
formulation)
This is given by Higuchi.
𝑄 = 𝐾 𝑇
Where Q is the amount of drug released in time‘t’ per
unit area,
K is Higuchi constant
T is time in hr.
 Plot: The data obtained is to be plotted as cumulative
percentage drug release versus Square root of time.
 Application: modified release pharmaceutical dosage
forms, transdermal systems and matrix tablets with
water soluble drugs.
40
41
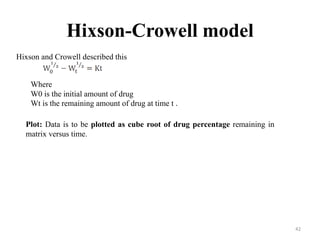
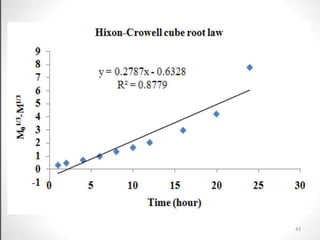
Hixson-Crowell model
Hixson and Crowell described this
Where
W0 is the initial amount of drug
Wt is the remaining amount of drug at time t .
Plot: Data is to be plotted as cube root of drug percentage remaining in
matrix versus time.
42
43
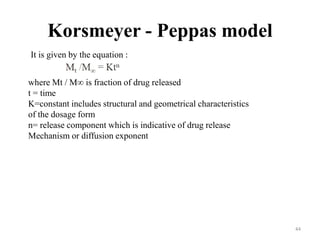
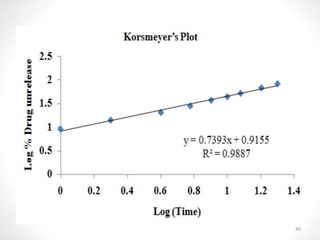
Korsmeyer - Peppas model
It is given by the equation :
where Mt / M∞ is fraction of drug released
t = time
K=constant includes structural and geometrical characteristics
of the dosage form
n= release component which is indicative of drug release
Mechanism or diffusion exponent
44
45
Model Independent Approach
Moore and Flanner proposed a model independent mathematical
approach to compare the dissolution profile using two factors, f1 and f2.
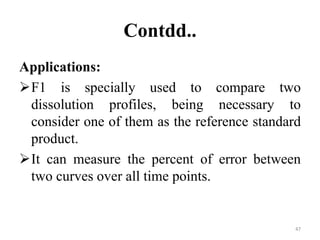
1. Difference Factor
The difference factor (f1 ) calculates the percent (%) difference
between the two curves at each time point
Is a measurement of the relative error between the two curves:
where n is the number of time points,
R is the dissolution
value of the reference (pre change) batch at time t,
T is the dissolution value of the test (post change) batch at time t.
46
Contdd..
Applications:
F1 is specially used to compare two
dissolution profiles, being necessary to
consider one of them as the reference standard
product.
It can measure the percent of error between
two curves over all time points.
47
Contdd..
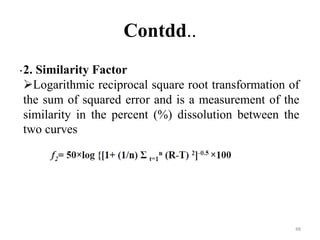
.2. Similarity Factor
Logarithmic reciprocal square root transformation of
the sum of squared error and is a measurement of the
similarity in the percent (%) dissolution between the
two curves
48
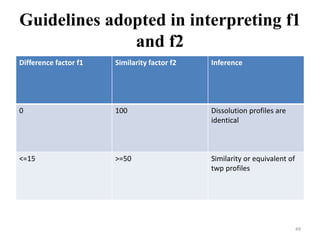
Guidelines adopted in interpreting f1
and f2
Difference factor f1 Similarity factor f2 Inference
0 100 Dissolution profiles are
identical
<=15 >=50 Similarity or equivalent of
twp profiles
49
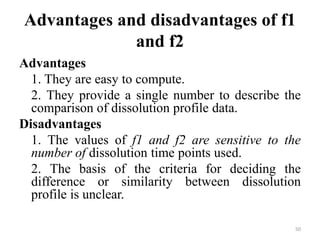
Advantages and disadvantages of f1
and f2
Advantages
1. They are easy to compute.
2. They provide a single number to describe the
comparison of dissolution profile data.
Disadvantages
1. The values of f1 and f2 are sensitive to the
number of dissolution time points used.
2. The basis of the criteria for deciding the
difference or similarity between dissolution
profile is unclear.
50
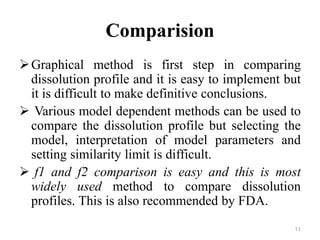
Comparision
Graphical method is first step in comparing
dissolution profile and it is easy to implement but
it is difficult to make definitive conclusions.
 Various model dependent methods can be used to
compare the dissolution profile but selecting the
model, interpretation of model parameters and
setting similarity limit is difficult.
 f1 and f2 comparison is easy and this is most
widely used method to compare dissolution
profiles. This is also recommended by FDA.
51
Pharmacokinetic parameters
Pharmacokinetics is defined as the kinetics of
drug absorption, distribution, metabolism, and
excretion and their relationship with
pharmacologic, therapeutic or toxicologic
response in mans and animals.
52
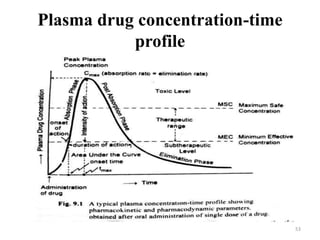
Plasma drug concentration-time
profile
53
Pharmacokinetic Parameters
Peak plasma concentration (Cmax)
 Time of peak concentration (tmax)
Area under the curve (AUC)
54
Peak plasma concentration (Cmax)
The point of maximum concentration of a drug
in plasma is called as peak and the
concentration of drug at peak is known as peak
plasma concentration.
It is also called as peak height concentration
and maximum drug concentration.
 Cmax is expressed in mcg/ml.
55
Time of peak concentration (tmax)
The time for drug to reach peak concentration
in plasma ( after extravascular administration)
is called the time of peak concentration.
 It is expressed in hours.
 Onset time and onset of action is dependent
upon tmax.
 The parameter is of particular importance in
assessing the efficacy of drugs used to treat
acute conditions like pain and insomnia.
56
Area under the curve (AUC)
Represents the total integrated area under the
plasma level-time profile and expresses the
total amount of drug that comes into the
systemic circulation after its administration.
 AUC is expressed in mcg/ml X HRS.
 It is important for the dugs that are
administered repetitively for the treatment of
chronic conditions like asthma or epilepsy.
57
Heckel Equation
To study the effect of applied pressure on density
Statement: It states that powder compression
follows 1st order kinetics i.e interparticular pores
as reactant and densitification of powder beds as
product.
Ln 1/(1-D)= kP +A
D=Relative density
P=pressure
A=Die filling and particle rearrangement before
deformation
K=Measure of plasticity(larger k= harder the tablet)
58
Contdd..
How density and porosity are inter related?
D=1( Maximum in case of no pores left when
compressed)
D=0.3 or 0.1 =Means that 30% or 10% of
volume of tablet consists of pores ( porosity)
Porosity( E) =1—D...................(A)
Substituting in Heckel Equation,
Ln(1/E) =kP +A (Straight line obtained –implies
that pores decreases when pressure applied)
59
Application of Heckel Equation
Information of k helps in selection of binder in
tablet formation
Larger value of k, Harder is the tablet
Crushing strength of tablet can be correlated
with the value of k.
60
Types of materials on the basis of
Heckel plot
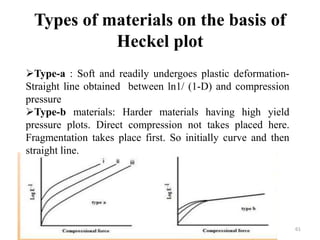
Type-a : Soft and readily undergoes plastic deformation-
Straight line obtained between ln1/ (1-D) and compression
pressure
Type-b materials: Harder materials having high yield
pressure plots. Direct compression not takes placed here.
Fragmentation takes place first. So initially curve and then
straight line.
61
Conclusion
By studying various parameters of
consolidation, we can establish bioequivalance
of two products and also we can optimise a
formulation. Also, SUPAC changes and other
post approval changes of the product can be
done by knowing the parameters.
62
References
 Brahmankar D. M.; Jaiswal S.Biopharmaceutics and
Pharmacokinetics- A Treatise, Vallabh Prakashan,
New delhi, India. (2009) pp 325-347.
 Hussain L, Ashwini D, Sirish D. Kineti modelling
and dissolution profiles comparison: an overview. Int
J Pharm Bio Sci. 2013; 4(1): 728 - 737.
 Thomas O’H, Adrian D, Jackie B and John D. A
review of methods used to compare dissolution
profile data. PSTT. 1998; 1(5): 214-223.
 Encyclopedia of Pharmaceutical Technology, Vol-I third
edition, Edited by James Swarbrick pp 907-909.
63
Internet Links
http://www.fda.gov/downloads/Drugs/GuidanceC
omplianceRegulatoryInformation/Guidances/ucm
070237.pdf
http://pharmaquest.weebly.com/uploads/9/9/4/2/9
942916/comparison_of_dissolution_profile.pdf
https://www.slideshare.net/mobile/jignesh00123/s
eminaqr-on-dissolution-profile-comparision
https://www.slideshare.net/,obile/zephrinafernand
es/similarity-and-difference-factors-of-disolution
(Accessed on 8th Nov, 2019, 10:00 pm)
64
THANK YOU
65