Skip to main content
Download free for 30 days
Sign in
Upload
Language (EN)
Support
Business
Mobile
Social Media
Marketing
Technology
Art & Photos
Career
Design
Education
Presentations & Public Speaking
Government & Nonprofit
Healthcare
Internet
Law
Leadership & Management
Automotive
Engineering
Software
Recruiting & HR
Retail
Sales
Services
Science
Small Business & Entrepreneurship
Food
Environment
Economy & Finance
Data & Analytics
Investor Relations
Sports
Spiritual
News & Politics
Travel
Self Improvement
Real Estate
Entertainment & Humor
Health & Medicine
Devices & Hardware
Lifestyle
Uploaded by
bistask77
PPTX, PDF
8 views
Population Distributuin of Nepal by the record of census.pptx
Population Distribution of Nepal.
Data & Analytics
◦
Read more
More Related Content
DOC
Aan eararm nepal- 2009
by
NDRC Nepal
24 slides
1.1K views
PPTX
Demograhic environment of nepal
by
Tribhuvan University
20 slides
305 views
PDF
Demograhic environment of nepal
by
Tribhuvan University
20 slides
179 views
DOC
My Project Work
by
rkoirala
10 slides
16.7K views
DOC
Proposal
by
rkoirala
10 slides
3.1K views
PDF
35. imran khan
by
Journal of Global Resources
5 slides
65 views
PDF
A comparison of Land Cover Change in Kaski District, Nepal
by
Bijesh Mishra
1 slide
198 views
PDF
Preliminary leaflet 2011
by
19811228
1 slide
429 views
Aan eararm nepal- 2009
by
NDRC Nepal
24 slides
1.1K views
Demograhic environment of nepal
by
Tribhuvan University
20 slides
305 views
Demograhic environment of nepal
by
Tribhuvan University
20 slides
179 views
My Project Work
by
rkoirala
10 slides
16.7K views
Proposal
by
rkoirala
10 slides
3.1K views
35. imran khan
by
Journal of Global Resources
5 slides
65 views
A comparison of Land Cover Change in Kaski District, Nepal
by
Bijesh Mishra
1 slide
198 views
Preliminary leaflet 2011
by
19811228
1 slide
429 views
More from bistask77
PDF
Fostering Personal Responsibility in Teaching and Learning for Student Success
by
bistask77
8 slides
1 view
PDF
Comprehensive Guide to Digital Resource Management and Sharing in Modern Libr...
by
bistask77
10 slides
1 view
PDF
Understanding Public-Private Partnerships (PPP) in Infrastructure Development
by
bistask77
11 slides
2 views
PDF
Comprehensive Overview of Enrollment and Education Challenges in Nepal
by
bistask77
14 slides
0 views
PPTX
Comprehensive Overview of Management Functions and Principles by Gulick, Urwi...
by
bistask77
3 slides
3 views
PPTX
Essential Qualities of a Good Teacher: Personal, Social, and Professional Traits
by
bistask77
4 slides
3 views
PDF
Essential Qualities of a Good Teacher: Personal, Social, and Professional Traits
by
bistask77
4 slides
13 views
PDF
Analysis of Fertility Rate Variations by Education and Ethnicity in Nepal (20...
by
bistask77
4 slides
2 views
PPTX
Population growth rete by Region according to different census.pptx
by
bistask77
1 slide
6 views
Fostering Personal Responsibility in Teaching and Learning for Student Success
by
bistask77
8 slides
1 view
Comprehensive Guide to Digital Resource Management and Sharing in Modern Libr...
by
bistask77
10 slides
1 view
Understanding Public-Private Partnerships (PPP) in Infrastructure Development
by
bistask77
11 slides
2 views
Comprehensive Overview of Enrollment and Education Challenges in Nepal
by
bistask77
14 slides
0 views
Comprehensive Overview of Management Functions and Principles by Gulick, Urwi...
by
bistask77
3 slides
3 views
Essential Qualities of a Good Teacher: Personal, Social, and Professional Traits
by
bistask77
4 slides
3 views
Essential Qualities of a Good Teacher: Personal, Social, and Professional Traits
by
bistask77
4 slides
13 views
Analysis of Fertility Rate Variations by Education and Ethnicity in Nepal (20...
by
bistask77
4 slides
2 views
Population growth rete by Region according to different census.pptx
by
bistask77
1 slide
6 views
Recently uploaded
PDF
RCI Project catalogue: Every Pawn has the Potential to become a Queen.
by
ROMAN CAMP INITIATIVE
28 slides
21 views
PPTX
Structuring Powerful Messages The Knowledge Itinerary & SCQ Framework- Two Fr...
by
P&CO
15 slides
28 views
PPTX
Enterprise Agentic AI Reference Architecture 2026.pptx
by
Nobusuke Hanagasaki
2 slides
37 views
PPTX
AirIndex: Real-time Airfare Price Intelligence Platform for India
by
kiru41104
6 slides
68 views
PDF
BY-LAW NUMBER 8600-AMENDMENT Anti-Dilutive Protection of Our Resident Shareho...
by
Simon Jacques
7 slides
22 views
PDF
Generative AI Tools for Cybersecurity_PART 2.pdf
by
DanielMalok1
39 slides
7 views
PDF
Chapter 2 NATURAL^J MAN-MODIFIED^J AND MAN-MADE ENVIRONMENTS.pdf
by
dagolyca180
35 slides
15 views
PPTX
ai based id decttionn & screening documents
by
sujeetfz1425
6 slides
38 views
PDF
sih-ps1-presentation.pdfnnmnmnknkkkkkkkkkkkkkkkkkkkkkkkk
by
anjalib9955
6 slides
244 views
PDF
2026 2026 2026 2026 2026 2026 2026 2026.pdf
by
iamsosickofthisfakel
12 slides
7 views
RCI Project catalogue: Every Pawn has the Potential to become a Queen.
by
ROMAN CAMP INITIATIVE
28 slides
21 views
Structuring Powerful Messages The Knowledge Itinerary & SCQ Framework- Two Fr...
by
P&CO
15 slides
28 views
Enterprise Agentic AI Reference Architecture 2026.pptx
by
Nobusuke Hanagasaki
2 slides
37 views
AirIndex: Real-time Airfare Price Intelligence Platform for India
by
kiru41104
6 slides
68 views
BY-LAW NUMBER 8600-AMENDMENT Anti-Dilutive Protection of Our Resident Shareho...
by
Simon Jacques
7 slides
22 views
Generative AI Tools for Cybersecurity_PART 2.pdf
by
DanielMalok1
39 slides
7 views
Chapter 2 NATURAL^J MAN-MODIFIED^J AND MAN-MADE ENVIRONMENTS.pdf
by
dagolyca180
35 slides
15 views
ai based id decttionn & screening documents
by
sujeetfz1425
6 slides
38 views
sih-ps1-presentation.pdfnnmnmnknkkkkkkkkkkkkkkkkkkkkkkkk
by
anjalib9955
6 slides
244 views
2026 2026 2026 2026 2026 2026 2026 2026.pdf
by
iamsosickofthisfakel
12 slides
7 views
Population Distributuin of Nepal by the record of census.pptx
1.
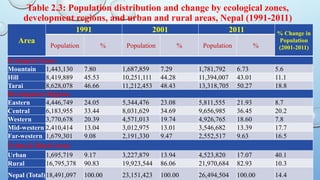
Table 2.3: Population
distribution and change by ecological zones, development regions, and urban and rural areas, Nepal (1991-2011) Area 1991 2001 2011 % Change in Population (2001-2011) Population % Population % Population % Ecological Zones Mountain 1,443,130 7.80 1,687,859 7.29 1,781,792 6.73 5.6 Hill 8,419,889 45.53 10,251,111 44.28 11,394,007 43.01 11.1 Tarai 8,628,078 46.66 11,212,453 48.43 13,318,705 50.27 18.8 Development Regions Eastern 4,446,749 24.05 5,344,476 23.08 5,811,555 21.93 8.7 Central 6,183,955 33.44 8,031,629 34.69 9,656,985 36.45 20.2 Western 3,770,678 20.39 4,571,013 19.74 4,926,765 18.60 7.8 Mid-western 2,410,414 13.04 3,012,975 13.01 3,546,682 13.39 17.7 Far-western 1,679,301 9.08 2,191,330 9.47 2,552,517 9.63 16.5 Urban & Rural Areas Urban 1,695,719 9.17 3,227,879 13.94 4,523,820 17.07 40.1 Rural 16,795,378 90.83 19,923,544 86.06 21,970,684 82.93 10.3 Nepal (Total)18,491,097 100.00 23,151,423 100.00 26,494,504 100.00 14.4