CONTENT
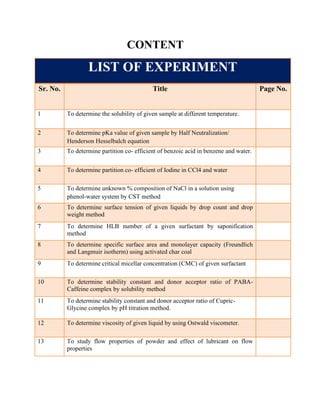
LIST OF EXPERIMENT
Sr. No. Title Page No.
1 To determine the solubility of given sample at different temperature.
2 To determine pKa value of given sample by Half Neutralization/
Henderson Hesselbalch equation
3 To determine partition co- efficient of benzoic acid in benzene and water.
4 To determine partition co- efficient of Iodine in CCl4 and water
5 To determine unknown % composition of NaCl in a solution using
phenol-water system by CST method
6 To determine surface tension of given liquids by drop count and drop
weight method
7 To determine HLB number of a given surfactant by saponification
method
8 To determine specific surface area and monolayer capacity (Freundlich
and Langmuir isotherm) using activated char coal
9 To determine critical micellar concentration (CMC) of given surfactant
10 To determine stability constant and donor acceptor ratio of PABA-
Caffeine complex by solubility method
11 To determine stability constant and donor acceptor ratio of Cupric-
Glycine complex by pH titration method.
12 To determine viscosity of given liquid by using Ostwald viscometer.
13 To study flow properties of powder and effect of lubricant on flow
properties
Experiment No. 01
Aim: To determine the solubility of given sample at different temperature.
Requirements: Salts (KCI, NaCl), Distilled water, thermometer, Porcelain dishes or watch glasses,
Beaker, Pipette (10 ml), Hot plate
Theory: Solubility is defined in quantitative terms as the concentration of solute in a saturated
solution at a certain temperature. Qualitatively it is defined as a spontaneous interaction of two or
more substances to form a homogeneous molecular dispersion.
Quantitatively, solubility is expressed in molality, molarity, and percentage (w/v or w/w). A
saturated solution is defined as the one in which the solute is in equilibrium with the solid phase
(solute) at a certain temperature. A solution may sometimes contain more amount of solute than
in saturated one; such a solution is known as "Super saturated solution".
The solubility of the solid depends on temperature, melting point of the solid and molar heat of
fusion.
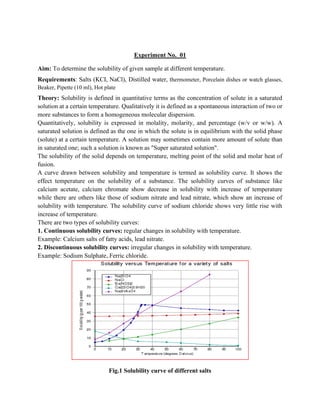
A curve drawn between solubility and temperature is termed as solubility curve. It shows the
effect temperature on the solubility of a substance. The solubility curves of substance like
calcium acetate, calcium chromate show decrease in solubility with increase of temperature
while there are others like those of sodium nitrate and lead nitrate, which show an increase of
solubility with temperature. The solubility curve of sodium chloride shows very little rise with
increase of temperature.
There are two types of solubility curves:
1. Continuous solubility curves: regular changes in solubility with temperature.
Example: Calcium salts of fatty acids, lead nitrate.
2. Discontinuous solubility curves: irregular changes in solubility with temperature.
Example: Sodium Sulphate, Ferric chloride.
Fig.1 Solubility curve of different salts
In this study the effect of temperature on NaCl solubility will be carried out.
Procedure:
1. Clean all glassware’s using detergent solution.
2. Wash two to three times using purified water
3. Take 50 ml of distilled water in a beaker (100 ml).
4. Add some amount of salt like potassium chloride or sodium chloride in distilled water
and stir using glass rod or by an electric motor driven shaker.
5. Increase the temperature to 85°C with continuous stirring.
6. Maintain this temperature for few minutes and then cool down the solution.
7. Take sample at 80°C using a pipette with a piece of filter paper, tie at the tip of the
pipette.
8. Remove the piece of filter paper from the tip of pipette and transfer 10 ml of this solution
in weighed porcelain dish or watch glass.
9. Allow the temperature to fall down slowly to 70°, 60°, 40°, 30°C and then to room
temperature.
10. At each temperature take sample of the solution and repeat the step 7 and step 8.
11. Evaporate the solution of each porcelain dish or watch glass using direct heat or on the
water bath or put in the oven.
12. Dry the solution till constant weight.
13. Take weight of the dish using balance.
14. Record all the parameter in the form of table or in proper way so that it was easy to
understand the concept of solubility,
Observation
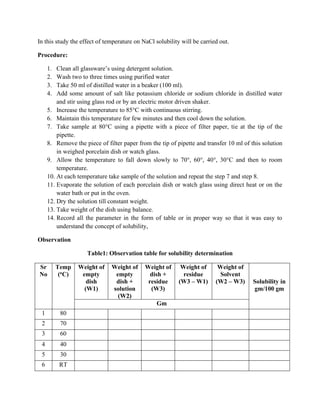
Table1: Observation table for solubility determination
Sr
No
Temp
(oC)
Weight of
empty
dish
(W1)
Weight of
empty
dish +
solution
(W2)
Weight of
dish +
residue
(W3)
Weight of
residue
(W3 – W1)
Weight of
Solvent
(W2 – W3) Solubility in
gm/100 gm
Gm
1 80
2 70
3 60
4 40
5 30
6 RT
Calculation:
Solubility of NaCl in solvent (DW) at different temperature (°C) is calculated by the following
formula in g/100g
Solubility of NaCl at (…oC) = (W3 – W1 / W2 –W3) * 100
Result:
i. Solubility of NaCl at different temperature was determined.
Table 2: solubility of salt
Sr No Temp
(oC)
Solubility in gm/100 gm
1 80
2 70
3 60
4 40
5 30
6 RT
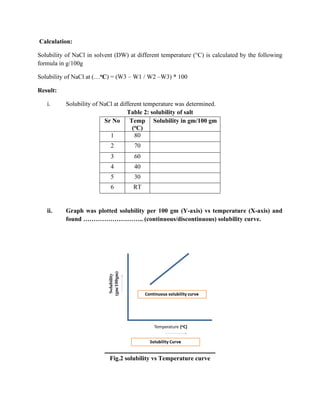
ii. Graph was plotted solubility per 100 gm (Y-axis) vs temperature (X-axis) and
found ……………………….. (continuous/discontinuous) solubility curve.
Fig.2 solubility vs Temperature curve
Experiment No. 02
Aim: To determine pKa value of the given sample (acetic acid) by Henderson Hesselbalch
equation (pH meter).
Requirement: beaker, volumetric flask, glass rod, pH meter, acetic acid, distilled water.
Theory: pH of the solution is the negative logarithm to the base 10 of H+
ion concentration in
solution. Therefore, pH = -log [H+] = -log CH. The solution of pH 7 is called neutral solution. A
solution of pH between 0 and 7 is considered acidic and that between 7 to 14 is considered to be
alkaline solution. pH of a solution can be determined by using Hydrogen ion indicator. For
example, Methyl red shows its full alkaline colour, yellow, at pH of about 6 and its full acid
colour, red; at about pH 4.
Determination of pH using pH meter is quite easy and accurate when compared to other method.
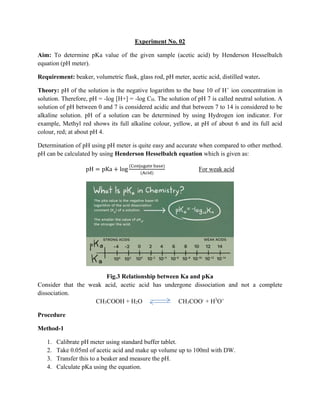
pH can be calculated by using Henderson Hesselbalch equation which is given as:
pH = pKa + log
(Conjugate base)
(Acid)
For weak acid
Fig.3 Relationship between Ka and pKa
Consider that the weak acid, acetic acid has undergone dissociation and not a complete
dissociation.
CH3COOH + H2O CH3COO-
+ H3
O+
Procedure
Method-1
1. Calibrate pH meter using standard buffer tablet.
2. Take 0.05ml of acetic acid and make up volume up to 100ml with DW.
3. Transfer this to a beaker and measure the pH.
4. Calculate pKa using the equation.
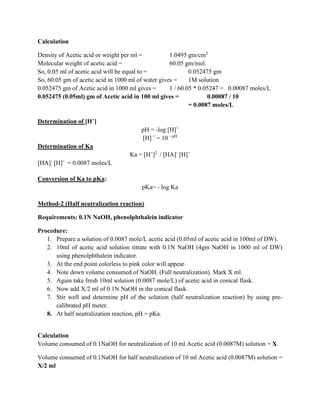
Calculation
Density of Acetic acid or weight per ml = 1.0495 gm/cm3
Molecular weight of acetic acid = 60.05 gm/mol.
So, 0.05 ml of acetic acid will be equal to = 0.052475 gm
So, 60.05 gm of acetic acid in 1000 ml of water gives = 1M solution
0.052475 gm of Acetic acid in 1000 ml gives = 1 / 60.05 * 0.05247 = 0.00087 moles/L
0.052475 (0.05ml) gm of Acetic acid in 100 ml gives = 0.00087 / 10
= 0.0087 moles/L
Determination of [H+]
pH = -log [H]+
[H] +
= 10 - pH
Determination of Ka
Ka = [H+
]2
/ [HA]-
[H]+
[HA]-
[H]+
= 0.0087 moles/L
Conversion of Ka to pKa:
pKa= - log Ka
Method-2 (Half neutralization reaction)
Requirements: 0.1N NaOH, phenolphthalein indicator
Procedure:
1. Prepare a solution of 0.0087 mole/L acetic acid (0.05ml of acetic acid in 100ml of DW).
2. 10ml of acetic acid solution titrate with 0.1N NaOH (4gm NaOH in 1000 ml of DW)
using phenolphthalein indicator.
3. At the end point colorless to pink color will appear.
4. Note down volume consumed of NaOH. (Full neutralization). Mark X ml.
5. Again take fresh 10ml solution (0.0087 mole/L) of acetic acid in conical flask.
6. Now add X/2 ml of 0.1N NaOH in the conical flask.
7. Stir well and determine pH of the solution (half neutralization reaction) by using pre-
calibrated pH meter.
8. At half neutralization reaction, pH = pKa.
Calculation
Volume consumed of 0.1NaOH for neutralization of 10 ml Acetic acid (0.0087M) solution = X
Volume consumed of 0.1NaOH for half neutralization of 10 ml Acetic acid (0.0087M) solution =
X/2 ml
After addition of 3ml of 0.1N NaOH in the 10 ml Acetic acid (0.0087M) solution pH was = ….
At half neutralization reaction:
pH = pKa
So pKa = ……
Result: pKa was found to be …………… by half neutralization reaction.
Experiment No. 03
Aim - To determine the partition coefficient of Benzoic Acid between benzene (C6H6) and
distilled water (DW)
Requirements: Benzene, Distilled water, 0.01N NaOH, Separating funnel, conical flask,
Burette, Pipette, Reagent bottles
Theory: Distribution law states that a solute distributes itself between two non-miscible solvents
in contact with each other in such a way that at constant temperature the ratio of its concentration
in the two layers is constant irrespective of its total amount.
If excess of a liquid or solid is added to a mixture of two immiscible liquids, it will distribute
itself between the two phases so that each becomes saturated. If the added substance is in
sufficient to saturate the liquids, it will be distributed between the two layers in a definite
proportion at equilibrium and at constant temperature.
K= Concentration of solute in Organic Phase / Concentration of Solute in Aqueous Phase
= C1 / C2 = Corg/CAq
The equilibrium constant K, is known as Distribution Coefficient or Partition Coefficient.
This is known as Nernst's law or Distribution law.
Benzoic Acid, when distributed between benzene and water, exists mainly as associated
molecule in benzene layer and as an individual molecule i.e. unassociated molecule in aq. Layer
hence the equation is given as:
𝐾 =
n√Concentration of solute in organic phase
Concentration of solute in aqueous phase
=
n√Corg
Caq
n= no of molecule associated with benzene
In this study partition co-efficient will be determined for Benzoic Acid between Benzene and
water.
Preparation of Solutions
a. Preparation of 0.01N Sodium Hydroxide- Dissolve 0.4gm of sodium hydroxide in DW
and dilute of 1000 ml. in volumetric flask.
Procedure
1) Weigh 3 samples (250, 500, 750mg) of benzoic acid in to 3 reagent bottles.
2) Add 50ml of benzene and 50ml of DW in all three bottles.
3) Mark bottles A, B, C, respectively.
4) Place the stopper on each bottle and shake it for 30 min. or shake using wrist action
shaker and rotatory shaker.
5) Variability of the result depends on the shaking hence more and effective shaking is
essential for reproducible results.
6) Now take this mixture in separating funnel and keep aside for about to 30 min.
7) Separate Benzene and aqueous layer in two conical flasks.
8) Intermediate liquid cannot be collected as it contains little of both liquids.
9) Put the label on both conical flasks with the samples taken originally.
10) Pipette out 10 ml of the aqueous layer and transfer in another conical flask and titrate
with 0.01N NaOH Solution.
11) Record the titration value and repeat again for remaining bottle.
12) Similarly, titrate the aqueous layer from other containers.
13) Pipette out 10 ml of benzene layer in a dry and clean conical flask and titrate with 0.01N
NaOH Solution.
14) Similarly, titrate other Benzene solution as previous step.
15) Take all readings carefully
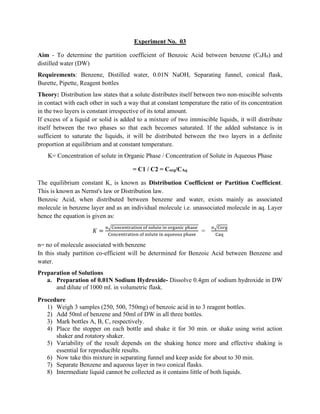
16) Calculate concentration of iodine in both phases i.e. aqueous and organic phase.
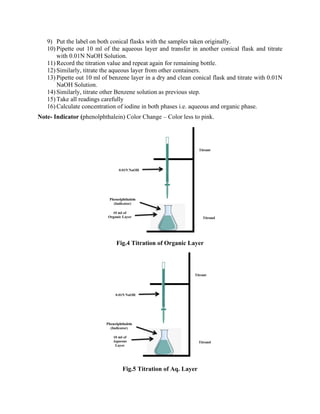
Note- Indicator (phenolphthalein) Color Change – Color less to pink.
Fig.4 Titration of Organic Layer
Fig.5 Titration of Aq. Layer
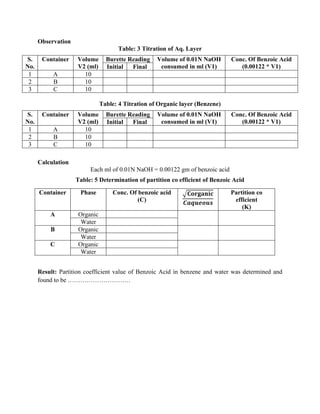
Observation
Table: 3 Titration of Aq. Layer
S.
No.
Container Volume
V2 (ml)
Burette Reading Volume of 0.01N NaOH
consumed in ml (V1)
Conc. Of Benzoic Acid
(0.00122 * V1)
Initial Final
1 A 10
2 B 10
3 C 10
Table: 4 Titration of Organic layer (Benzene)
S.
No.
Container Volume
V2 (ml)
Burette Reading Volume of 0.01N NaOH
consumed in ml (V1)
Conc. Of Benzoic Acid
(0.00122 * V1)
Initial Final
1 A 10
2 B 10
3 C 10
Calculation
Each ml of 0.01N NaOH = 0.00122 gm of benzoic acid
Table: 5 Determination of partition co efficient of Benzoic Acid
Container Phase Conc. Of benzoic acid
(C)
√𝐂𝐨𝐫𝐠𝐚𝐧𝐢𝐜
𝑪𝒂𝒒𝒖𝒆𝒐𝒖𝒔
Partition co
efficient
(K)
A Organic
Water
B Organic
Water
C Organic
Water
Result: Partition coefficient value of Benzoic Acid in benzene and water was determined and
found to be …………………………
Experiment No. 04
Aim - To determine the partition coefficient of iodine between carbon tetrachloride (CCl4) and
distilled water (DW)
Requirements: Carbon tetrachloride, Iodine, Distilled water, sodium thio sulphate, KI
Separating funnel, conical flask, Burette, Pipette, Reagent bottles
Theory
Distribution law states that a solute distributes itself between two non-miscible solvents in
contact with each other in such a way that at constant temperature the ratio of its concentration in
the two layers is constant irrespective of its total amount.
If excess of a liquid or solid is added to a mixture of two immiscible liquids, it will distribute
itself between the two phases so that each becomes saturated. If the added substance is in
sufficient to saturate the liquids, it will be distributed between the two layers in a definite
proportion at equilibrium and at constant temperature.
K= Concentration of solute in Organic Phase / Concentration of Solute in Aqueous Phase
= C1 / C2 = Corg/CAq
The equilibrium constant K, is known as Distribution Coefficient or Partition Coefficient.
This is known as Nernst's law or Distribution law.
In this study partition co-efficient will be determined for Iodine between Carbon tetrachloride
and water.
Preparation of Solutions
b. Preparation of 0.1N Sodium Thiosulphate- Dissolve 26gm of sodium thiosulphate
penta hydrate and 0.2 gm of Sodium Carbonate in DW and dilute of 1000 ml. in
volumetric flask.
c. Preparation of 0.005N Sodium thiosulphate- Dissolve 1.3 gm of sodium thiosulphate
penta hydrate and 0.01 gm of Sodium Carbonate in DW and dilute of 1000 ml. in
volumetric flask.
d. Preparation of 10% KI Solution: add 10gm of KI in 100 ml of DW.
e. Preparation of Starch Indicator: dissolve 300mg of Starch in 100ml of distilled water
and heat for proper solubility.
Procedure
1. Prepare a saturated solution of iodine in carbon tetrachloride (stock solution).
2. Take three reagent bottles and clean these bottles by reagent and rinse with it distilled
water.
3. Prepare composition of the solution as given in the table no 6
4. Transfer these solutions in clean and dry reagent bottles and be it as A, B, and C
respectively.
5. Place the stopper on each bottle and shake it for 30 min. or shake using wrist action
shaker and rotatory shaker.
6. Variability of the result depends on the shaking hence more and effective shaking is
essential for reproducible results.
7. Now take this mixture in separating funnel and keep aside for about to 30 min.
8. Separate carbon tetrachloride and aqueous layer in two conical flasks:
9. Intermediate liquid cannot be collected as it contains little of both liquids.
10. Put the label on both conical flasks with the samples taken originally.
11. Pipette out 10 ml of the aqueous layer and transfer in another conical flask and add 10 ml
of 10% KI solution.
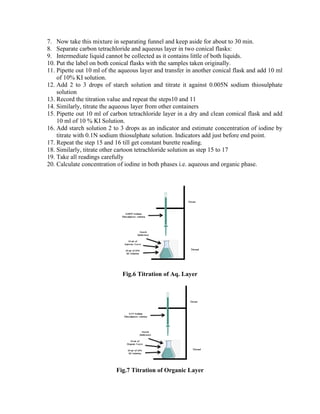
12. Add 2 to 3 drops of starch solution and titrate it against 0.005N sodium thiosulphate
solution
13. Record the titration value and repeat the steps10 and 11
14. Similarly, titrate the aqueous layer from other containers
15. Pipette out 10 ml of carbon tetrachloride layer in a dry and clean comical flask and add
10 ml of 10 % KI Solution.
16. Add starch solution 2 to 3 drops as an indicator and estimate concentration of iodine by
titrate with 0.1N sodium thiosulphate solution. Indicators add just before end point.
17. Repeat the step 15 and 16 till get constant burette reading.
18. Similarly, titrate other cartoon tetrachloride solution as step 15 to 17
19. Take all readings carefully
20. Calculate concentration of iodine in both phases i.e. aqueous and organic phase.
Fig.6 Titration of Aq. Layer
Fig.7 Titration of Organic Layer
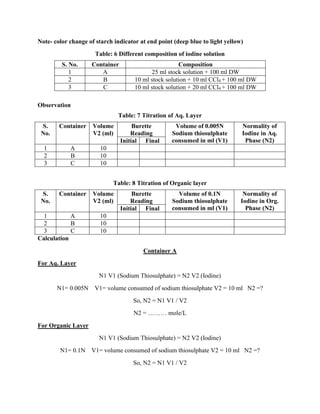
Note- color change of starch indicator at end point (deep blue to light yellow)
Table: 6 Different composition of iodine solution
S. No. Container Composition
1 A 25 ml stock solution + 100 ml DW
2 B 10 ml stock solution + 10 ml CCl4 + 100 ml DW
3 C 10 ml stock solution + 20 ml CCl4 + 100 ml DW
Observation
Table: 7 Titration of Aq. Layer
S.
No.
Container Volume
V2 (ml)
Burette
Reading
Volume of 0.005N
Sodium thiosulphate
consumed in ml (V1)
Normality of
Iodine in Aq.
Phase (N2)
Initial Final
1 A 10
2 B 10
3 C 10
Table: 8 Titration of Organic layer
S.
No.
Container Volume
V2 (ml)
Burette
Reading
Volume of 0.1N
Sodium thiosulphate
consumed in ml (V1)
Normality of
Iodine in Org.
Phase (N2)
Initial Final
1 A 10
2 B 10
3 C 10
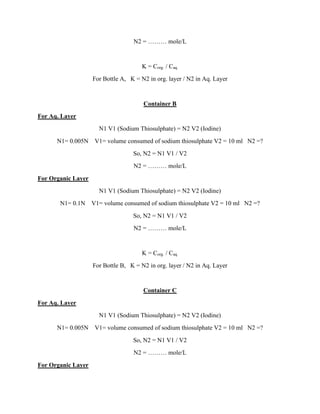
Calculation
Container A
For Aq. Layer
N1 V1 (Sodium Thiosulphate) = N2 V2 (Iodine)
N1= 0.005N V1= volume consumed of sodium thiosulphate V2 = 10 ml N2 =?
So, N2 = N1 V1 / V2
N2 = ……… mole/L
For Organic Layer
N1 V1 (Sodium Thiosulphate) = N2 V2 (Iodine)
N1= 0.1N V1= volume consumed of sodium thiosulphate V2 = 10 ml N2 =?
So, N2 = N1 V1 / V2
N2 = ……… mole/L
K = Corg. / Caq.
For Bottle A, K = N2 in org. layer / N2 in Aq. Layer
Container B
For Aq. Layer
N1 V1 (Sodium Thiosulphate) = N2 V2 (Iodine)
N1= 0.005N V1= volume consumed of sodium thiosulphate V2 = 10 ml N2 =?
So, N2 = N1 V1 / V2
N2 = ……… mole/L
For Organic Layer
N1 V1 (Sodium Thiosulphate) = N2 V2 (Iodine)
N1= 0.1N V1= volume consumed of sodium thiosulphate V2 = 10 ml N2 =?
So, N2 = N1 V1 / V2
N2 = ……… mole/L
K = Corg. / Caq.
For Bottle B, K = N2 in org. layer / N2 in Aq. Layer
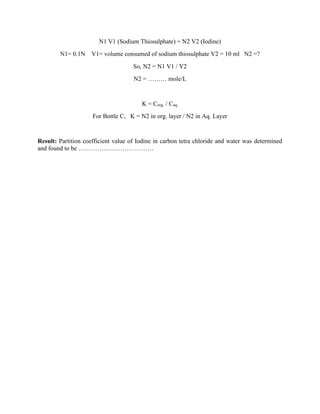
Container C
For Aq. Layer
N1 V1 (Sodium Thiosulphate) = N2 V2 (Iodine)
N1= 0.005N V1= volume consumed of sodium thiosulphate V2 = 10 ml N2 =?
So, N2 = N1 V1 / V2
N2 = ……… mole/L
For Organic Layer
N1 V1 (Sodium Thiosulphate) = N2 V2 (Iodine)
N1= 0.1N V1= volume consumed of sodium thiosulphate V2 = 10 ml N2 =?
So, N2 = N1 V1 / V2
N2 = ……… mole/L
K = Corg. / Caq.
For Bottle C, K = N2 in org. layer / N2 in Aq. Layer
Result: Partition coefficient value of Iodine in carbon tetra chloride and water was determined
and found to be ………………………………
Experiment No. 05
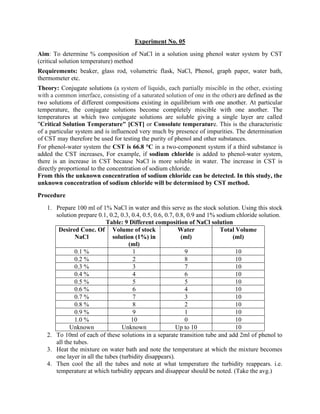
Aim: To determine % composition of NaCl in a solution using phenol water system by CST
(critical solution temperature) method
Requirements: beaker, glass rod, volumetric flask, NaCl, Phenol, graph paper, water bath,
thermometer etc.
Theory: Conjugate solutions (a system of liquids, each partially miscible in the other, existing
with a common interface, consisting of a saturated solution of one in the other) are defined as the
two solutions of different compositions existing in equilibrium with one another. At particular
temperature, the conjugate solutions become completely miscible with one another. The
temperatures at which two conjugate solutions are soluble giving a single layer are called
"Critical Solution Temperature" [CST] or Consolute temperature. This is the characteristic
of a particular system and is influenced very much by presence of impurities. The determination
of CST may therefore be used for testing the purity of phenol and other substances.
For phenol-water system the CST is 66.8 °C in a two-component system if a third substance is
added the CST increases, For example, if sodium chloride is added to phenol-water system,
there is an increase in CST because NaCl is more soluble in water. The increase in CST is
directly proportional to the concentration of sodium chloride.
From this the unknown concentration of sodium chloride can be detected. In this study, the
unknown concentration of sodium chloride will be determined by CST method.
Procedure
1. Prepare 100 ml of 1% NaCl in water and this serve as the stock solution. Using this stock
solution prepare 0.1, 0.2, 0.3, 0.4, 0.5, 0.6, 0.7, 0.8, 0.9 and 1% sodium chloride solution.
Table: 9 Different composition of NaCl solution
Desired Conc. Of
NaCl
Volume of stock
solution (1%) in
(ml)
Water
(ml)
Total Volume
(ml)
0.1 % 1 9 10
0.2 % 2 8 10
0.3 % 3 7 10
0.4 % 4 6 10
0.5 % 5 5 10
0.6 % 6 4 10
0.7 % 7 3 10
0.8 % 8 2 10
0.9 % 9 1 10
1.0 % 10 0 10
Unknown Unknown Up to 10 10
2. To 10ml of each of these solutions in a separate transition tube and add 2ml of phenol to
all the tubes.
3. Heat the mixture on water bath and note the temperature at which the mixture becomes
one layer in all the tubes (turbidity disappears).
4. Then cool the all the tubes and note at what temperature the turbidity reappears. i.e.
temperature at which turbidity appears and disappear should be noted. (Take the avg.)
5. Similarly, take 10ml of the given unknown sample. Add 2ml of phenol. Find out the CST
by the above method.
6. Graph: plot a graph by taking percentage on X axis and CST on Y axis. A straight line
will result.
7. Using the graph read the composition of unknown.
Observation
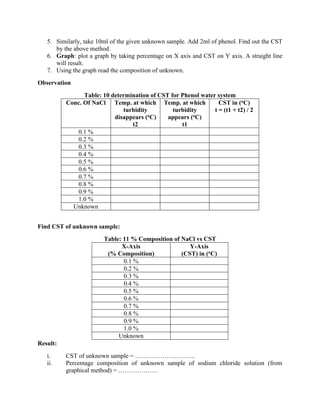
Table: 10 determination of CST for Phenol water system
Conc. Of NaCl Temp. at which
turbidity
disappears (oC)
t2
Temp. at which
turbidity
appears (oC)
t1
CST in (oC)
t = (t1 + t2) / 2
0.1 %
0.2 %
0.3 %
0.4 %
0.5 %
0.6 %
0.7 %
0.8 %
0.9 %
1.0 %
Unknown
Find CST of unknown sample:
Table: 11 % Composition of NaCl vs CST
X-Axis
(% Composition)
Y-Axis
(CST) in (oC)
0.1 %
0.2 %
0.3 %
0.4 %
0.5 %
0.6 %
0.7 %
0.8 %
0.9 %
1.0 %
Unknown
Result:
i. CST of unknown sample = ………………………..
ii. Percentage composition of unknown sample of sodium chloride solution (from
graphical method) = ……………….
Experiment No. 06
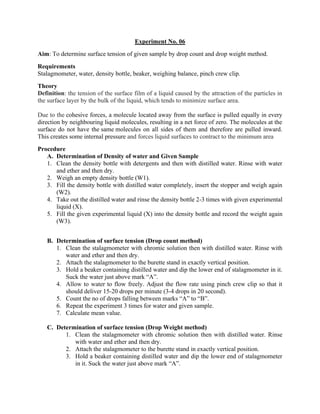
Aim: To determine surface tension of given sample by drop count and drop weight method.
Requirements
Stalagmometer, water, density bottle, beaker, weighing balance, pinch crew clip.
Theory
Definition: the tension of the surface film of a liquid caused by the attraction of the particles in
the surface layer by the bulk of the liquid, which tends to minimize surface area.
Due to the cohesive forces, a molecule located away from the surface is pulled equally in every
direction by neighbouring liquid molecules, resulting in a net force of zero. The molecules at the
surface do not have the same molecules on all sides of them and therefore are pulled inward.
This creates some internal pressure and forces liquid surfaces to contract to the minimum area
Procedure
A. Determination of Density of water and Given Sample
1. Clean the density bottle with detergents and then with distilled water. Rinse with water
and ether and then dry.
2. Weigh an empty density bottle (W1).
3. Fill the density bottle with distilled water completely, insert the stopper and weigh again
(W2).
4. Take out the distilled water and rinse the density bottle 2-3 times with given experimental
liquid (X).
5. Fill the given experimental liquid (X) into the density bottle and record the weight again
(W3).
B. Determination of surface tension (Drop count method)
1. Clean the stalagmometer with chromic solution then with distilled water. Rinse with
water and ether and then dry.
2. Attach the stalagmometer to the burette stand in exactly vertical position.
3. Hold a beaker containing distilled water and dip the lower end of stalagmometer in it.
Suck the water just above mark “A”.
4. Allow to water to flow freely. Adjust the flow rate using pinch crew clip so that it
should deliver 15-20 drops per minute (3-4 drops in 20 second).
5. Count the no of drops falling between marks “A” to “B”.
6. Repeat the experiment 3 times for water and given sample.
7. Calculate mean value.
C. Determination of surface tension (Drop Weight method)
1. Clean the stalagmometer with chromic solution then with distilled water. Rinse
with water and ether and then dry.
2. Attach the stalagmometer to the burette stand in exactly vertical position.
3. Hold a beaker containing distilled water and dip the lower end of stalagmometer
in it. Suck the water just above mark “A”.
4. Allow to water to flow freely. Adjust the flow rate using pinch crew clip so that it
should deliver 15-20 drops per minute (3-4 drops in 20 second).
5. Weight the 20 drops of water. (by using weighing balance)
6. Weight the 20 drops of given sample. (by using weighing balance)
7. Repeat the experiment 3 times for water and given sample.
8. Calculate mean value.
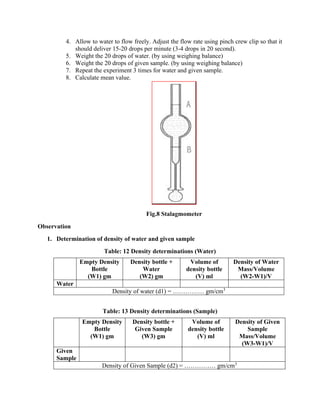
Fig.8 Stalagmometer
Observation
1. Determination of density of water and given sample
Table: 12 Density determinations (Water)
Empty Density
Bottle
(W1) gm
Density bottle +
Water
(W2) gm
Volume of
density bottle
(V) ml
Density of Water
Mass/Volume
(W2-W1)/V
Water
Density of water (d1) = …………… gm/cm3
Table: 13 Density determinations (Sample)
Empty Density
Bottle
(W1) gm
Density bottle +
Given Sample
(W3) gm
Volume of
density bottle
(V) ml
Density of Given
Sample
Mass/Volume
(W3-W1)/V
Given
Sample
Density of Given Sample (d2) = …………… gm/cm3
2. Determination of surface tension of given sample (drop count method)
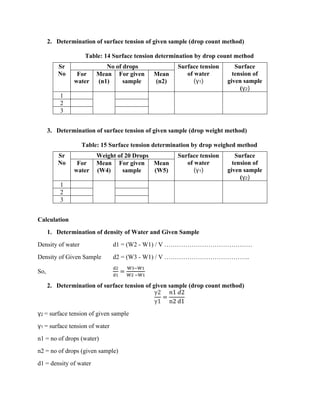
Table: 14 Surface tension determination by drop count method
Sr
No
No of drops Surface tension
of water
(γ1)
Surface
tension of
given sample
(γ2)
For
water
Mean
(n1)
For given
sample
Mean
(n2)
1
2
3
3. Determination of surface tension of given sample (drop weight method)
Table: 15 Surface tension determination by drop weighed method
Sr
No
Weight of 20 Drops Surface tension
of water
(γ1)
Surface
tension of
given sample
(γ2)
For
water
Mean
(W4)
For given
sample
Mean
(W5)
1
2
3
Calculation
1. Determination of density of Water and Given Sample
Density of water d1 = (W2 - W1) / V ……………………………………
Density of Given Sample d2 = (W3 - W1) / V …………………………………..
So,
d2
d1
=
W3−W1
W2 −W1
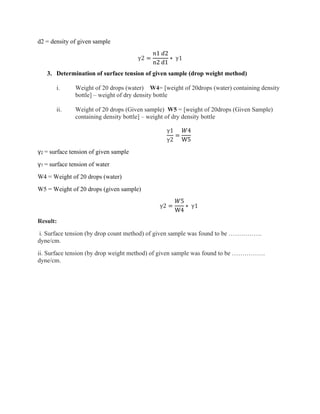
2. Determination of surface tension of given sample (drop count method)
γ2
γ1
=
𝑛1 𝑑2
n2 d1
γ2 = surface tension of given sample
γ1 = surface tension of water
n1 = no of drops (water)
n2 = no of drops (given sample)
d1 = density of water
d2 = density of given sample
γ2 =
𝑛1 𝑑2
n2 d1
∗ γ1
3. Determination of surface tension of given sample (drop weight method)
i. Weight of 20 drops (water) W4= [weight of 20drops (water) containing density
bottle] – weight of dry density bottle
ii. Weight of 20 drops (Given sample) W5 = [weight of 20drops (Given Sample)
containing density bottle] – weight of dry density bottle
γ1
γ2
=
𝑊4
W5
γ2 = surface tension of given sample
γ1 = surface tension of water
W4 = Weight of 20 drops (water)
W5 = Weight of 20 drops (given sample)
γ2 =
𝑊5
W4
∗ γ1
Result:
i. Surface tension (by drop count method) of given sample was found to be …………….
dyne/cm.
ii. Surface tension (by drop weight method) of given sample was found to be …………….
dyne/cm.
Experiment No. 07
Aim: To determine HLB no of given surfactant (glyceryl monosterate) by saponification method.
Requirements: NaOH, KOH, HCl, surfactant sample, beaker, glass rod, reflux assembly,
conical flask, burette stand, weighing balance
Theory:
The HLB number scale, introduced by Griffin in 1949 was the first-ever successful attempt of a
quantitative characterization of the Polyoxyethylene non-ionic surfactants. It has often been
found that the classification of surfactants by HLB number is not helpful in enabling researchers
to predict the optimum emulsification.
HLB is short for hydrophilic-lipophilic balance. The HLB System is one of the most successful
strategies for developing stable emulsions. Griffin has established an empirical scale as a
measure of the HLB values of surfactants. It is possible to determine the optimum range for each
of surface active substance effect. The HLB system was created as a tool to make it easier to use
non-ionic surfactants.
Saponification: Saponification is the hydrolysis of an ester with NaOH or KOH to give alcohol
and sodium or potassium salt of the acid. Soaps are sodium or potassium salts of long chain fatty
acids. When triglycerides in fat/oil react with aqueous NaOH or KOH, they are converted into
soap and glycerol. This is called alkaline hydrolysis of esters. Since this reaction leads to the
formation of soap, it is called the Saponification process.
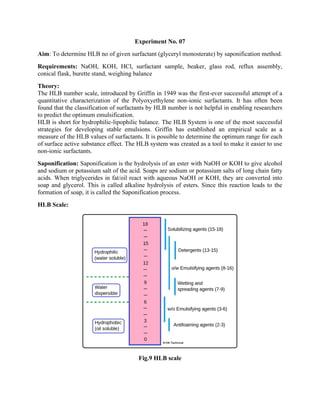
HLB Scale:
Fig.9 HLB scale
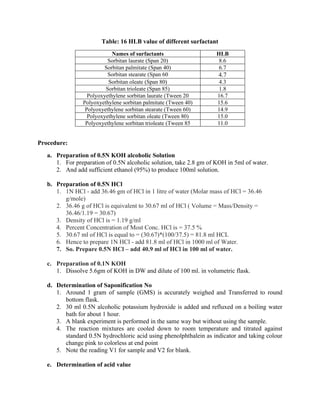
Table: 16 HLB value of different surfactant
Names of surfactants HLB
Sorbitan laurate (Span 20) 8.6
Sorbitan palmitate (Span 40) 6.7
Sorbitan stearate (Span 60 4.7
Sorbitan oleate (Span 80) 4.3
Sorbitan trioleate (Span 85) 1.8
Polyoxyethylene sorbitan laurate (Tween 20 16.7
Polyoxyethylene sorbitan palmitate (Tween 40) 15.6
Polyoxyethylene sorbitan stearate (Tween 60) 14.9
Polyoxyethylene sorbitan oleate (Tween 80) 15.0
Polyoxyethylene sorbitan trioleate (Tween 85 11.0
Procedure:
a. Preparation of 0.5N KOH alcoholic Solution
1. For preparation of 0.5N alcoholic solution, take 2.8 gm of KOH in 5ml of water.
2. And add sufficient ethanol (95%) to produce 100ml solution.
b. Preparation of 0.5N HCl
1. 1N HCl - add 36.46 gm of HCl in 1 litre of water (Molar mass of HCl = 36.46
g/mole)
2. 36.46 g of HCl is equivalent to 30.67 ml of HCl ( Volume = Mass/Density =
36.46/1.19 = 30.67)
3. Density of HCl is = 1.19 g/ml
4. Percent Concentration of Most Conc. HCl is = 37.5 %
5. 30.67 ml of HCl is equal to = (30.67)*(100/37.5) = 81.8 ml HCL
6. Hence to prepare 1N HCl - add 81.8 ml of HCl in 1000 ml of Water.
7. So. Prepare 0.5N HCl – add 40.9 ml of HCl in 100 ml of water.
c. Preparation of 0.1N KOH
1. Dissolve 5.6gm of KOH in DW and dilute of 100 ml. in volumetric flask.
d. Determination of Saponification No
1. Around 1 gram of sample (GMS) is accurately weighed and Transferred to round
bottom flask.
2. 30 ml 0.5N alcoholic potassium hydroxide is added and refluxed on a boiling water
bath for about 1 hour.
3. A blank experiment is performed in the same way but without using the sample.
4. The reaction mixtures are cooled down to room temperature and titrated against
standard 0.5N hydrochloric acid using phenolphthalein as indicator and taking colour
change pink to colorless at end point
5. Note the reading V1 for sample and V2 for blank.
e. Determination of acid value
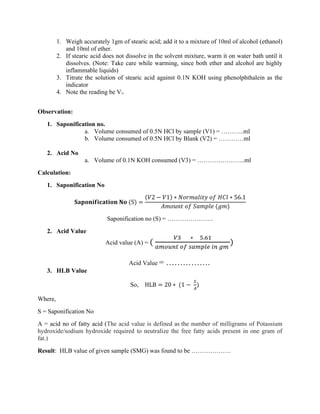
1. Weigh accurately 1gm of stearic acid; add it to a mixture of 10ml of alcohol (ethanol)
and 10ml of ether.
2. If stearic acid does not dissolve in the solvent mixture, warm it on water bath until it
dissolves. (Note: Take care while warming, since both ether and alcohol are highly
inflammable liquids)
3. Titrate the solution of stearic acid against 0.1N KOH using phenolphthalein as the
indicator
4. Note the reading be V3.
Observation:
1. Saponification no.
a. Volume consumed of 0.5N HCl by sample (V1) = ………..ml
b. Volume consumed of 0.5N HCl by Blank (V2) = …………ml
2. Acid No
a. Volume of 0.1N KOH consumed (V3) = …………………..ml
Calculation:
1. Saponification No
𝐒𝐚𝐩𝐨𝐧𝐢𝐟𝐢𝐜𝐚𝐭𝐢𝐨𝐧 𝐍𝐨 (S) =
(𝑉2 − 𝑉1) ∗ 𝑁𝑜𝑟𝑚𝑎𝑙𝑖𝑡𝑦 𝑜𝑓 𝐻𝐶𝑙 ∗ 56.1
𝐴𝑚𝑜𝑢𝑛𝑡 𝑜𝑓 𝑆𝑎𝑚𝑝𝑙𝑒 (𝑔𝑚)
Saponification no (S) = ………………….
2. Acid Value
Acid value (A) = (
𝑉3 ∗ 5.61
𝑎𝑚𝑜𝑢𝑛𝑡 𝑜𝑓 𝑠𝑎𝑚𝑝𝑙𝑒 𝑖𝑛 𝑔𝑚
)
Acid Value = …………….
3. HLB Value
So, HLB = 20 ∗ (1 −
𝑆
𝐴
)
Where,
S = Saponification No
A = acid no of fatty acid (The acid value is defined as the number of milligrams of Potassium
hydroxide/sodium hydroxide required to neutralize the free fatty acids present in one gram of
fat.)
Result: HLB value of given sample (SMG) was found to be ……………….
Experiment No. 08
Aim: To determination of Freundlich and Langmuir constants using activated char coal
(determination of monolayer capacity of activated charcoal and specific surface area of
charcoal).
Requirement: water, activated charcoal, 0.5N Acetic Acid. 0.2N NaOH, Phenolphthalein,
Reagent Bottle, Beakers, Burette, Pipette, Burette Stand, Conical Flask, Funnel
Theory:
• Adsorption is the adhesion of molecules (or ions and atoms) to the surface of a solid or
liquid. The molecules accumulate only at the surface and do not enter the bulk of the
adsorbing material.
• The substance whose molecules get adsorbed at the surface is called the adsorbate.
• The substance on whose surface the process takes place is called the adsorbent.
• It is a surface phenomenon
• Desorption is the reverse process in which the adsorbed substance is removed from the
surface of the adsorbent.
Applications of Adsorption
Following are the applications of adsorption:
• Gas masks: Poisonous gases get adsorbed at the surface of the mask and prevent its
encounter when used by coal miners.
• Production of vacuum: Traces of air are adsorbed on charcoal and removed from
devices undergoing the process of evacuation.
• Removal of moisture: Silica gel pellets are used for the adsorption of moisture in
medicines and new plastic bottles in order to control humidity.
• Removal of colour: The juice extracted from cane is treated with animal charcoal for the
removal of the coloring agent in order to get a clear liquid solution
Procedure:
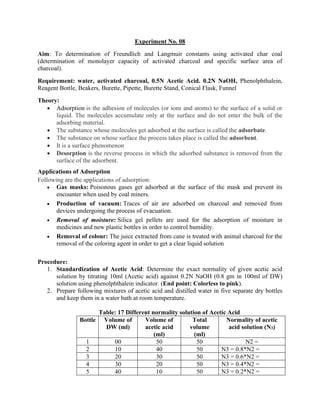
1. Standardization of Acetic Acid: Determine the exact normality of given acetic acid
solution by titrating 10ml (Acetic acid) against 0.2N NaOH (0.8 gm in 100ml of DW)
solution using phenolphthalein indicator. (End point: Colorless to pink).
2. Prepare following mixtures of acetic acid and distilled water in five separate dry bottles
and keep them in a water bath at room temperature.
Table: 17 Different normality solution of Acetic Acid
Bottle Volume of
DW (ml)
Volume of
acetic acid
(ml)
Total
volume
(ml)
Normality of acetic
acid solution (N3)
1 00 50 50 N2 =
2 10 40 50 N3 = 0.8*N2 =
3 20 30 50 N3 = 0.6*N2 =
4 30 20 50 N3 = 0.4*N2 =
5 40 10 50 N3 = 0.2*N2 =
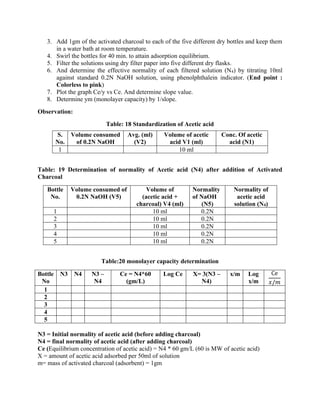
3. Add 1gm of the activated charcoal to each of the five different dry bottles and keep them
in a water bath at room temperature.
4. Swirl the bottles for 40 min. to attain adsorption equilibrium.
5. Filter the solutions using dry filter paper into five different dry flasks.
6. And determine the effective normality of each filtered solution (N4) by titrating 10ml
against standard 0.2N NaOH solution, using phenolphthalein indicator. (End point :
Colorless to pink)
7. Plot the graph Ce/y vs Ce. And determine slope value.
8. Determine ym (monolayer capacity) by 1/slope.
Observation:
Table: 18 Standardization of Acetic acid
S.
No.
Volume consumed
of 0.2N NaOH
Avg. (ml)
(V2)
Volume of acetic
acid V1 (ml)
Conc. Of acetic
acid (N1)
1 10 ml
Table: 19 Determination of normality of Acetic acid (N4) after addition of Activated
Charcoal
Bottle
No.
Volume consumed of
0.2N NaOH (V5)
Volume of
(acetic acid +
charcoal) V4 (ml)
Normality
of NaOH
(N5)
Normality of
acetic acid
solution (N4)
1 10 ml 0.2N
2 10 ml 0.2N
3 10 ml 0.2N
4 10 ml 0.2N
5 10 ml 0.2N
Table:20 monolayer capacity determination
Bottle
No
N3 N4 N3 –
N4
Ce = N4*60
(gm/L)
Log Ce X= 3(N3 –
N4)
x/m Log
x/m
Ce
𝑥/𝑚
1
2
3
4
5
N3 = Initial normality of acetic acid (before adding charcoal)
N4 = final normality of acetic acid (after adding charcoal)
Ce (Equilibrium concentration of acetic acid) = N4 * 60 gm/L (60 is MW of acetic acid)
X = amount of acetic acid adsorbed per 50ml of solution
m= mass of activated charcoal (adsorbent) = 1gm
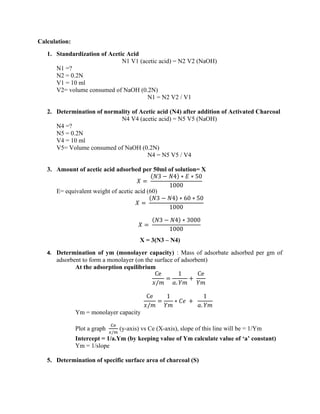
Calculation:
1. Standardization of Acetic Acid
N1 V1 (acetic acid) = N2 V2 (NaOH)
N1 =?
N2 = 0.2N
V1 = 10 ml
V2= volume consumed of NaOH (0.2N)
N1 = N2 V2 / V1
2. Determination of normality of Acetic acid (N4) after addition of Activated Charcoal
N4 V4 (acetic acid) = N5 V5 (NaOH)
N4 =?
N5 = 0.2N
V4 = 10 ml
V5= Volume consumed of NaOH (0.2N)
N4 = N5 V5 / V4
3. Amount of acetic acid adsorbed per 50ml of solution= X
𝑋 =
(𝑁3 − 𝑁4) ∗ 𝐸 ∗ 50
1000
E= equivalent weight of acetic acid (60)
𝑋 =
(𝑁3 − 𝑁4) ∗ 60 ∗ 50
1000
𝑋 =
(𝑁3 − 𝑁4) ∗ 3000
1000
X = 3(N3 – N4)
4. Determination of ym (monolayer capacity) : Mass of adsorbate adsorbed per gm of
adsorbent to form a monolayer (on the surface of adsorbent)
At the adsorption equilibrium
Ce
𝑥/𝑚
=
1
𝑎. 𝑌𝑚
+
Ce
𝑌𝑚
Ce
𝑥/𝑚
=
1
𝑌𝑚
∗ 𝐶𝑒 +
1
𝑎. 𝑌𝑚
Ym = monolayer capacity
Plot a graph
Ce
𝑥/𝑚
(y-axis) vs Ce (X-axis), slope of this line will be = 1/Ym
Intercept = 1/a.Ym (by keeping value of Ym calculate value of ‘a’ constant)
Ym = 1/slope
5. Determination of specific surface area of charcoal (S)
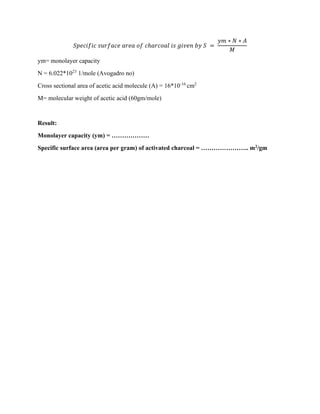
𝑆𝑝𝑒𝑐𝑖𝑓𝑖𝑐 𝑠𝑢𝑟𝑓𝑎𝑐𝑒 𝑎𝑟𝑒𝑎 𝑜𝑓 𝑐ℎ𝑎𝑟𝑐𝑜𝑎𝑙 𝑖𝑠 𝑔𝑖𝑣𝑒𝑛 𝑏𝑦 𝑆 =
𝑦𝑚 ∗ 𝑁 ∗ 𝐴
𝑀
ym= monolayer capacity
N = 6.022*1023
1/mole (Avogadro no)
Cross sectional area of acetic acid molecule (A) = 16*10-16
cm2
M= molecular weight of acetic acid (60gm/mole)
Result:
Monolayer capacity (ym) = ………………
Specific surface area (area per gram) of activated charcoal = ………………….. m2/gm
Experiment No. 09
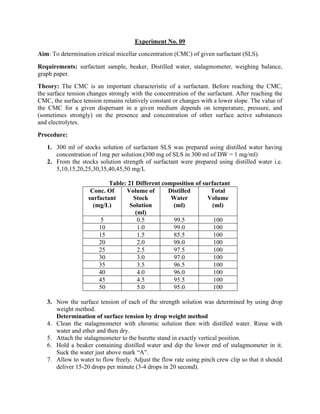
Aim: To determination critical micellar concentration (CMC) of given surfactant (SLS).
Requirements: surfactant sample, beaker, Distilled water, stalagmometer, weighing balance,
graph paper.
Theory: The CMC is an important characteristic of a surfactant. Before reaching the CMC,
the surface tension changes strongly with the concentration of the surfactant. After reaching the
CMC, the surface tension remains relatively constant or changes with a lower slope. The value of
the CMC for a given dispersant in a given medium depends on temperature, pressure, and
(sometimes strongly) on the presence and concentration of other surface active substances
and electrolytes.
Procedure:
1. 300 ml of stocks solution of surfactant SLS was prepared using distilled water having
concentration of 1mg per solution.(300 mg of SLS in 300 ml of DW = 1 mg/ml)
2. From the stocks solution strength of surfactant were prepared using distilled water i.e.
5,10,15,20,25,30,35,40,45,50 mg/L
Table: 21 Different composition of surfactant
Conc. Of
surfactant
(mg/L)
Volume of
Stock
Solution
(ml)
Distilled
Water
(ml)
Total
Volume
(ml)
5 0.5 99.5 100
10 1.0 99.0 100
15 1.5 85.5 100
20 2.0 98.0 100
25 2.5 97.5 100
30 3.0 97.0 100
35 3.5 96.5 100
40 4.0 96.0 100
45 4.5 95.5 100
50 5.0 95.0 100
3. Now the surface tension of each of the strength solution was determined by using drop
weight method.
Determination of surface tension by drop weight method
4. Clean the stalagmometer with chromic solution then with distilled water. Rinse with
water and ether and then dry.
5. Attach the stalagmometer to the burette stand in exactly vertical position.
6. Hold a beaker containing distilled water and dip the lower end of stalagmometer in it.
Suck the water just above mark “A”.
7. Allow to water to flow freely. Adjust the flow rate using pinch crew clip so that it should
deliver 15-20 drops per minute (3-4 drops in 20 second).
8. Weight the 20 drops of water (W2). (by using weighing balance)
9. Weight the 20 drops of surfactant solutions. (by using weighing balance)
10. Repeat the experiment 3 times for water and surfactant solution.
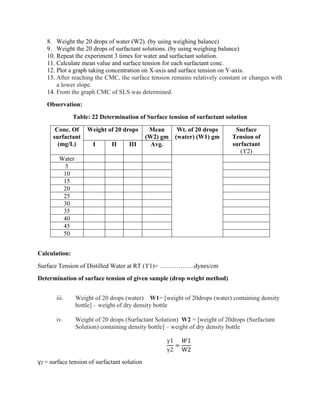
11. Calculate mean value and surface tension for each surfactant conc.
12. Plot a graph taking concentration on X-axis and surface tension on Y-axis.
13. After reaching the CMC, the surface tension remains relatively constant or changes with
a lower slope.
14. From the graph CMC of SLS was determined.
Observation:
Table: 22 Determination of Surface tension of surfactant solution
Conc. Of
surfactant
(mg/L)
Weight of 20 drops Mean
(W2) gm
Wt. of 20 drops
(water) (W1) gm
Surface
Tension of
surfactant
(ϒ2)
I II III Avg.
Water
5
10
15
20
25
30
35
40
45
50
Calculation:
Surface Tension of Distilled Water at RT (ϒ1)= ……………..dynes/cm
Determination of surface tension of given sample (drop weight method)
iii. Weight of 20 drops (water) W1= [weight of 20drops (water) containing density
bottle] – weight of dry density bottle
iv. Weight of 20 drops (Surfactant Solution) W2 = [weight of 20drops (Surfactant
Solution) containing density bottle] – weight of dry density bottle
γ1
γ2
=
𝑊1
W2
γ2 = surface tension of surfactant solution
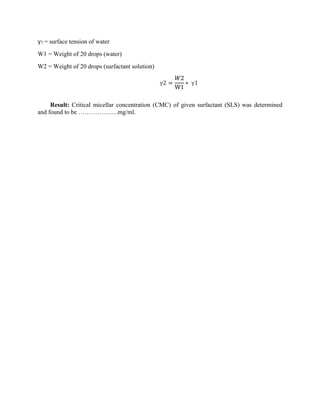
γ1 = surface tension of water
W1 = Weight of 20 drops (water)
W2 = Weight of 20 drops (surfactant solution)
γ2 =
𝑊2
W1
∗ γ1
Result: Critical micellar concentration (CMC) of given surfactant (SLS) was determined
and found to be ……………….mg/ml.
Experiment No. 10
Aim: To determine stability constant and donor acceptor ratio of PABA-Caffeine complex by
solubility method.
Requirements: Volumetric flask, beaker, conical flask , pipette, burette, burette stand with
clamp, funnel weight box, p-amino benzoic acid (PABA), sodium hydroxide, caffeine,
phenolphthalein indicator, Whatman filter paper.
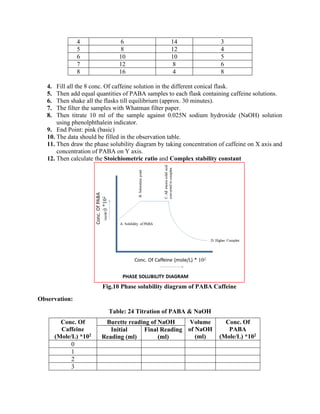
Theory: Among Complexes, organic molecular complexes have innumerable applications in
pharmacy.
i. Physical State: conversion of liquid drug in to solid form (e.g. nitroglycerin is liquid
and explosive after conversion in to solid form, which is explosive proof)
ii. Volatility: complex process reduce volatility (e.g. iodine is volatile in nature but
iodine with PVP less volatile in nature)
iii. Alter chemical stability.
iv. Improved dissolution phenobarbitone is enhanced when form complex with 13
Cyclodextrins.
Complexes possess some properties, which are different from those of its components. Properties
such as solubility, light absorption, conductance, partitioning behavior and chemical reactivity
are studied to confirm the formation of complexes. For example, p Amino Benzoic Acid (PABA)
and caffeine form complexes in solution.
This results in enhanced solubility of PABA at low concentrations of caffeine. Further increase
in concentration of caffeine results in decreased solubility of PABA. Therefore, the change in the
solubility profile is taken as a criterion to decide the complexation behavior. The equation for the
formation of complex is:
PABA+ Caffeine ---------------→PABA-caffeine
The interaction may be due to dipole-dipole force or hydrogen bonding between the polar
carbonyl groups of caffeine and hydrogen atom of the acid. The secondary interaction may
probably occur between the nonpolar parts of the molecules.
Procedure:
1. Prepare stock solutions of caffeine (0.1M): Weigh 1.949 gm of anhydrous caffeine and
transfer into 100 ml of volumetric flask and add distilled water to make up final volume.
2. And sodium hydroxide solution (0.025N): Dissolve 1gm of NaOH in 1000ml of
distilled water.
3. Prepare different concentrations of caffeine as per the Table below.
Table: 23 Different concentration of caffeine
Sr
No
Vol. of caffeine Stock
Solution (ml)
Distilled
Water (ml)
Conc. Of Caffeine
(Mole/L)
1 0 20 0
2 2 18 1
3 4 16 2
4 6 14 3
5 8 12 4
6 10 10 5
7 12 8 6
8 16 4 8
4. Fill all the 8 conc. Of caffeine solution in the different conical flask.
5. Then add equal quantities of PABA samples to each flask containing caffeine solutions.
6. Then shake all the flasks till equilibrium (approx. 30 minutes).
7. The filter the samples with Whatman filter paper.
8. Then titrate 10 ml of the sample against 0.025N sodium hydroxide (NaOH) solution
using phenolphthalein indicator.
9. End Point: pink (basic)
10. The data should be filled in the observation table.
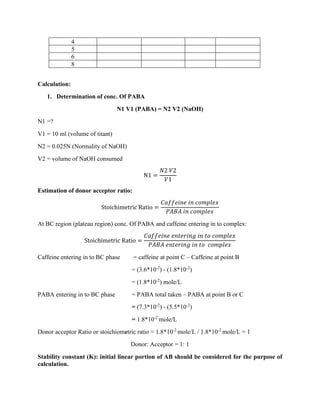
11. Then draw the phase solubility diagram by taking concentration of caffeine on X axis and
concentration of PABA on Y axis.
12. Then calculate the Stoichiometric ratio and Complex stability constant
Fig.10 Phase solubility diagram of PABA Caffeine
Observation:
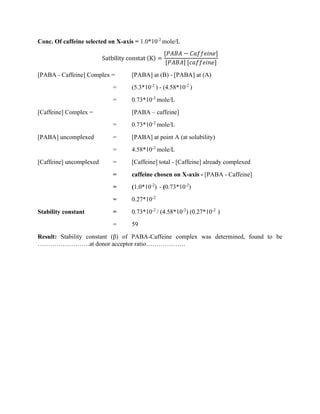
Table: 24 Titration of PABA & NaOH
Conc. Of
Caffeine
(Mole/L) *102
Burette reading of NaOH Volume
of NaOH
(ml)
Conc. Of
PABA
(Mole/L) *102
Initial
Reading (ml)
Final Reading
(ml)
0
1
2
3
4
5
6
8
Calculation:
1. Determination of conc. Of PABA
N1 V1 (PABA) = N2 V2 (NaOH)
N1 =?
V1 = 10 ml (volume of titant)
N2 = 0.025N (Normality of NaOH)
V2 = volume of NaOH consumed
N1 =
𝑁2 𝑉2
𝑉1
Estimation of donor acceptor ratio:
Stoichimetric Ratio =
𝐶𝑎𝑓𝑓𝑒𝑖𝑛𝑒 𝑖𝑛 𝑐𝑜𝑚𝑝𝑙𝑒𝑥
𝑃𝐴𝐵𝐴 𝑖𝑛 𝑐𝑜𝑚𝑝𝑙𝑒𝑥
At BC region (plateau region) conc. Of PABA and caffeine entering in to complex:
Stoichimetric Ratio =
𝐶𝑎𝑓𝑓𝑒𝑖𝑛𝑒 𝑒𝑛𝑡𝑒𝑟𝑖𝑛𝑔 𝑖𝑛 𝑡𝑜 𝑐𝑜𝑚𝑝𝑙𝑒𝑥
𝑃𝐴𝐵𝐴 𝑒𝑛𝑡𝑒𝑟𝑖𝑛𝑔 𝑖𝑛 𝑡𝑜 𝑐𝑜𝑚𝑝𝑙𝑒𝑥
Caffeine entering in to BC phase = caffeine at point C – Caffeine at point B
= (3.6*10-2
) - (1.8*10-2
)
= (1.8*10-2
) mole/L
PABA entering in to BC phase = PABA total taken – PABA at point B or C
= (7.3*10-2
) - (5.5*10-2
)
= 1.8*10-2
mole/L
Donor acceptor Ratio or stoichiometric ratio = 1.8*10-2
mole/L / 1.8*10-2
mole/L = 1
Donor: Acceptor = 1: 1
Stability constant (K): initial linear portion of AB should be considered for the purpose of
calculation.
Conc. Of caffeine selected on X-axis = 1.0*10-2
mole/L
Satbility constat (K) =
[𝑃𝐴𝐵𝐴 − 𝐶𝑎𝑓𝑓𝑒𝑖𝑛𝑒]
[𝑃𝐴𝐵𝐴] [𝑐𝑎𝑓𝑓𝑒𝑖𝑛𝑒]
[PABA - Caffeine] Complex = [PABA] at (B) - [PABA] at (A)
= (5.3*10-2
) - (4.58*10-2
)
= 0.73*10-2
mole/L
[Caffeine] Complex = [PABA – caffeine]
= 0.73*10-2
mole/L
[PABA] uncomplexed = [PABA] at point A (at solubility)
= 4.58*10-2
mole/L
[Caffeine] uncomplexed = [Caffeine] total - [Caffeine] already complexed
= caffeine chosen on X-axis - [PABA - Caffeine]
= (1.0*10-2
) - (0.73*10-2
)
= 0.27*10-2
Stability constant = 0.73*10-2
/ (4.58*10-2
) (0.27*10-2
)
= 59
Result: Stability constant (β) of PABA-Caffeine complex was determined, found to be
…………………….at donor acceptor ratio……………….
Experiment No. 11
Aim: To analyze copper-glycine complex by pH titration method and to calculate the formation
curve and stability constant.
Requirements: Beaker, glass rod, conical flask, pH meter, volumetric flask, glycine, cupric
chloride, distilled water, NaOH, Graph Paper
Theory:
Complexation of copper ions with Glycine can be represented by the following equation.
Cu+2
+ 2NH3CH2COO-
→ Cu+2
+ (NH2CH2COO-
)2 + 2H+
Because of two protons are formed in the reaction of equation the addition of glycine to a
solution containing cupric ions should result in a decrease in pH. Titration curves can be
obtained by adding a strong base to a solution of glycine and to another solution containing
glycine and a copper salt and plotting the pH against the equivalents of base added. The results
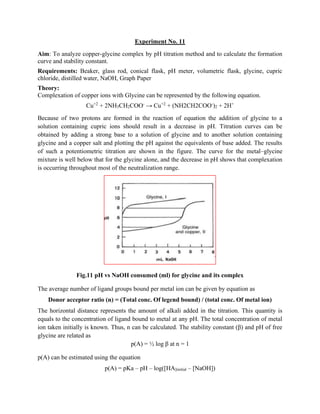
of such a potentiometric titration are shown in the figure. The curve for the metal–glycine
mixture is well below that for the glycine alone, and the decrease in pH shows that complexation
is occurring throughout most of the neutralization range.
Fig.11 pH vs NaOH consumed (ml) for glycine and its complex
The average number of ligand groups bound per metal ion can be given by equation as
Donor acceptor ratio (n) = (Total conc. Of legend bound) / (total conc. Of metal ion)
The horizontal distance represents the amount of alkali added in the titration. This quantity is
equals to the concentration of ligand bound to metal at any pH. The total concentration of metal
ion taken initially is known. Thus, n can be calculated. The stability constant (β) and pH of free
glycine are related as
p(A) = ½ log β at n = 1
p(A) can be estimated using the equation
p(A) = pKa – pH – log([HA]initial – [NaOH])
Procedure:
1. Preparation of Glycine solution: (MW- 75.07 gm/mole, 3.34x10⁻² mole/L) weigh
250mg of glycine and transfer in to a 100ml of volumetric flask. Add distilled water and
make up volume up to the mark.
2. Complex solution (Glycine 3.34x10⁻² mole/L, cupric chloride 9.45x10⁻³ mole/L):
weigh 250mg of glycine and 160mg of cupric chloride and transfer in to a 100ml
volumetric flask. Add distilled water and make up volume up to the mark.
3. Preparation of sodium hydroxide solution (0.25N): Dissolve 1gm of NaOH in 100ml
of distilled water.
4. Take 75ml of glycine solution in to a 250ml beaker and measure the pH of solution.
5. Add gradually 0.25N NaOH (1ml each) solution to the above glycine and periodically
measure the pH.
6. Take 75ml of complex solution in to a 250ml beaker and measure the pH of solution.
7. Add gradually 0.25N NaOH (1ml each) solution to the above glycine and periodically
measure the pH.
8. Plot a graph of pH on y-axis and no of ml of NaOH on X-axis. It will be two line graph
one for glycine solution one for complex solution.
9. After that calculate n and p[A] value by given equation at every pH point(complex
solution).
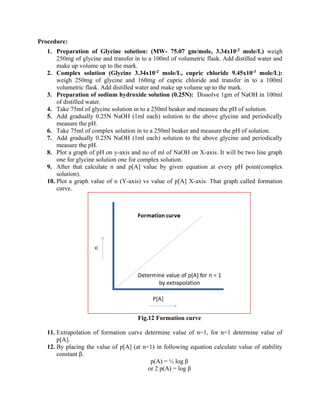
10. Plot a graph value of n (Y-axis) vs value of p[A] X-axis. That graph called formation
curve.
Fig.12 Formation curve
11. Extrapolation of formation curve determine value of n=1, for n=1 determine value of
p[A].
12. By placing the value of p[A] (at n=1) in following equation calculate value of stability
constant β.
p(A) = ½ log β
or 2 p(A) = log β
Observation:
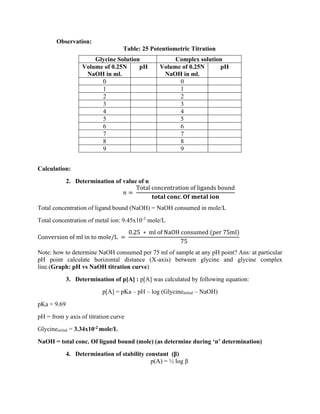
Table: 25 Potentiometric Titration
Glycine Solution Complex solution
Volume of 0.25N
NaOH in ml.
pH Volume of 0.25N
NaOH in ml.
pH
0 0
1 1
2 2
3 3
4 4
5 5
6 6
7 7
8 8
9 9
Calculation:
2. Determination of value of n
𝑛 =
Total concentration of ligands bound
𝐭𝐨𝐭𝐚𝐥 𝐜𝐨𝐧𝐜. 𝐎𝐟 𝐦𝐞𝐭𝐚𝐥 𝐢𝐨𝐧
Total concentration of ligand bound (NaOH) = NaOH consumed in mole/L
Total concentration of metal ion: 9.45x10⁻³
mole/L
Conversion of ml in to mole/L =
0.25 ∗ ml of NaOH consumed (per 75ml)
75
Note: how to determine NaOH consumed per 75 ml of sample at any pH point? Ans: at particular
pH point calculate horizontal distance (X-axis) between glycine and glycine complex
line.(Graph: pH vs NaOH titration curve)
3. Determination of p[A] : p[A] was calculated by following equation:
p[A] = pKa – pH – log (Glycineinitial – NaOH)
pKa = 9.69
pH = from y axis of titration curve
Glycineinitial = 3.34x10⁻² mole/L
NaOH = total conc. Of ligand bound (mole) (as determine during ‘n’ determination)
4. Determination of stability constant (β)
p(A) = ½ log β
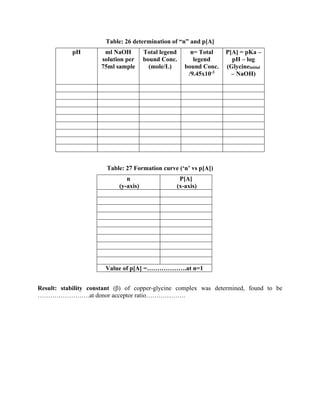
Table: 26 determination of “n” and p[A]
pH ml NaOH
solution per
75ml sample
Total legend
bound Conc.
(mole/L)
n= Total
legend
bound Conc.
/9.45x10-3
P[A] = pKa –
pH – log
(Glycineinitial
– NaOH)
Table: 27 Formation curve (‘n’ vs p[A])
n
(y-axis)
P[A]
(x-axis)
Value of p[A] =……………….at n=1
Result: stability constant (β) of copper-glycine complex was determined, found to be
…………………….at donor acceptor ratio……………….
Experiment No. 12
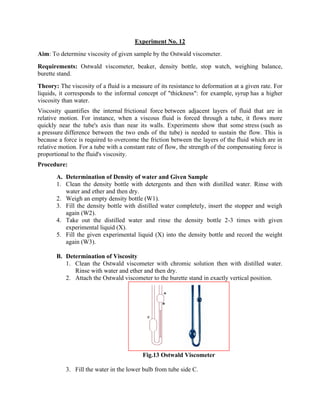
Aim: To determine viscosity of given sample by the Ostwald viscometer.
Requirements: Ostwald viscometer, beaker, density bottle, stop watch, weighing balance,
burette stand.
Theory: The viscosity of a fluid is a measure of its resistance to deformation at a given rate. For
liquids, it corresponds to the informal concept of "thickness": for example, syrup has a higher
viscosity than water.
Viscosity quantifies the internal frictional force between adjacent layers of fluid that are in
relative motion. For instance, when a viscous fluid is forced through a tube, it flows more
quickly near the tube's axis than near its walls. Experiments show that some stress (such as
a pressure difference between the two ends of the tube) is needed to sustain the flow. This is
because a force is required to overcome the friction between the layers of the fluid which are in
relative motion. For a tube with a constant rate of flow, the strength of the compensating force is
proportional to the fluid's viscosity.
Procedure:
A. Determination of Density of water and Given Sample
1. Clean the density bottle with detergents and then with distilled water. Rinse with
water and ether and then dry.
2. Weigh an empty density bottle (W1).
3. Fill the density bottle with distilled water completely, insert the stopper and weigh
again (W2).
4. Take out the distilled water and rinse the density bottle 2-3 times with given
experimental liquid (X).
5. Fill the given experimental liquid (X) into the density bottle and record the weight
again (W3).
B. Determination of Viscosity
1. Clean the Ostwald viscometer with chromic solution then with distilled water.
Rinse with water and ether and then dry.
2. Attach the Ostwald viscometer to the burette stand in exactly vertical position.
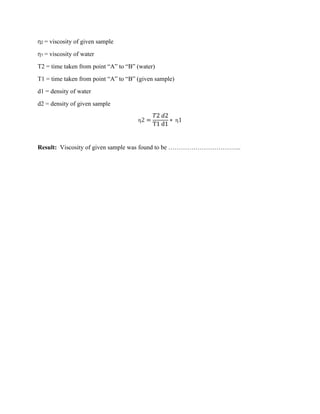
Fig.13 Ostwald Viscometer
3. Fill the water in the lower bulb from tube side C.
4. Now suck the water from tube side A. slightly above the mark A.
5. Allow to water to flow freely, now keep the handy stop watch and start when
water level reaches to the mark A.
6. Note down the time taken to reach water level from mark “A” to mark “B”.
7. Repeat the experiment for three times.
8. Repeat step 3 to 7 with given sample.
9. Calculate mean value.
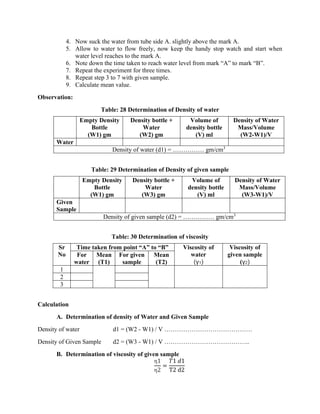
Observation:
Table: 28 Determination of Density of water
Empty Density
Bottle
(W1) gm
Density bottle +
Water
(W2) gm
Volume of
density bottle
(V) ml
Density of Water
Mass/Volume
(W2-W1)/V
Water
Density of water (d1) = …………… gm/cm3
Table: 29 Determination of Density of given sample
Empty Density
Bottle
(W1) gm
Density bottle +
Water
(W3) gm
Volume of
density bottle
(V) ml
Density of Water
Mass/Volume
(W3-W1)/V
Given
Sample
Density of given sample (d2) = …………… gm/cm3
Table: 30 Determination of viscosity
Sr
No
Time taken from point “A” to “B” Viscosity of
water
(γ1)
Viscosity of
given sample
(γ2)
For
water
Mean
(T1)
For given
sample
Mean
(T2)
1
2
3
Calculation
A. Determination of density of Water and Given Sample
Density of water d1 = (W2 - W1) / V ……………………………………
Density of Given Sample d2 = (W3 - W1) / V …………………………………..
B. Determination of viscosity of given sample
η1
η2
=
𝑇1 𝑑1
T2 d2
η2 = viscosity of given sample
η1 = viscosity of water
T2 = time taken from point “A” to “B” (water)
T1 = time taken from point “A” to “B” (given sample)
d1 = density of water
d2 = density of given sample
η2 =
𝑇2 𝑑2
T1 d1
∗ η1
Result: Viscosity of given sample was found to be ……………………………..
Experiment No. 13
Aim: To study the flow properties of the given powder and effect of lubricant on flow properties.
Requirements: funnel, graph paper, scale, powder, lubricant/
Theory:
Lubricants are substances that we use in tablet and capsule formulations in order to reduce the
friction. More importantly, these substances reduce the friction between particles that we use to
make the tablet during compression. Glidants are substances that we use to increase the
flowability of a powder.
Lubrication plays a key role in successful manufacturing of pharmaceutical solid dosage forms;
lubricants are essential ingredients in robust formulations to achieve this. Although many failures
in pharmaceutical manufacturing operations are caused by issues related to lubrication, in
general, lubricants do not gain adequate attention in the development of pharmaceutical
formulations. The fundamental background on lubrication is introduced, in which the
relationships between lubrication and friction/adhesion forces.
Procedure: 0
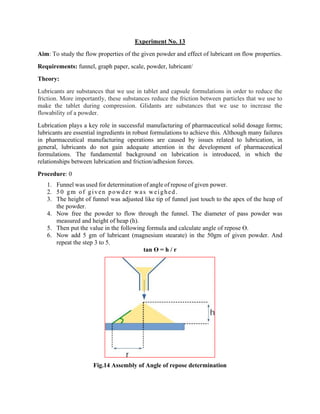
1. Funnel was used for determination of angle of repose of given power.
2. 50 gm of given powder was weighed .
3. The height of funnel was adjusted like tip of funnel just touch to the apex of the heap of
the powder.
4. Now free the powder to flow through the funnel. The diameter of pass powder was
measured and height of heap (h).
5. Then put the value in the following formula and calculate angle of repose ϴ.
6. Now add 5 gm of lubricant (magnesium stearate) in the 50gm of given powder. And
repeat the step 3 to 5.
tan ϴ = h / r
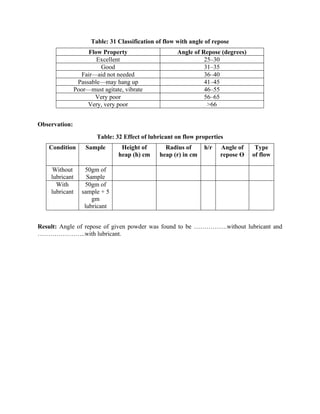
Fig.14 Assembly of Angle of repose determination
Table: 31 Classification of flow with angle of repose
Flow Property Angle of Repose (degrees)
Excellent 25–30
Good 31–35
Fair—aid not needed 36–40
Passable—may hang up 41–45
Poor—must agitate, vibrate 46–55
Very poor 56–65
Very, very poor >66
Observation:
Table: 32 Effect of lubricant on flow properties
Condition Sample Height of
heap (h) cm
Radius of
heap (r) in cm
h/r Angle of
repose ϴ
Type
of flow
Without
lubricant
50gm of
Sample
With
lubricant
50gm of
sample + 5
gm
lubricant
Result: Angle of repose of given powder was found to be …………….without lubricant and
…………………..with lubricant.