2
About Me
Senior Program Manager (SQL Tiger Team)
8 Years
@talktosavjani
http://www.sqlserverfaq.net
https://blogs.msdn.microsoft.com/sql_server_team/
https://blogs.msdn.microsoft.com/sqlreleaseservices/
@mssqltiger
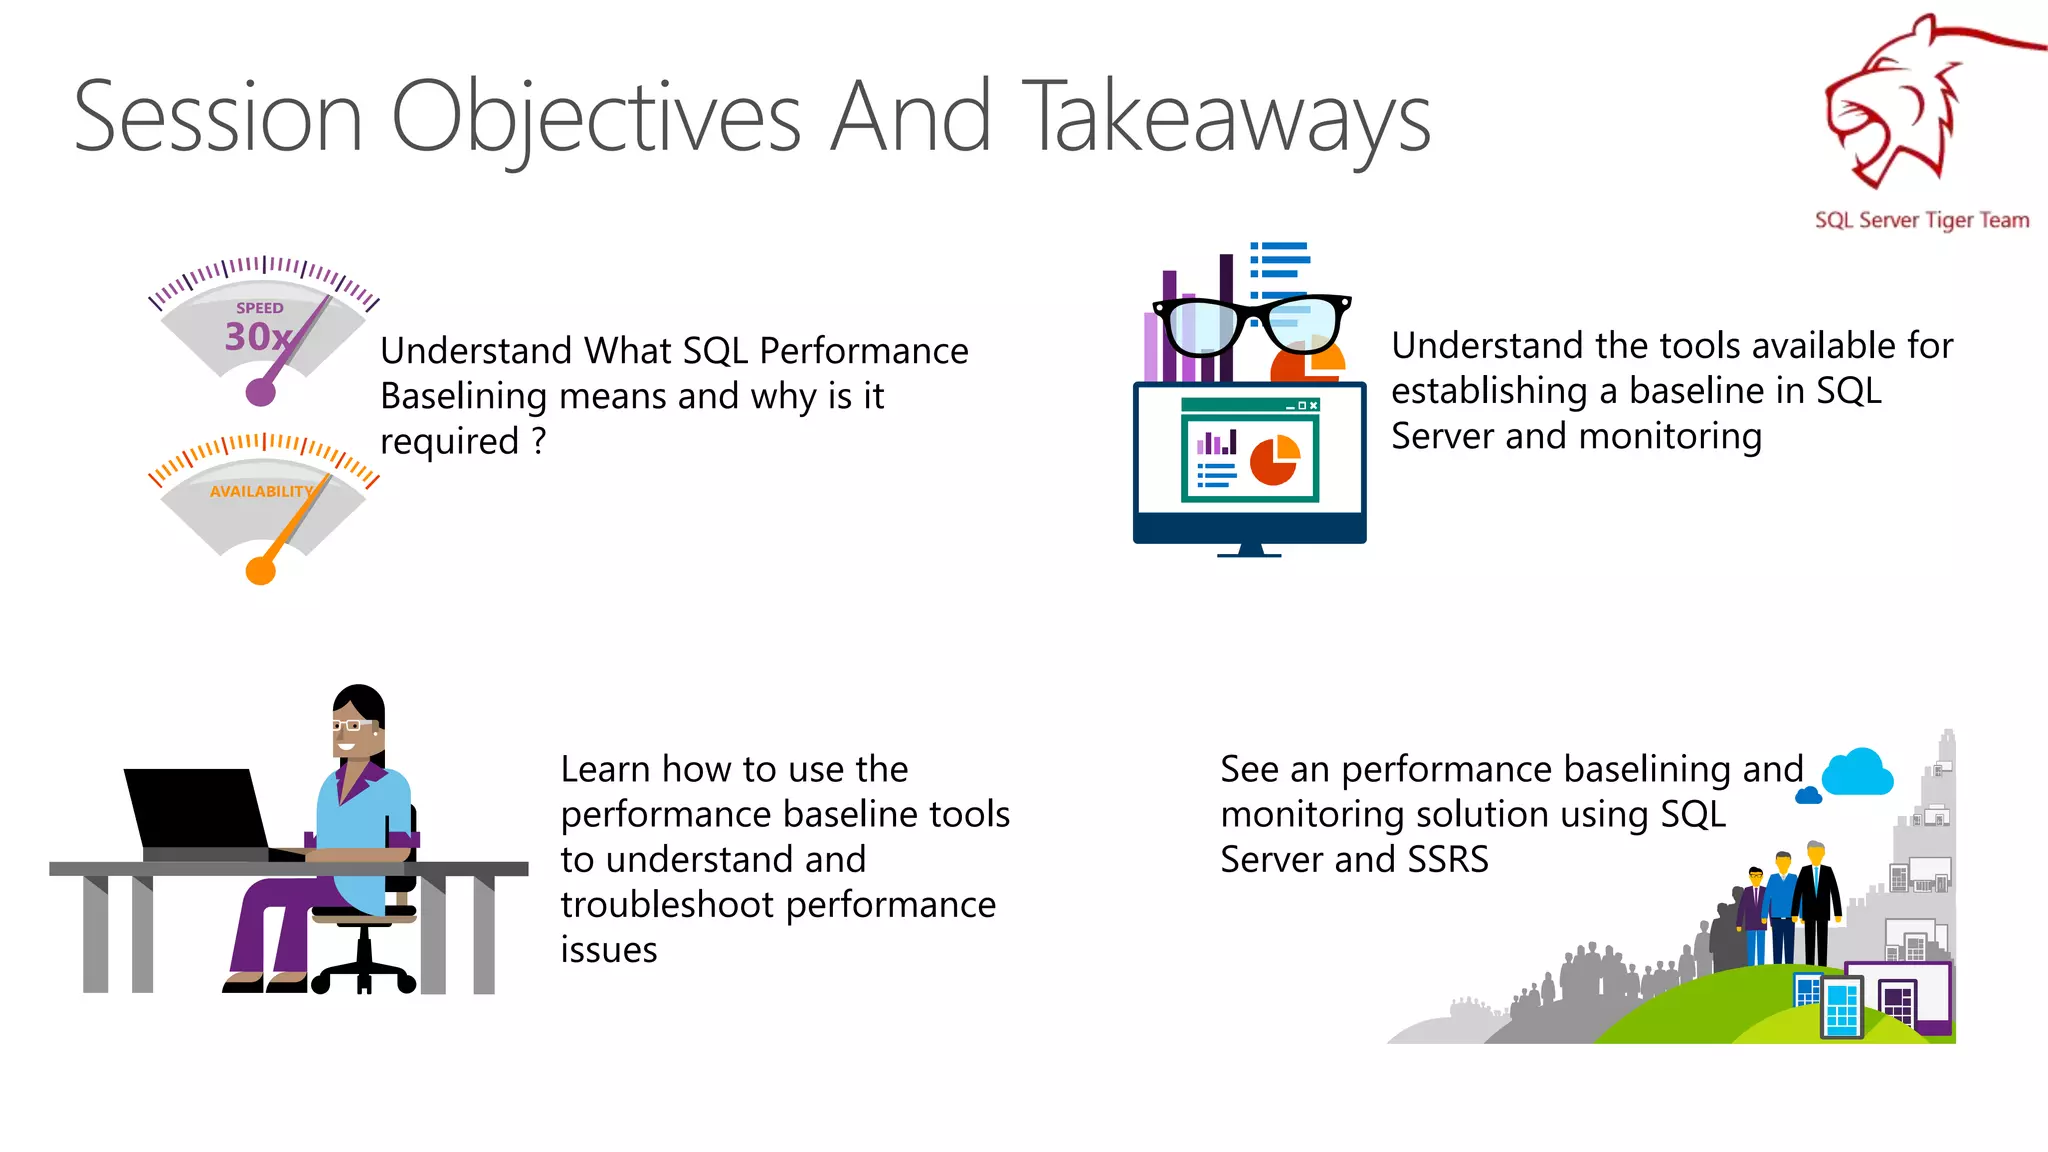
Understand What SQL Performance
Baselining means and why is it
required ?
Understand the tools available for
establishing a baseline in SQL
Server and monitoring
Learn how to use the
performance baseline tools
to understand and
troubleshoot performance
issues
See an performance baselining and
monitoring solution using SQL
Server and SSRS
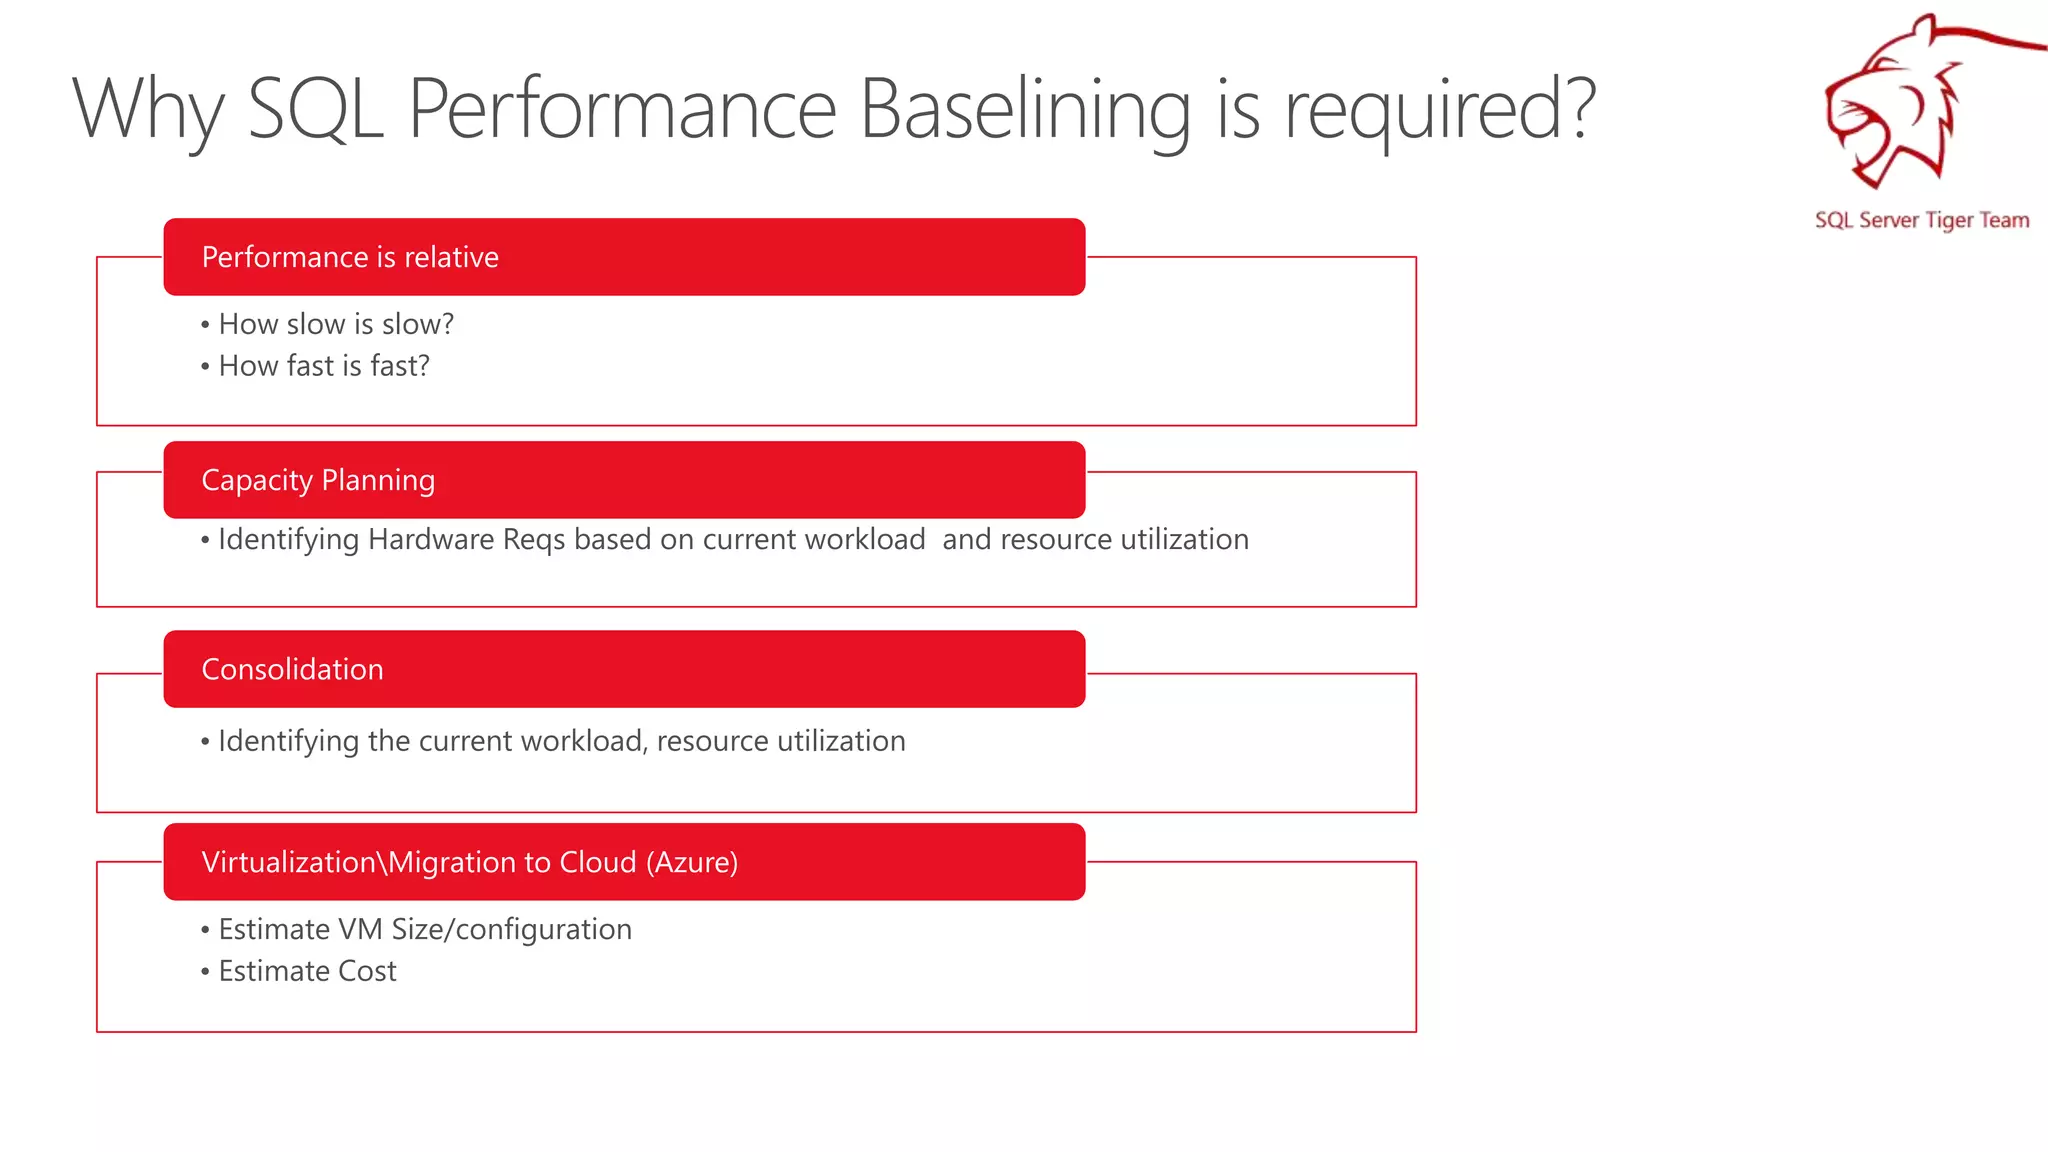
• How slow is slow?
• How fast is fast?
Performance is relative
• Identifying Hardware Reqs based on current workload and resource utilization
Capacity Planning
• Identifying the current workload, resource utilization
Consolidation
• Estimate VM Size/configuration
• Estimate Cost
VirtualizationMigration to Cloud (Azure)
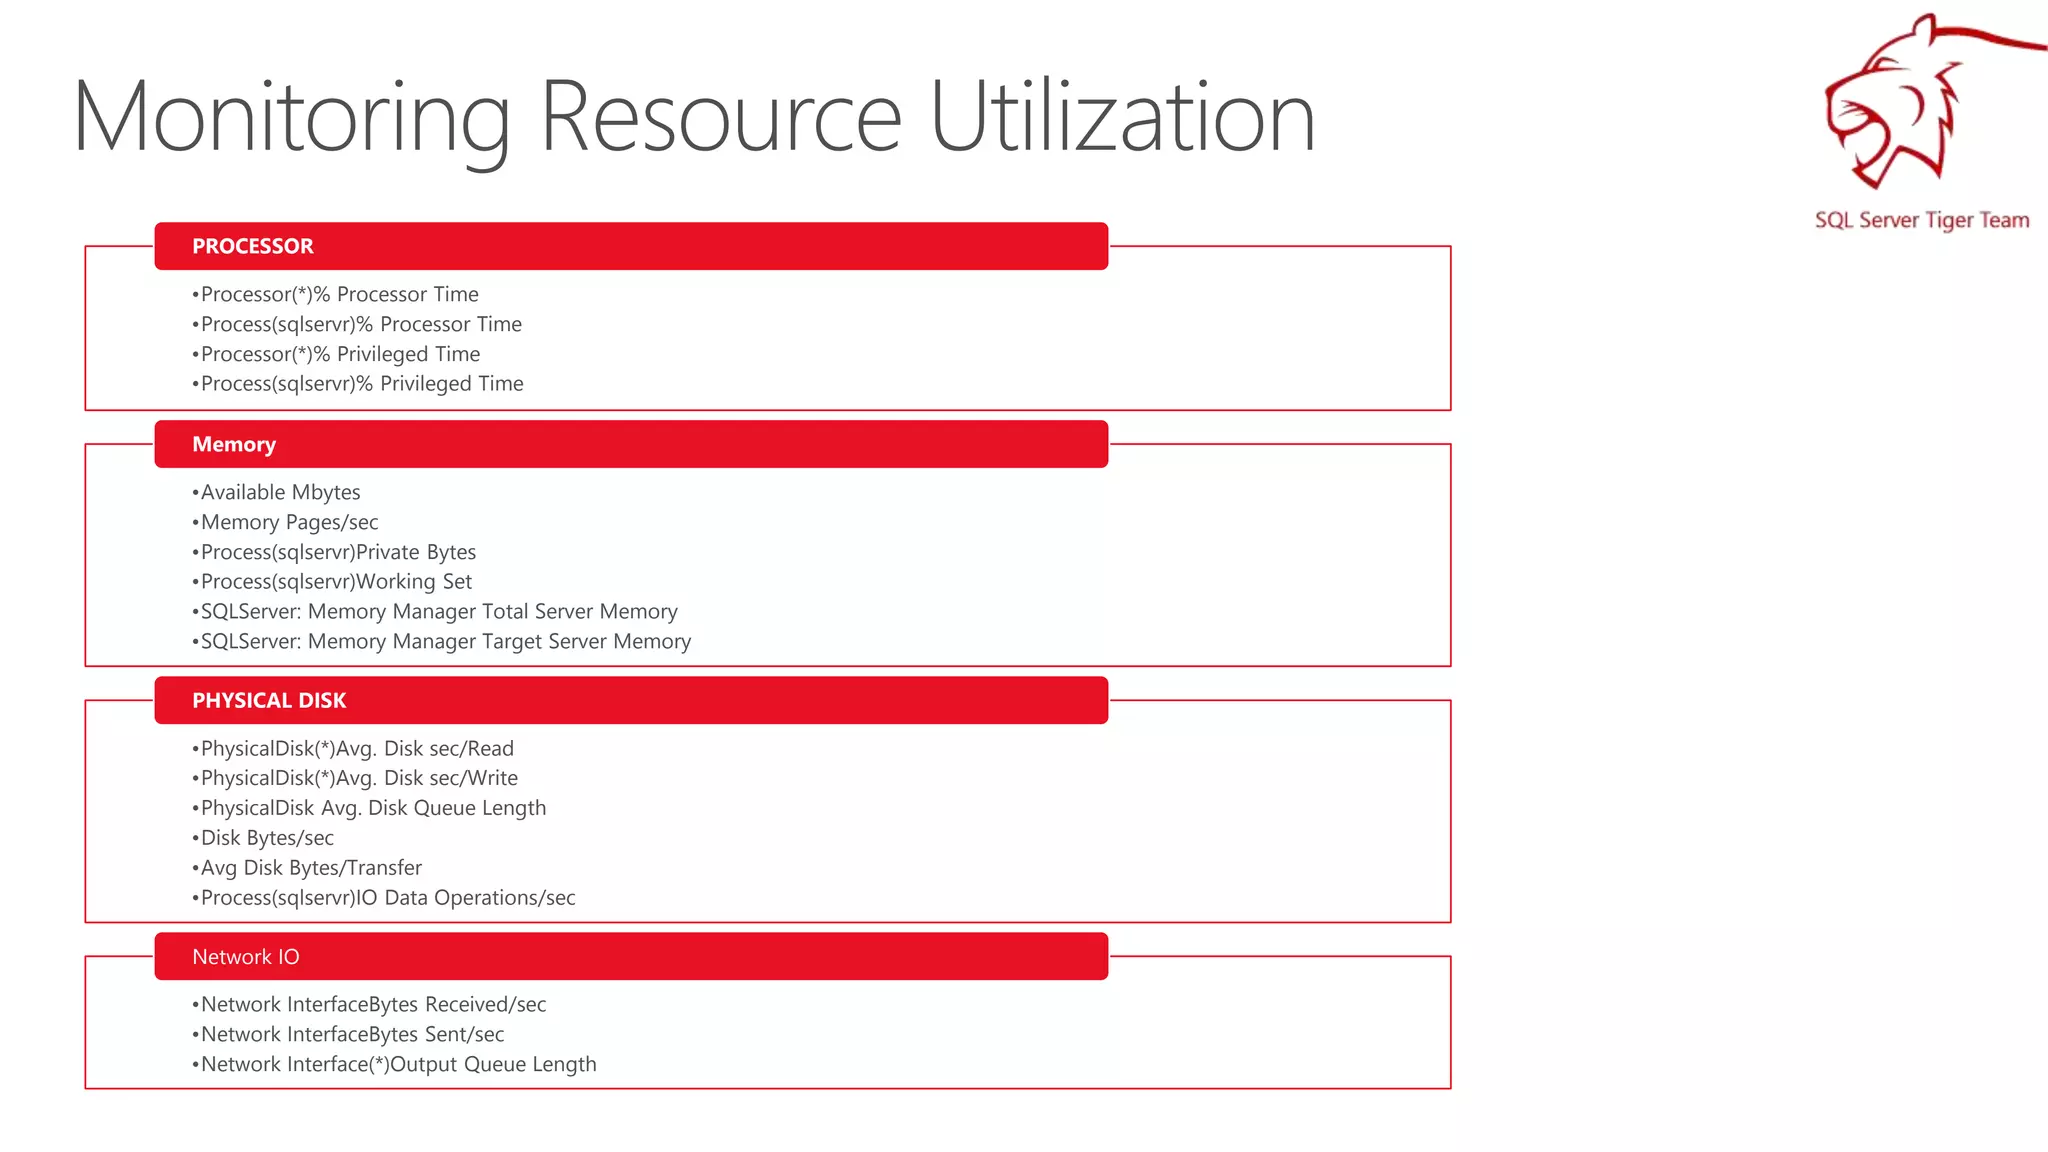
•Processor(*)% Processor Time
•Process(sqlservr)% Processor Time
•Processor(*)% Privileged Time
•Process(sqlservr)% Privileged Time
PROCESSOR
•Available Mbytes
•Memory Pages/sec
•Process(sqlservr)Private Bytes
•Process(sqlservr)Working Set
•SQLServer: Memory Manager Total Server Memory
•SQLServer: Memory Manager Target Server Memory
Memory
•PhysicalDisk(*)Avg. Disk sec/Read
•PhysicalDisk(*)Avg. Disk sec/Write
•PhysicalDisk Avg. Disk Queue Length
•Disk Bytes/sec
•Avg Disk Bytes/Transfer
•Process(sqlservr)IO Data Operations/sec
PHYSICAL DISK
•Network InterfaceBytes Received/sec
•Network InterfaceBytes Sent/sec
•Network Interface(*)Output Queue Length
Network IO
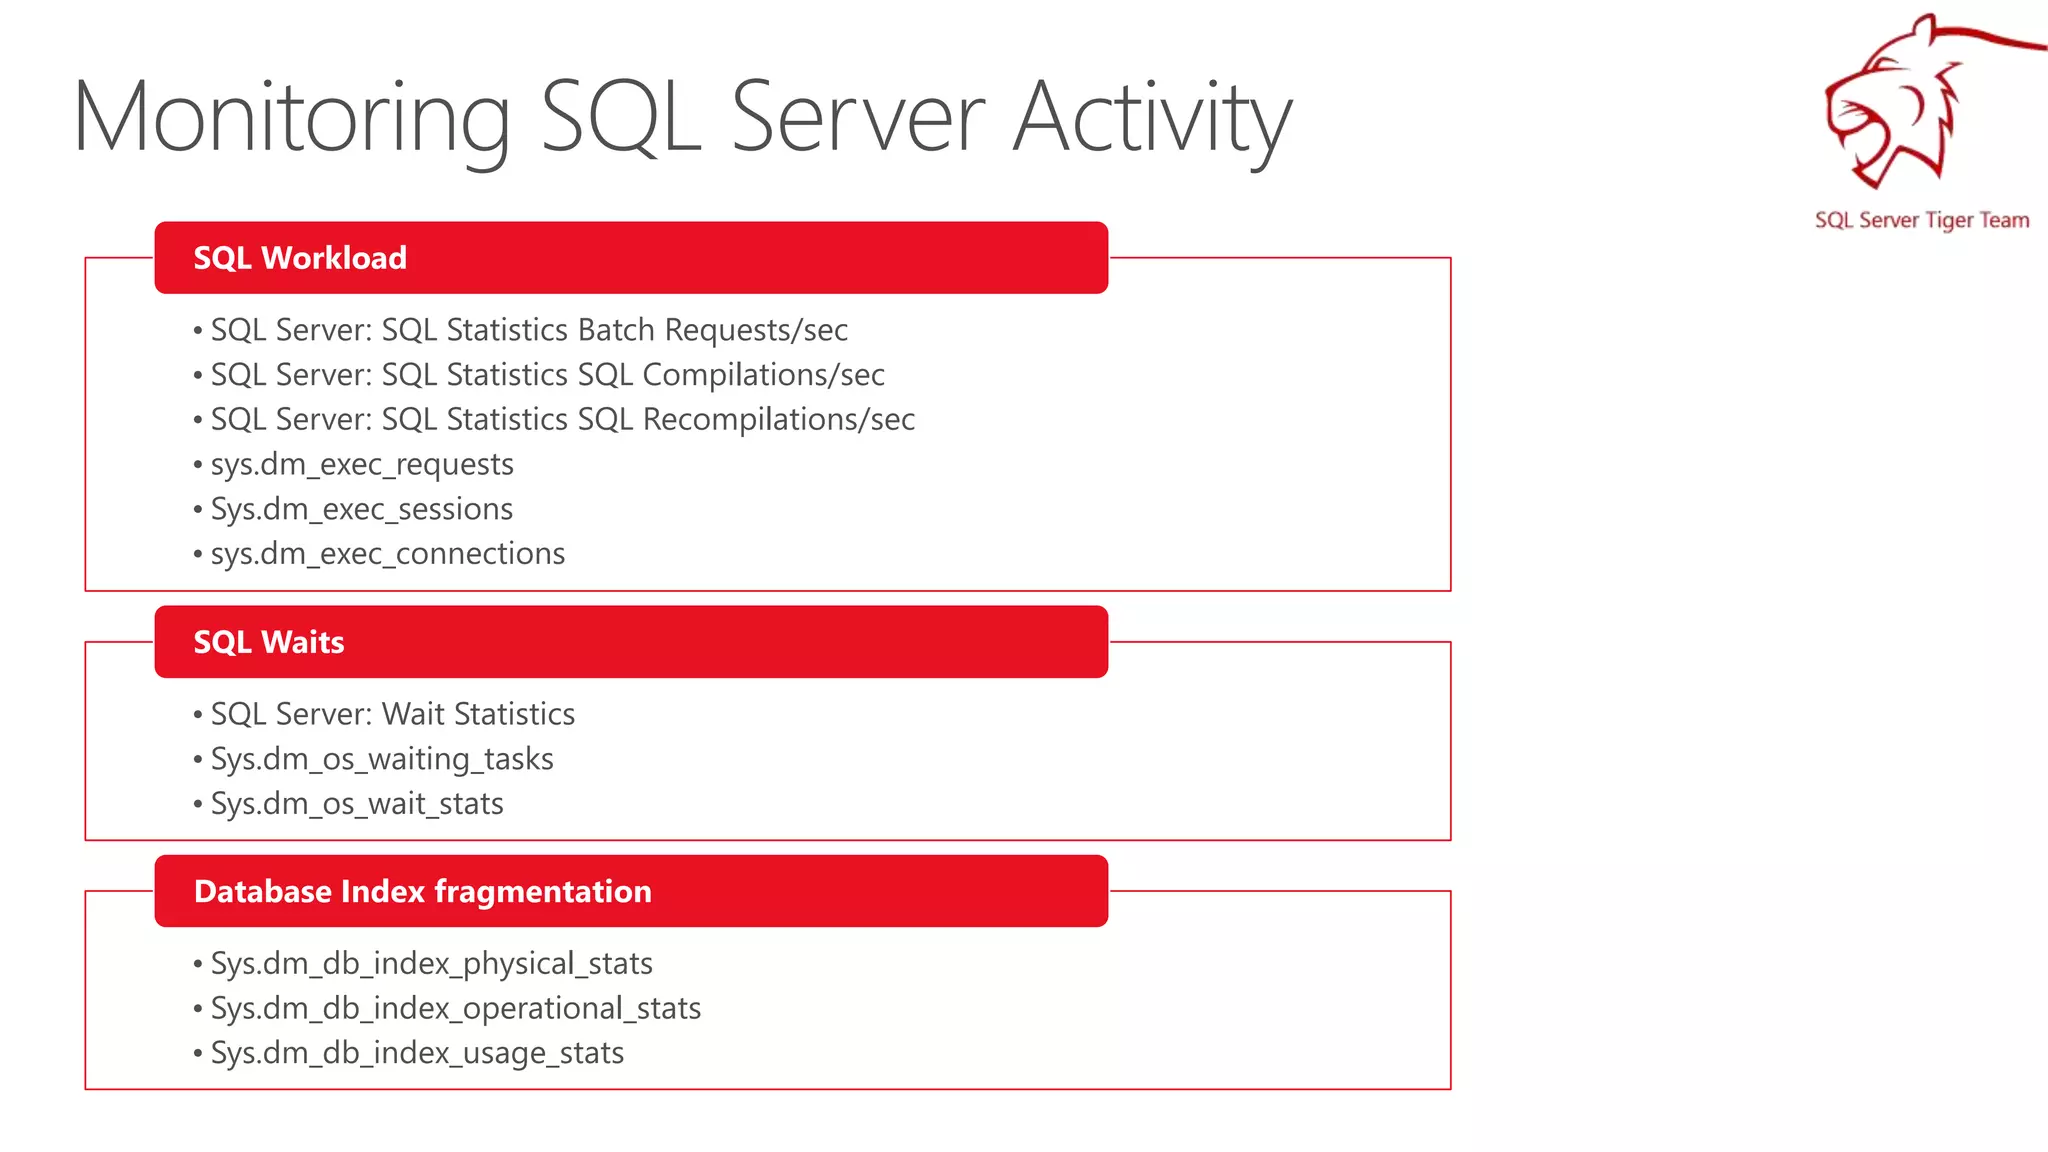
• SQL Server: SQL Statistics Batch Requests/sec
• SQL Server: SQL Statistics SQL Compilations/sec
• SQL Server: SQL Statistics SQL Recompilations/sec
• sys.dm_exec_requests
• Sys.dm_exec_sessions
• sys.dm_exec_connections
SQL Workload
• SQL Server: Wait Statistics
• Sys.dm_os_waiting_tasks
• Sys.dm_os_wait_stats
SQL Waits
• Sys.dm_db_index_physical_stats
• Sys.dm_db_index_operational_stats
• Sys.dm_db_index_usage_stats
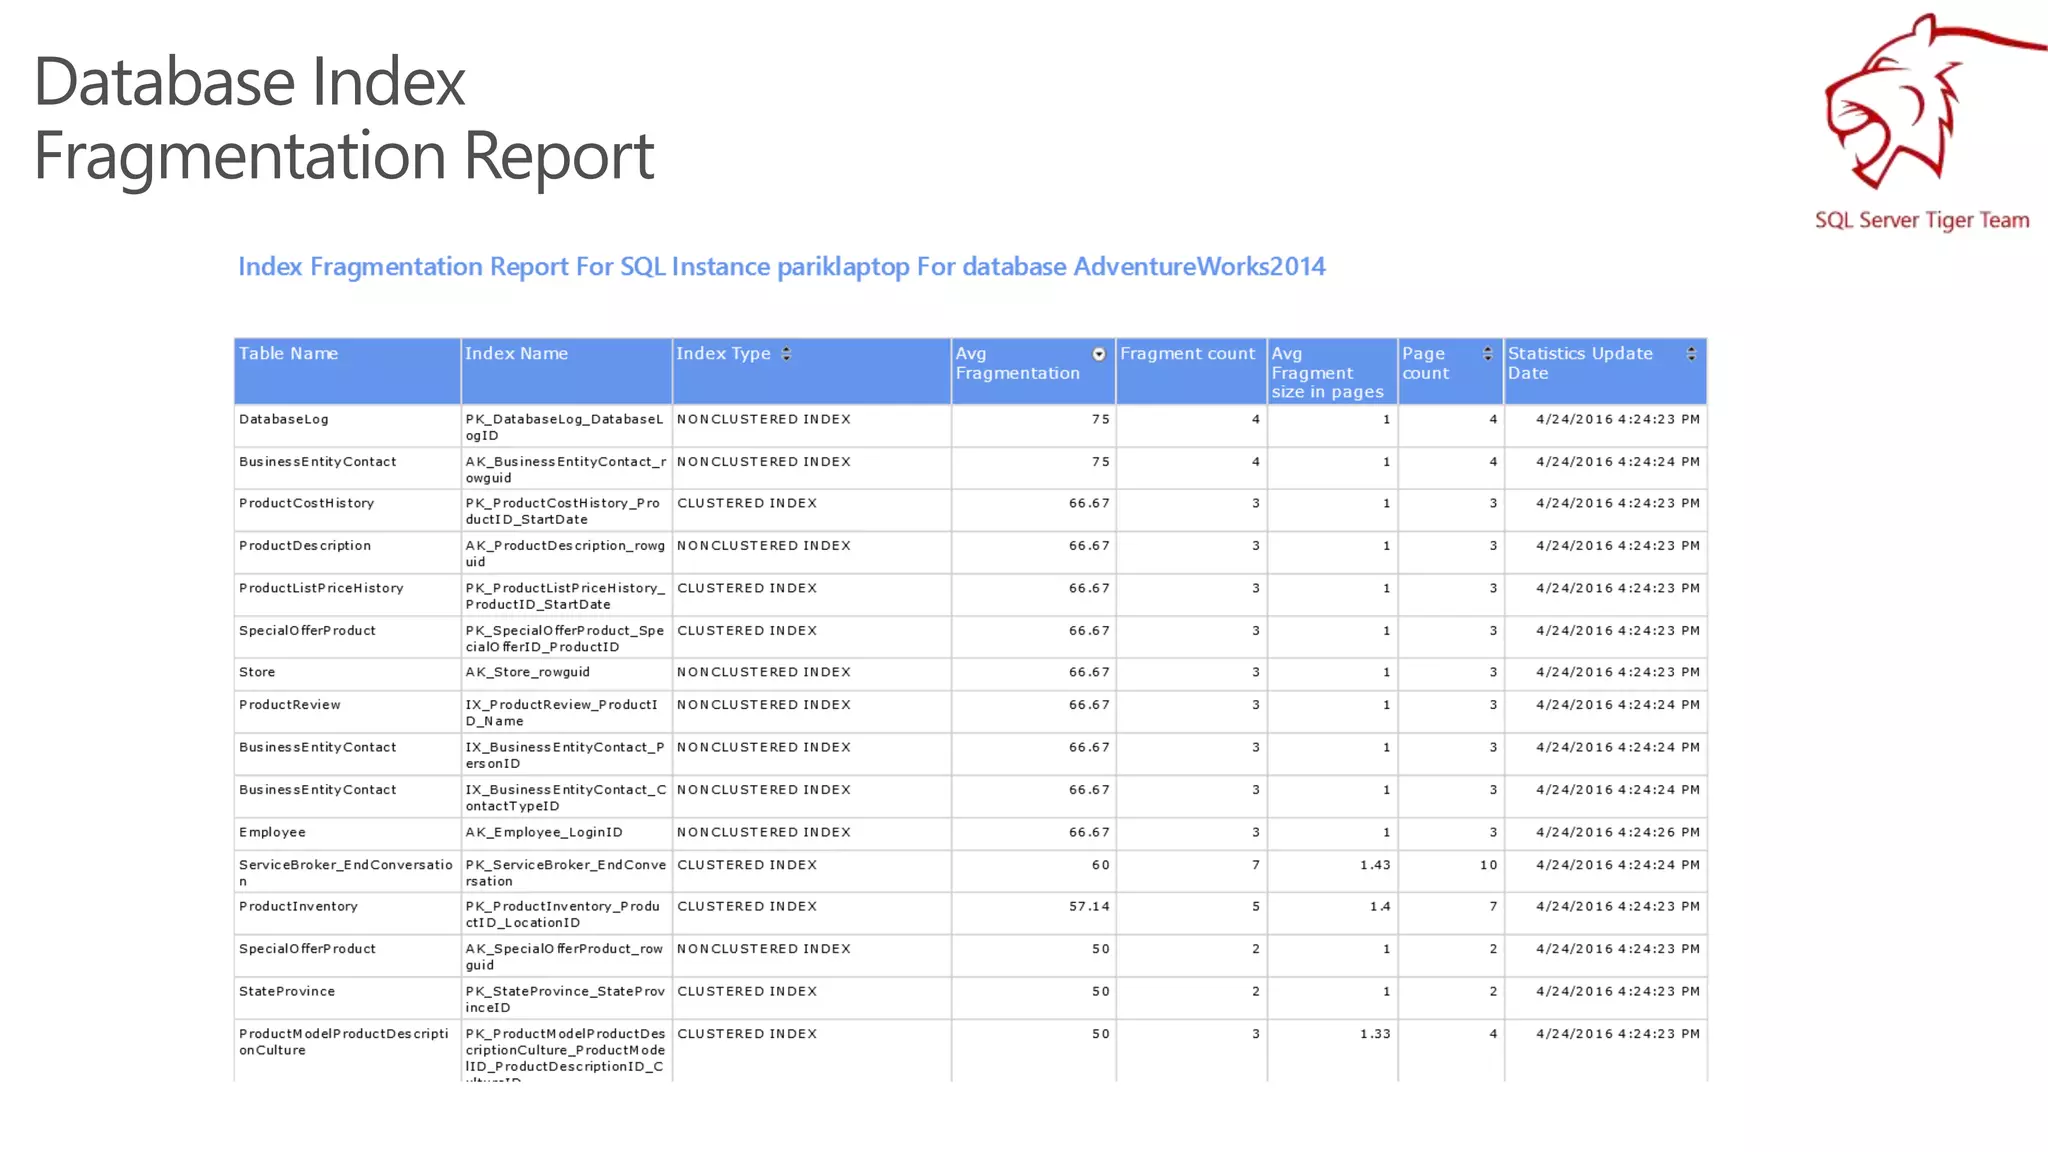
Database Index fragmentation
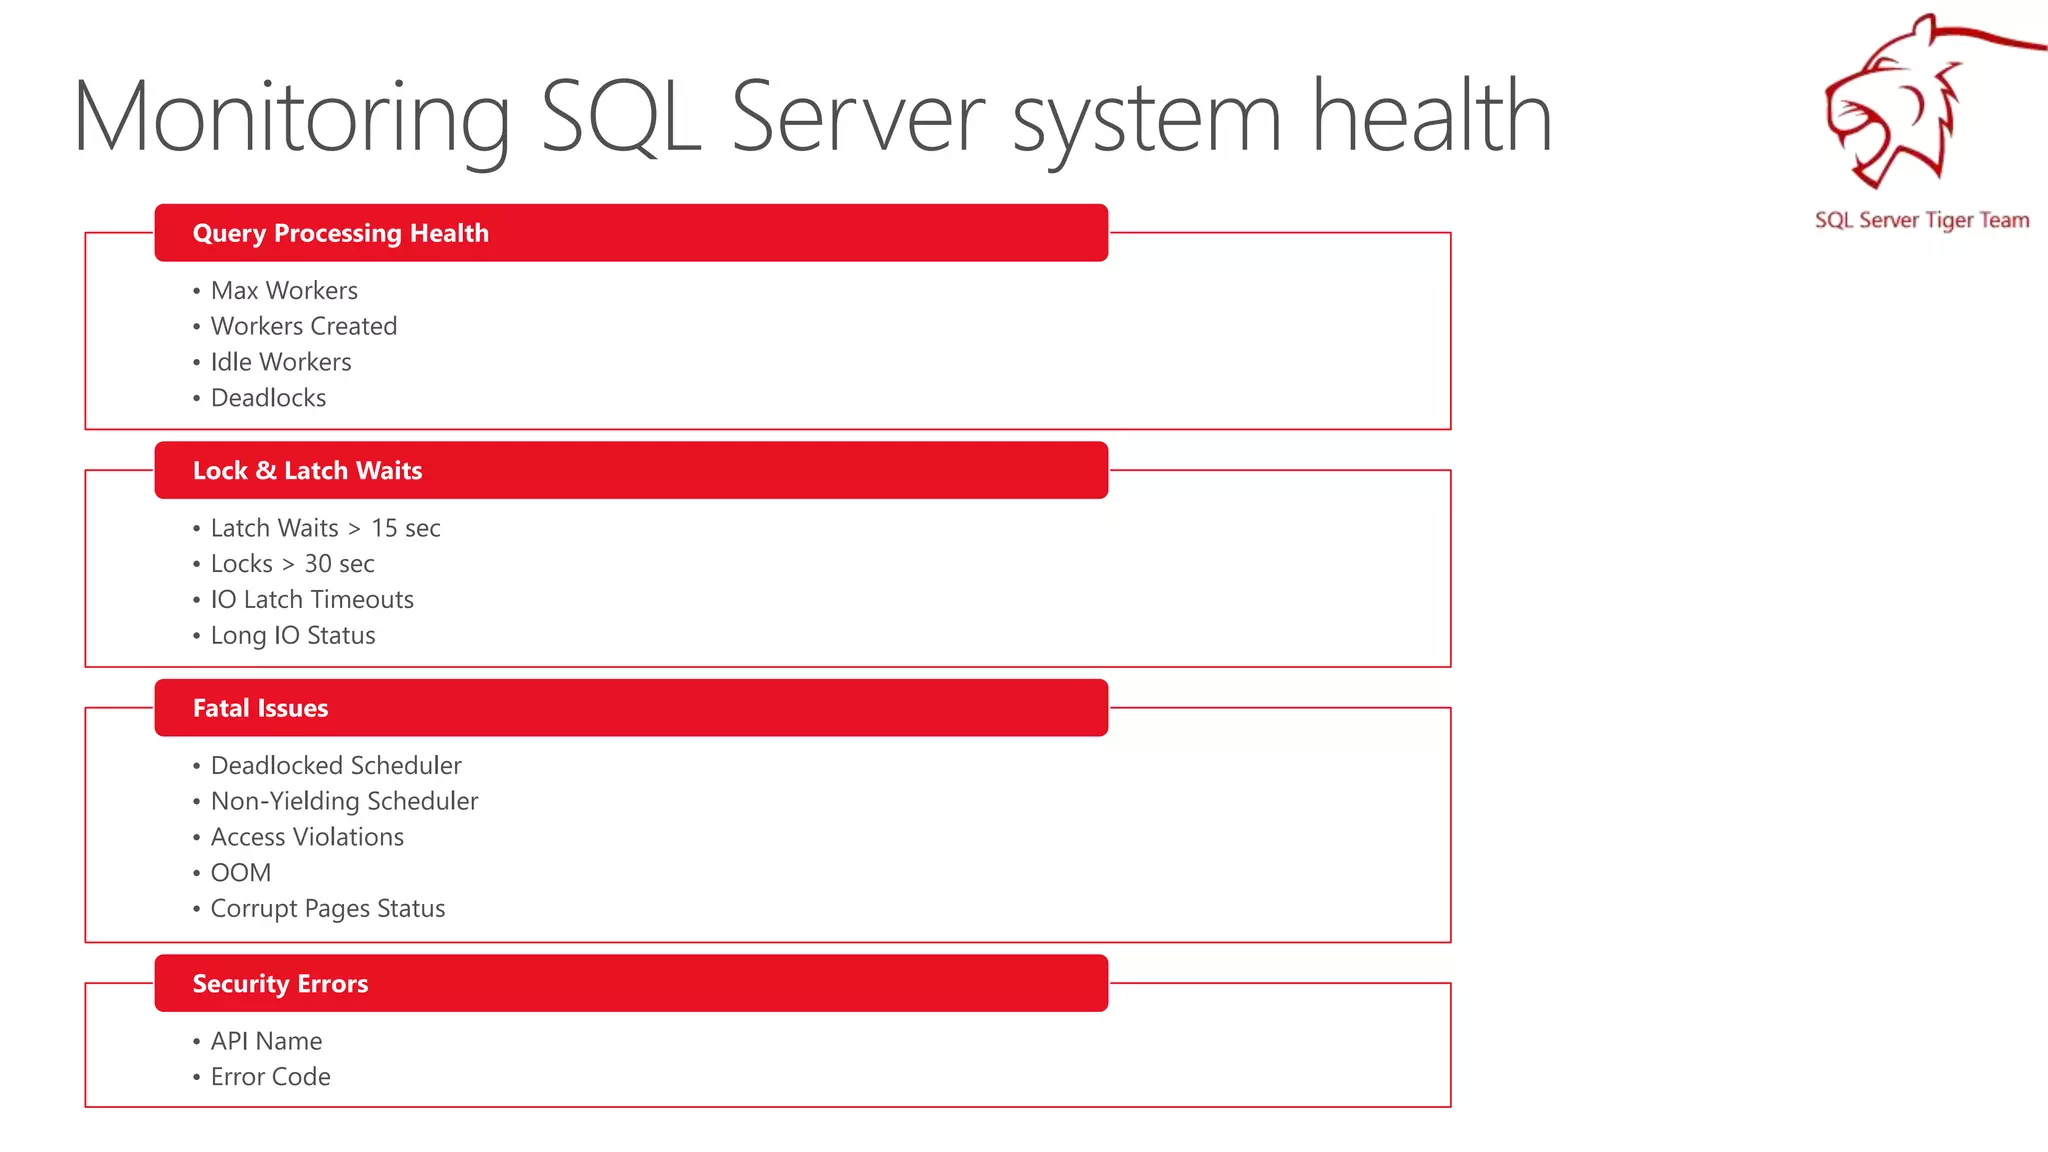
• Max Workers
• Workers Created
• Idle Workers
• Deadlocks
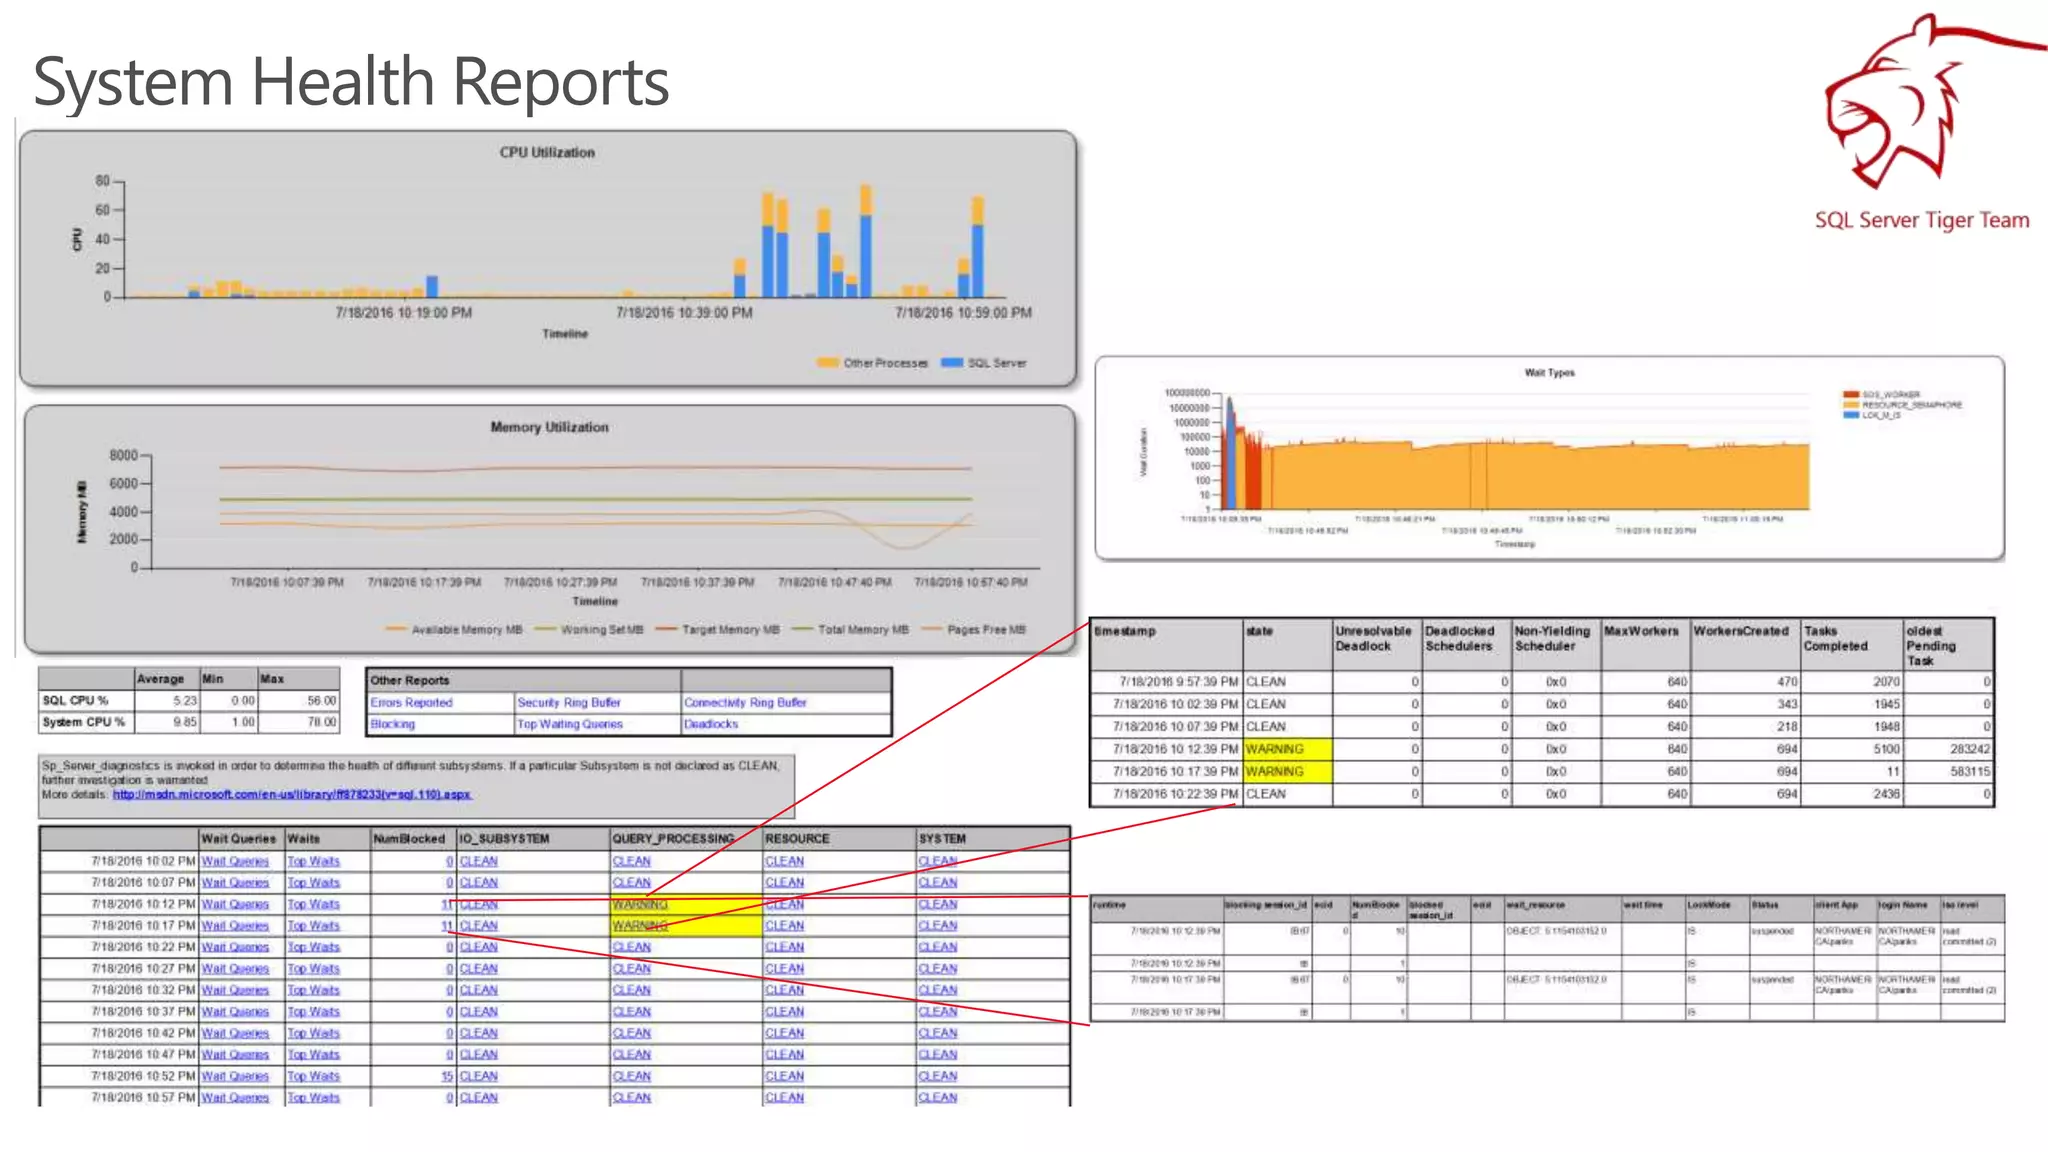
Query Processing Health
• Latch Waits > 15 sec
• Locks > 30 sec
• IO Latch Timeouts
• Long IO Status
Lock & Latch Waits
• Deadlocked Scheduler
• Non-Yielding Scheduler
• Access Violations
• OOM
• Corrupt Pages Status
Fatal Issues
• API Name
• Error Code
Security Errors
SQL Server Tiger Team
• Data Collected in ring buffer target & *.xel files in Log
Folder ( 4 Rollover Files of 5MB)
• Increase System Health Xel File retention
ALTER EVENT SESSION [system_health] ON SERVER STATE = STOP
go
ALTER EVENT SESSION [system_health] ON SERVER
DROP TARGET package0.event_file
ALTER EVENT SESSION [system_health] ON SERVER
ADD TARGET package0.event_file
(SET filename=N'system_health.xel'
,max_file_size=(25),
max_rollover_files=(5))
GO
ALTER EVENT SESSION [system_health] ON SERVER STATE = START
go
12
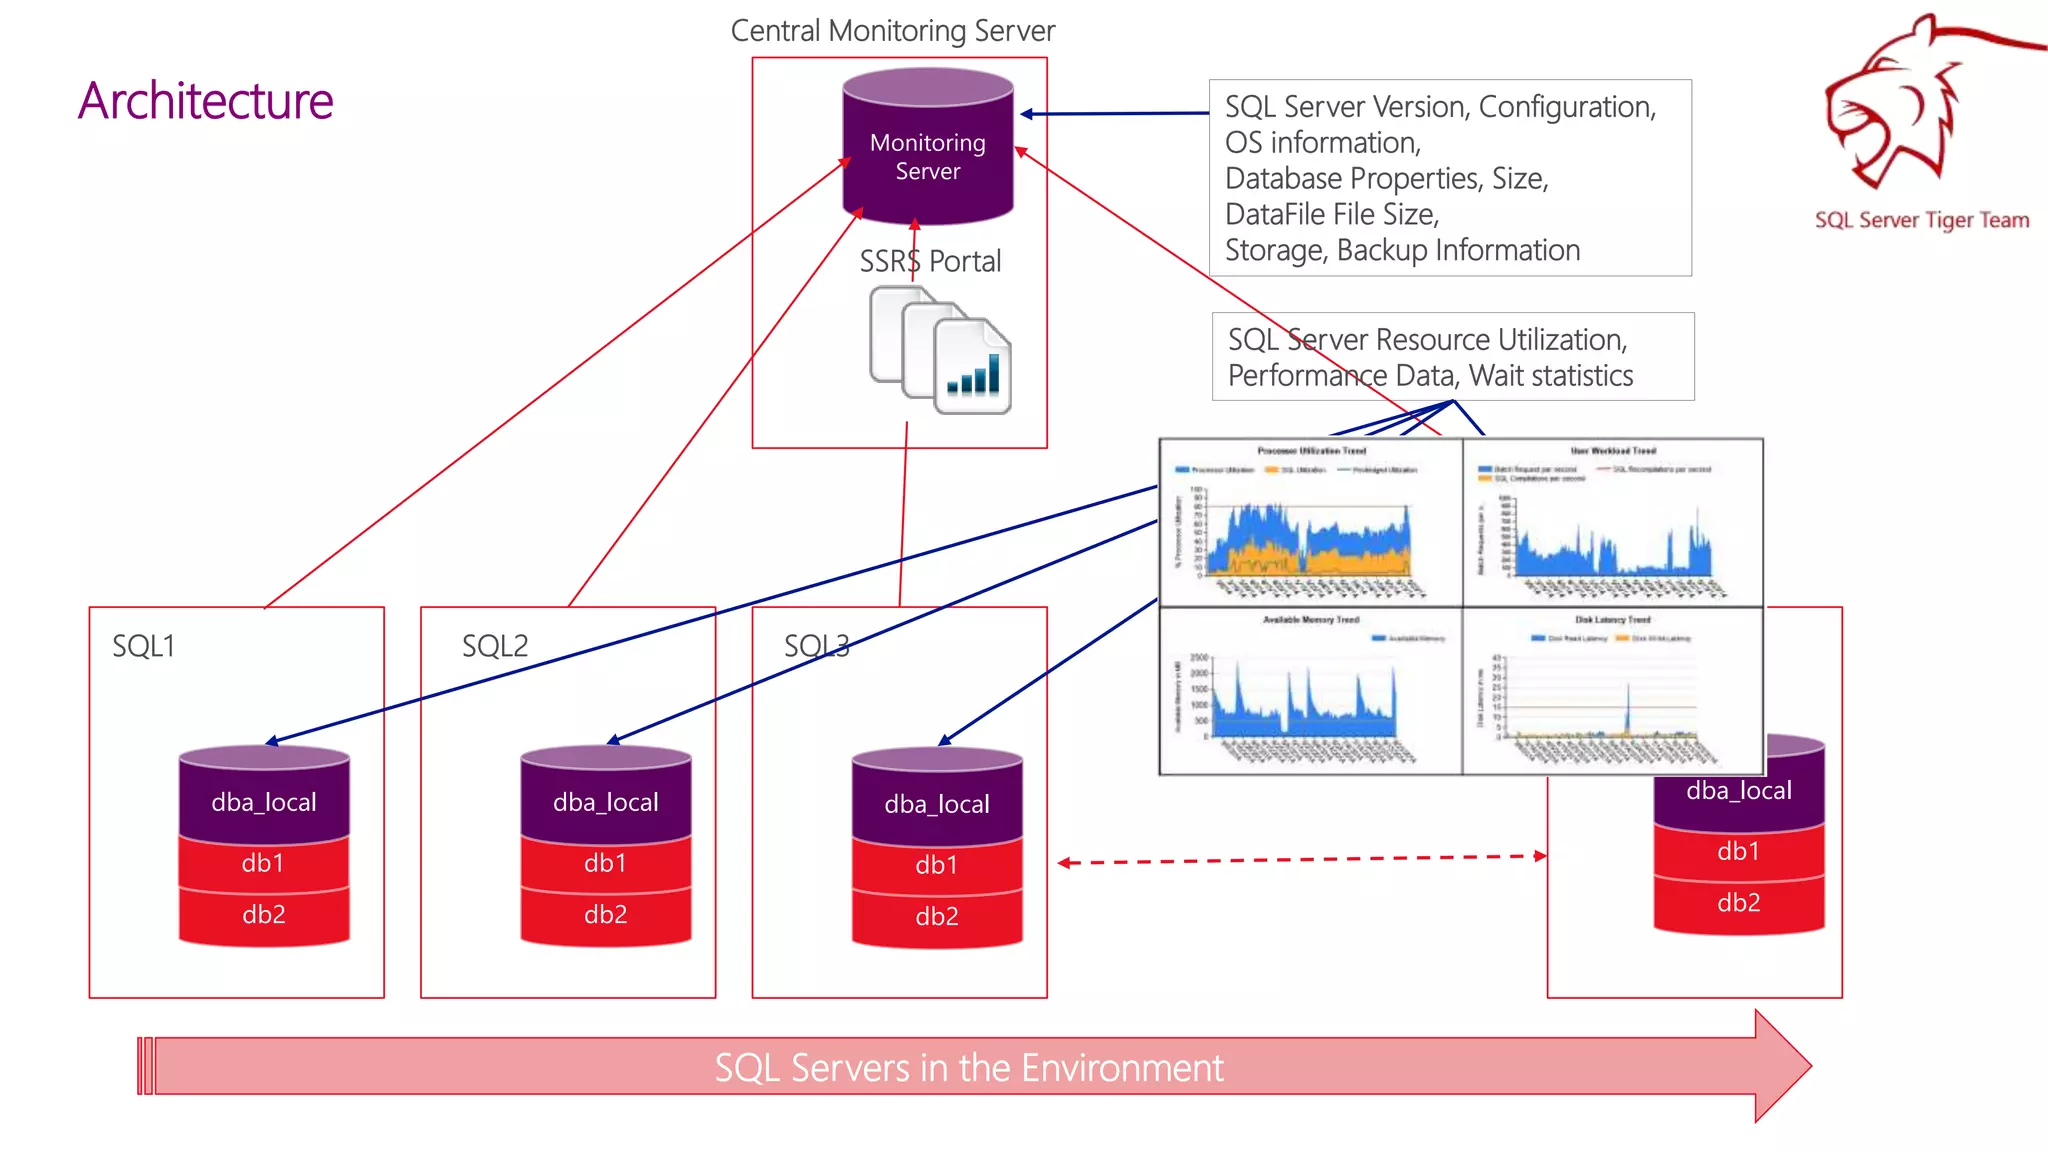
Architecture
Monitoring
Server
SQL1 SQL2 SQL3 SQLN
SQL Servers in the Environment
db2
db1
dba_local
db2
db1
dba_local
db2
db1
dba_local
db2
db1
dba_local
Central Monitoring Server
SSRS Portal
SQL Server Version, Configuration,
OS information,
Database Properties, Size,
DataFile File Size,
Storage, Backup Information
SQL Server Resource Utilization,
Performance Data, Wait statistics
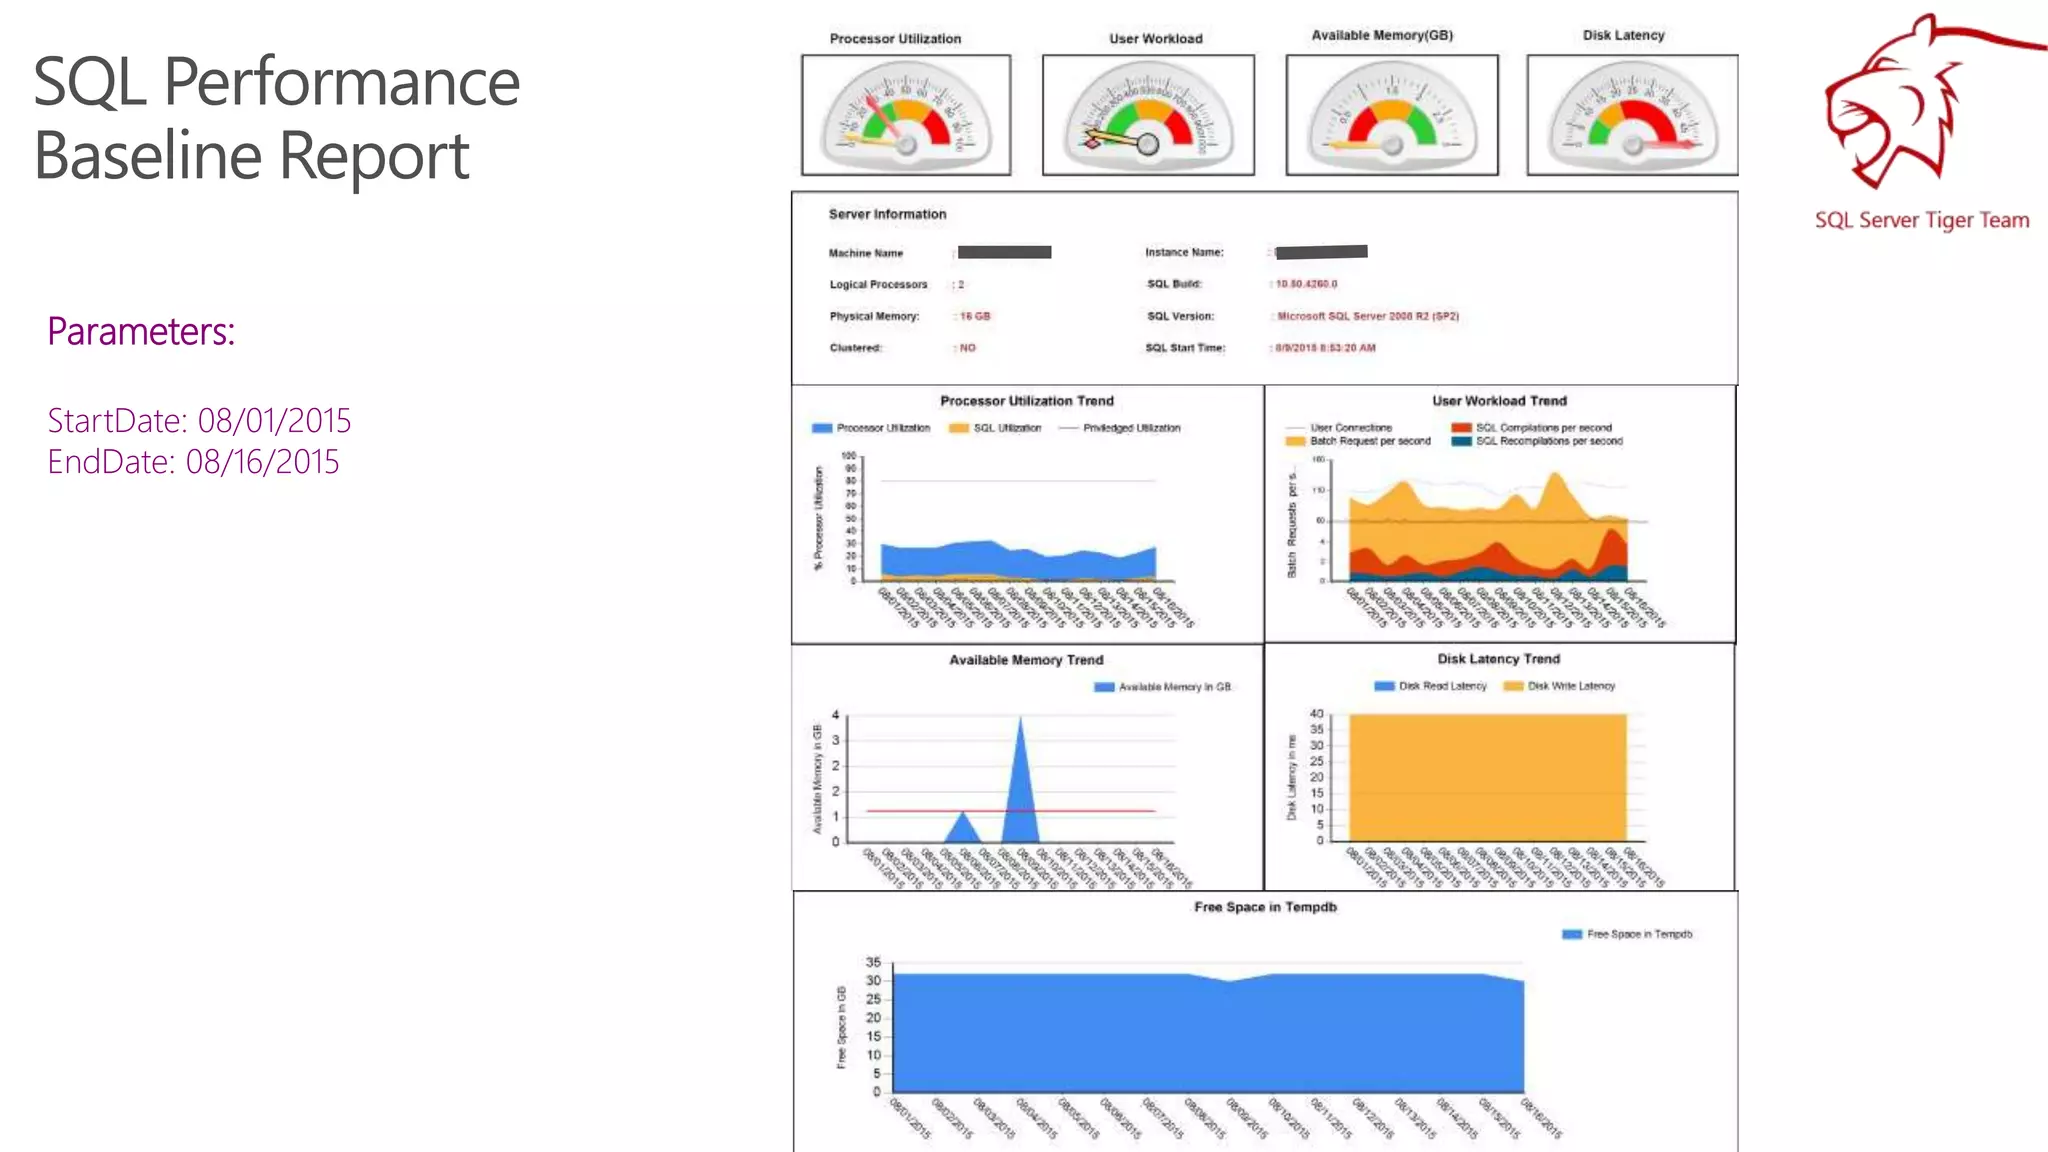
SQL Performance
Baseline Report
Parameters:
StartDate: 08/01/2015
EndDate: 08/16/2015
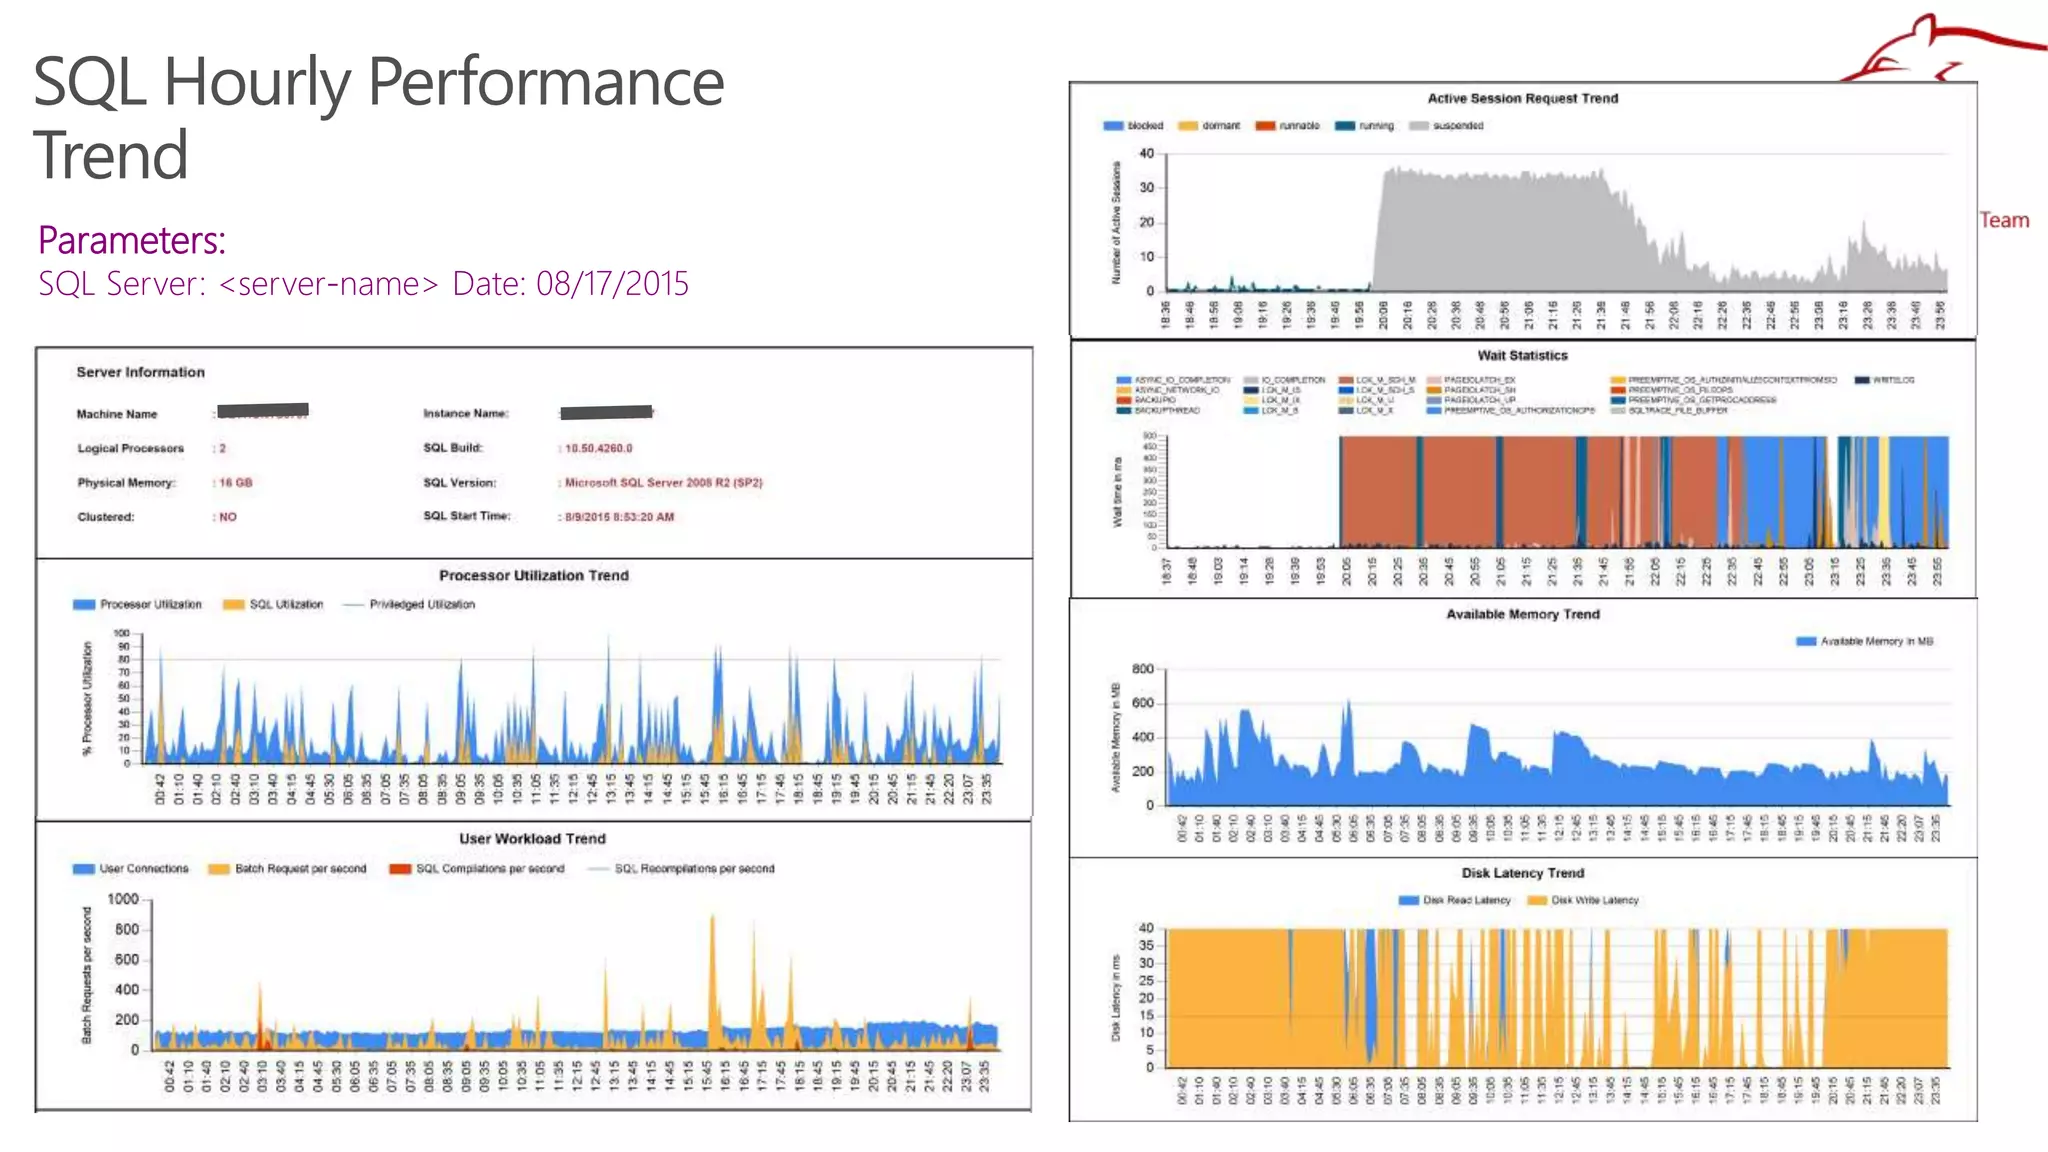
SQL Hourly Performance
Trend
Parameters:
SQL Server: <server-name> Date: 08/17/2015
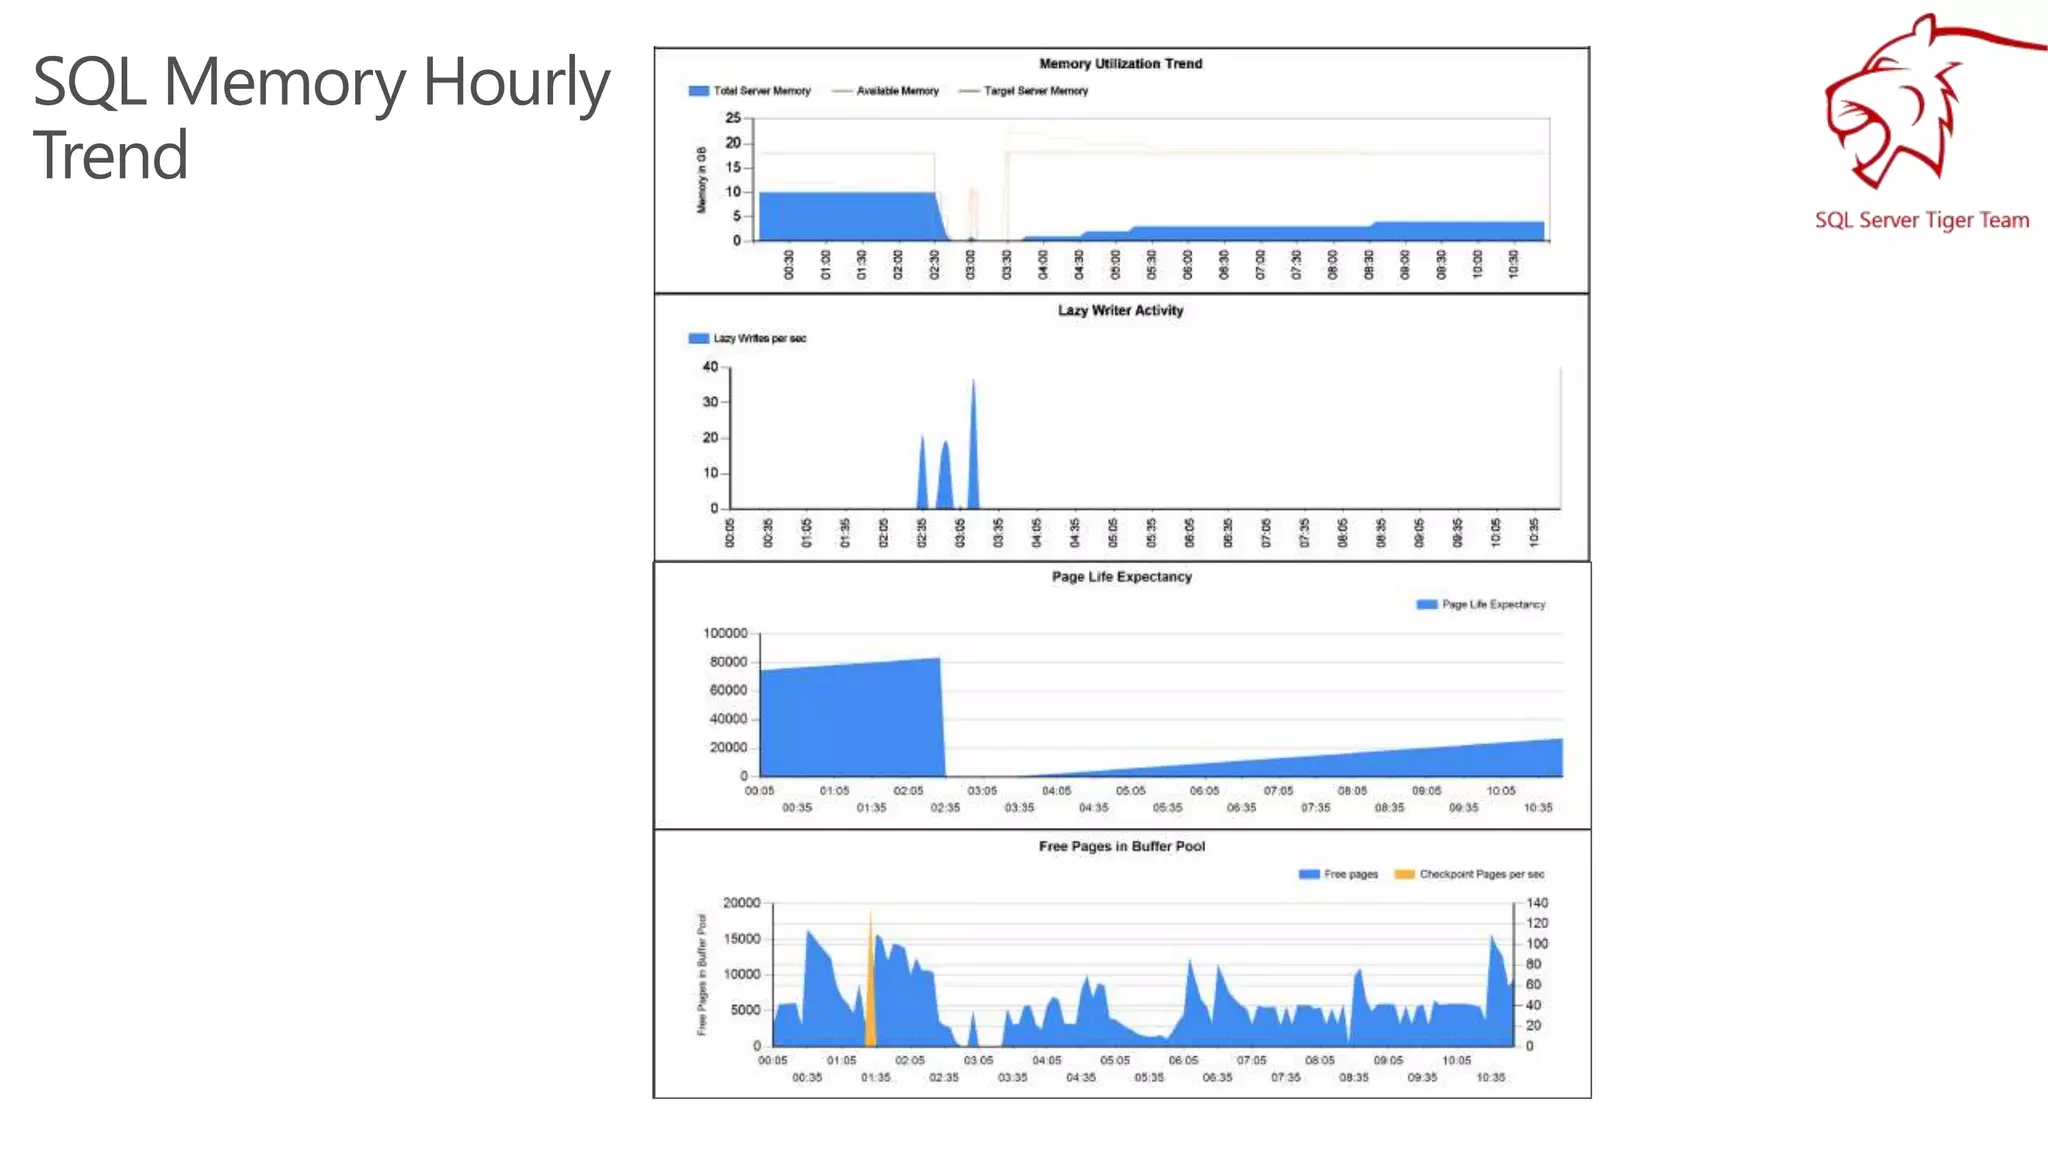
SQL Memory Hourly
Trend
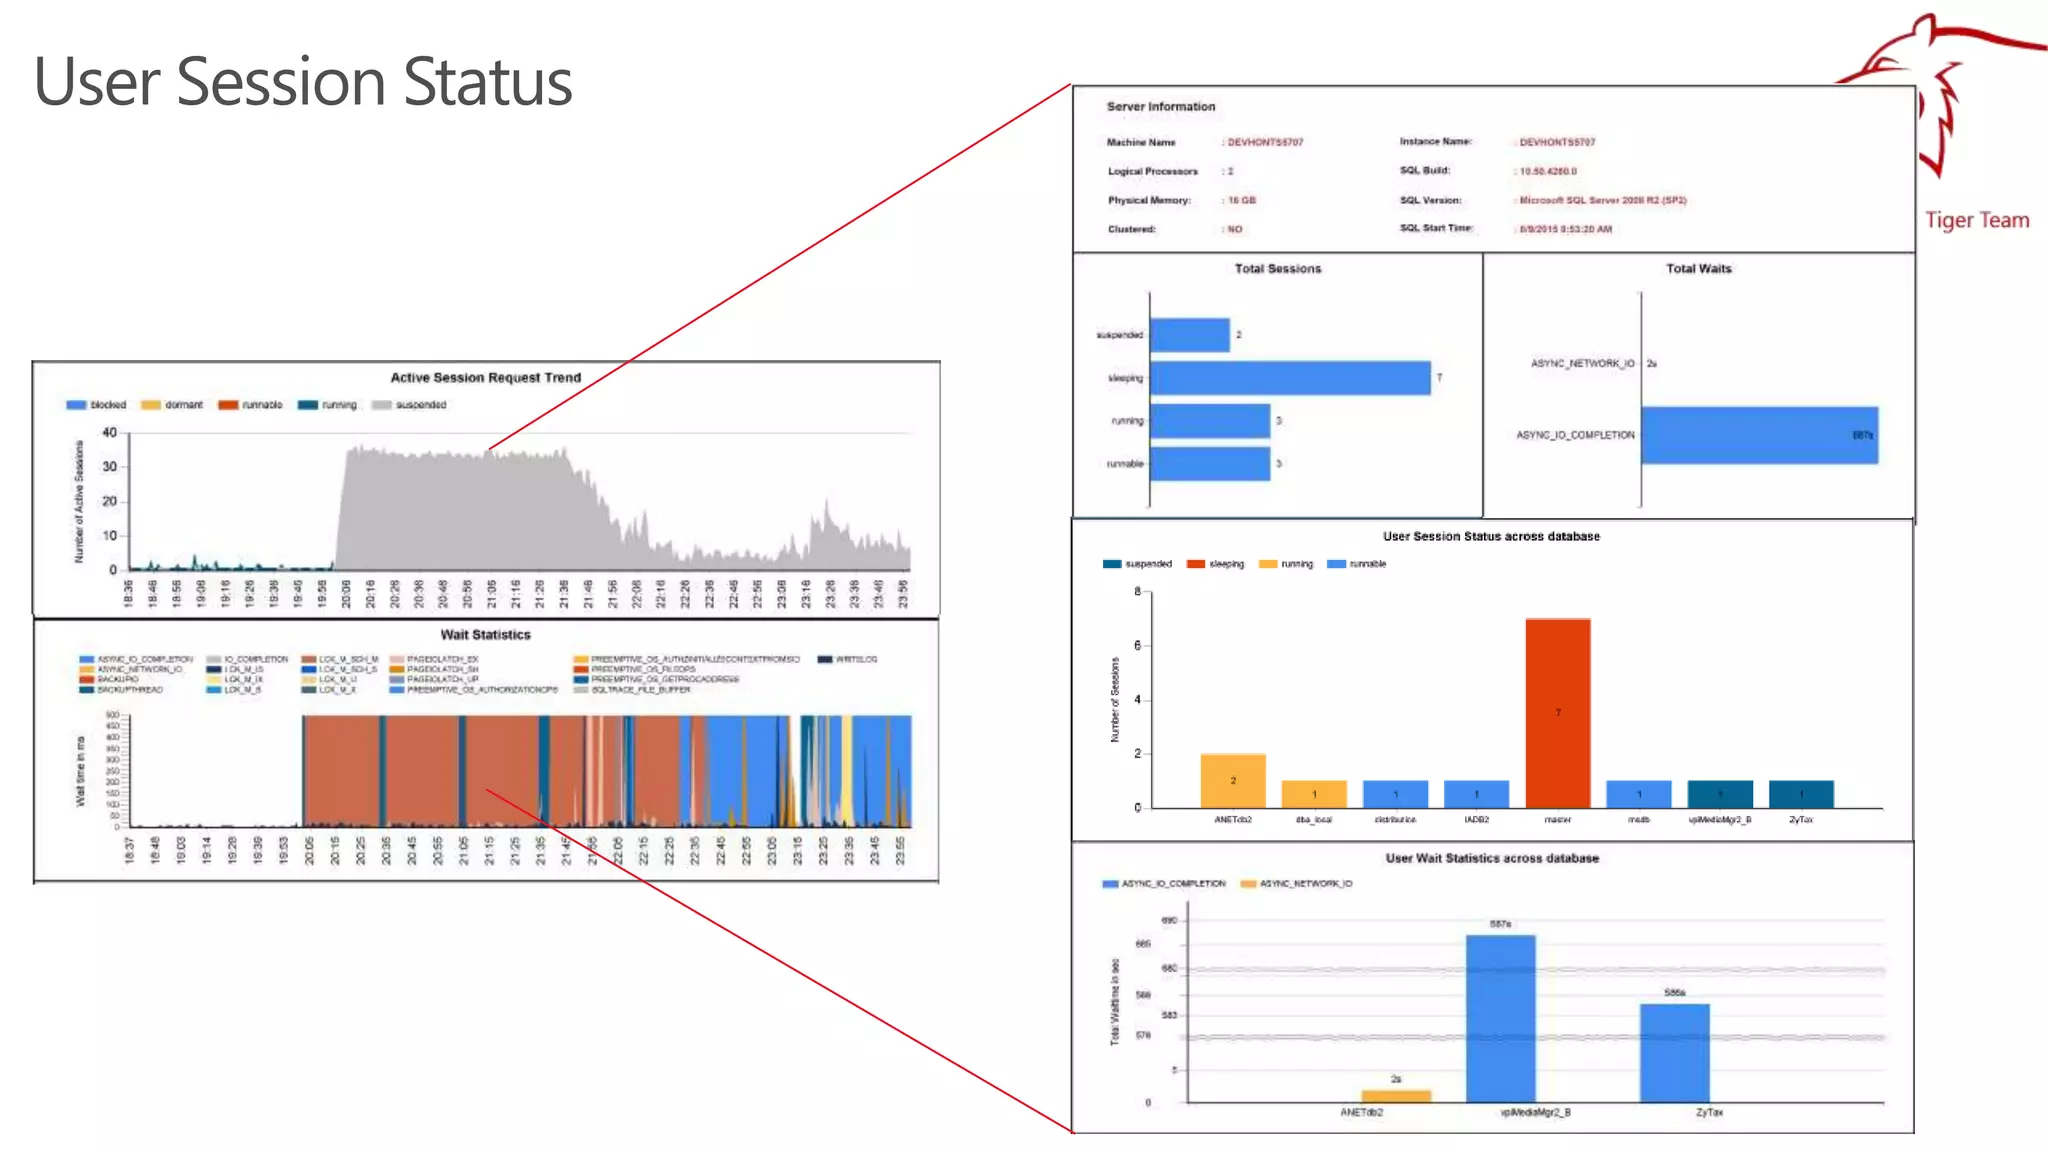
User Session Status
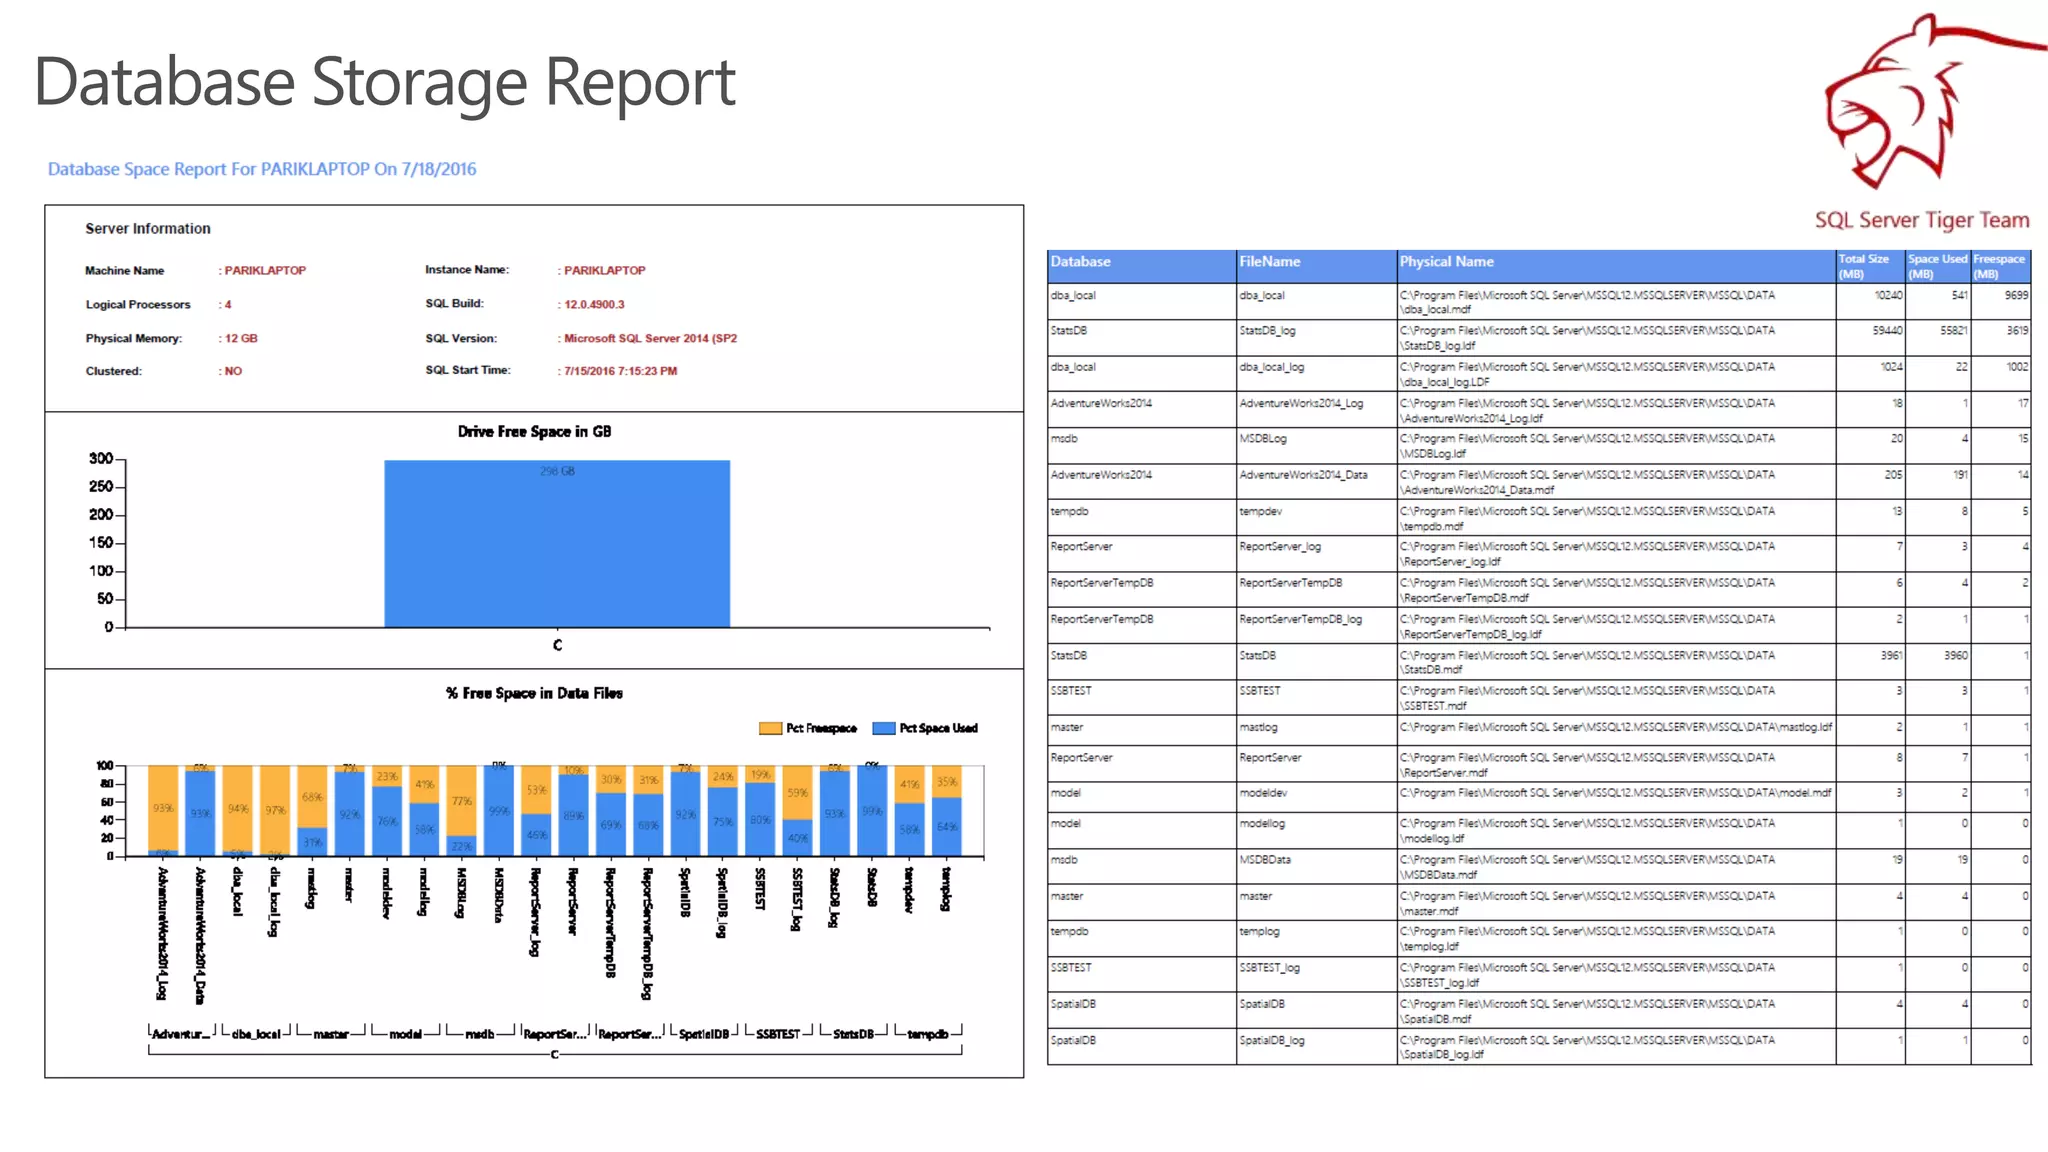
Database Storage Report
Database Index
Fragmentation Report
System Health Reports
PASS VC: SQL Server Performance Monitoring and Baselining

PASS VC: SQL Server Performance Monitoring and Baselining

  • 2.
    2 About Me Senior ProgramManager (SQL Tiger Team) 8 Years @talktosavjani http://www.sqlserverfaq.net https://blogs.msdn.microsoft.com/sql_server_team/ https://blogs.msdn.microsoft.com/sqlreleaseservices/ @mssqltiger
  • 3.
    Understand What SQLPerformance Baselining means and why is it required ? Understand the tools available for establishing a baseline in SQL Server and monitoring Learn how to use the performance baseline tools to understand and troubleshoot performance issues See an performance baselining and monitoring solution using SQL Server and SSRS
  • 5.
    • How slowis slow? • How fast is fast? Performance is relative • Identifying Hardware Reqs based on current workload and resource utilization Capacity Planning • Identifying the current workload, resource utilization Consolidation • Estimate VM Size/configuration • Estimate Cost VirtualizationMigration to Cloud (Azure)
  • 9.
    •Processor(*)% Processor Time •Process(sqlservr)%Processor Time •Processor(*)% Privileged Time •Process(sqlservr)% Privileged Time PROCESSOR •Available Mbytes •Memory Pages/sec •Process(sqlservr)Private Bytes •Process(sqlservr)Working Set •SQLServer: Memory Manager Total Server Memory •SQLServer: Memory Manager Target Server Memory Memory •PhysicalDisk(*)Avg. Disk sec/Read •PhysicalDisk(*)Avg. Disk sec/Write •PhysicalDisk Avg. Disk Queue Length •Disk Bytes/sec •Avg Disk Bytes/Transfer •Process(sqlservr)IO Data Operations/sec PHYSICAL DISK •Network InterfaceBytes Received/sec •Network InterfaceBytes Sent/sec •Network Interface(*)Output Queue Length Network IO
  • 10.
    • SQL Server:SQL Statistics Batch Requests/sec • SQL Server: SQL Statistics SQL Compilations/sec • SQL Server: SQL Statistics SQL Recompilations/sec • sys.dm_exec_requests • Sys.dm_exec_sessions • sys.dm_exec_connections SQL Workload • SQL Server: Wait Statistics • Sys.dm_os_waiting_tasks • Sys.dm_os_wait_stats SQL Waits • Sys.dm_db_index_physical_stats • Sys.dm_db_index_operational_stats • Sys.dm_db_index_usage_stats Database Index fragmentation
  • 11.
    • Max Workers •Workers Created • Idle Workers • Deadlocks Query Processing Health • Latch Waits > 15 sec • Locks > 30 sec • IO Latch Timeouts • Long IO Status Lock & Latch Waits • Deadlocked Scheduler • Non-Yielding Scheduler • Access Violations • OOM • Corrupt Pages Status Fatal Issues • API Name • Error Code Security Errors
  • 12.
    SQL Server TigerTeam • Data Collected in ring buffer target & *.xel files in Log Folder ( 4 Rollover Files of 5MB) • Increase System Health Xel File retention ALTER EVENT SESSION [system_health] ON SERVER STATE = STOP go ALTER EVENT SESSION [system_health] ON SERVER DROP TARGET package0.event_file ALTER EVENT SESSION [system_health] ON SERVER ADD TARGET package0.event_file (SET filename=N'system_health.xel' ,max_file_size=(25), max_rollover_files=(5)) GO ALTER EVENT SESSION [system_health] ON SERVER STATE = START go 12
  • 15.
    Architecture Monitoring Server SQL1 SQL2 SQL3SQLN SQL Servers in the Environment db2 db1 dba_local db2 db1 dba_local db2 db1 dba_local db2 db1 dba_local Central Monitoring Server SSRS Portal SQL Server Version, Configuration, OS information, Database Properties, Size, DataFile File Size, Storage, Backup Information SQL Server Resource Utilization, Performance Data, Wait statistics
  • 17.
  • 18.
    SQL Hourly Performance Trend Parameters: SQLServer: <server-name> Date: 08/17/2015
  • 19.
  • 20.
  • 21.
  • 22.
  • 23.

Editor's Notes

  • #10 http://www.sqlserverfaq.net/2011/01/31/what-perfmon-counters-should-i-monitor-and-what-each-of-them-mean/