PLANTTAXONOMY
NUMERICAL TAXONOMY &
BIOMETRICS
WELCOME TO THIS DOMAIN
Biometrics, Numerical Taxonomy and
Cladistics, Characters; Variations; OTUs,
Character Weighting and Coding; Cluster
Analysis; Phenograms, Cladograms – A Bird’s
eye View of the issue
A Presentation By
Dr. N. Sannigrahi, Associate Professor,
Department of Botany,
Nistarini College, Purulia,
D.B. Road, Purulia (W.B) India 723101
BIOMETRICS
 Increasingly, quantitative approaches to plant morphology are
changing the landscape of research for plant ecology, physiology, and
evolution. Advances in microscopy, imaging, and computational
analyses potentially allow more detailed investigations than have
previously been possible. This has increased the variety and quantity
of data available for phenotypic analysis, and is stimulating new
directions and applications in the study of plant morphology. The
increased speed and detail that can be captured by these new
technologies also means that the information represented by shape
and form can potentially be as rich a bio informatics data source as
genetic data. The object of the science is to bring together plant
morphologists, systematists, and paleobotanists, alongside computer
scientists, applied mathematicians, and informaticians, who were
united in their interest in developing or applying novel biometric or
bio-informatics methods to the form and function of plants.
Biometrics thus an approach to pay light on the unit characters which
likely to be two states that can not be subdivided logically.
BIOMETRICS
 Verification systems either reject or accept the submitted claim of identity
by comparing it with the pre-stored biometrics of the same individual
while identification systems recognize an individual by searching the
matching queried biometric in the entire database. Biometric identification
is a pattern recognition based classification system that recognizes an
individual by determining its authenticity using a specific physiological or
behavioral characteristic. Biometric authentication systems generally use a
pattern recognition approach that verifies or identifies an individual’s
authenticity of its uniquely identifiable physiological or behavioral
characteristic, which is called a biometric.
 There are two methods used to establishing the relationships between the
organisms- Phenetic method & Phylogenetic or Cladistics method.
 PHENETIC- Here overall similarity of taxa based on the overall
similarity of taxa regardless whether their similarities are
symplesiomorphies ( Shared primitive characters) or Synapomorphies (
shared derived characters) in a pohylogenetic sense.
 CLADISTIC-Strictly phylogenetic and only synapomorphies are used to
assess the phylogenetic relationship while shared symplesiomorphies have
no use. A phylogenetic tree or Cladogram is developed and the approach is
called Cladistics.
NUMERICAL TAXONOMY
 Numerical taxonomy or taximetrics, nowadays frequently and perhaps
more appropriately referred to as phenetics, refers to the application of
various mathematical procedures to numerically encoded character
state data for organisms under study.
 Thus, it is the analysis of various types of taxonomic data by
mathematical or computerized methods and numerical evaluation of
the similarities or affinities between taxonomic units, which are then
arranged into taxa on the basis of their affinities.
 According to Heywood the numerical taxonomy may be defined as the
numerical evaluation of the similarity between groups of organisms
and the ordering of these groups into higher ranking taxa on the basis
of these similarities.
 Numerical taxonomy involves two aspects-
 i. Construction of taxonomic groups by involving the larger number of
characters and the resemblance on the basis of cluster analysis ,
 Ii. Discrimination of the taxonomic groups to show the overlapping of
characters and the discrimination is used to select them.
WHAT IS NUMERICAL TAXONOMY?
 The period from 1957 to 1961 saw the development of first methods and
of theory of numerical taxonomy. Plants as we all know are classified
based on their characters. It was Michel Adanson, a French botanist, who
for the first time put forward a plan for assigning numerical values to the
similarity between organisms and proposed that equal weightage should
be given to all the characters while classifying plants.
 He used as many characters as possible for the classification, and such
classifications came to be known as Adansonian classifications.
Numerical taxonomy was however largely developed and popularized by
Sneath and Sokal.
 The application of Adansonian principles and use of modern methods and
electronic data-processing techniques, have helped in the evolution of
several new classifications of plants during the past few decades.
 Phylogenetic conclusions can be drawn from the taxonomic structure of a
group and from character correlations assuming some evolutionary
mechanisms and pathways.
 The science of taxonomy is viewed and practiced as an empirical science
PRINCIPLES OF NUMERICAL TAXONOMY
 PRINCIPLES:
 i. The more the selection of characters, the more the clarity & authentic
the classification,
 ii. Every Characters should be given equal weightage,
 iii.The entire classification basically should be done on their basis of
phenetic approach.
 (a) Construction of Taxonomic Groups:
 i. Any sample, item, individual is selected to analyze OUT which is the
basic unit of Numerical Taxonomy
 ii. In numerical taxonomy, first, individuals are selected and their
characters spotted out. There is no limitation to the number of characters
to be considered. However, the larger the number of characters, better is
the approach for generalization of the taxa.
 ii. The resemblances among the individuals are then established on the
basis of character analysis, which can often be worked out with the help
of computers, the accuracy of which depends on the appropriateness in
character. The best way to delimitate taxa is, to utilize maximum number
of characters, with similar weightage given to all of them.
PRINCIPLES OF NUMERICAL TAXONOMY
 (b) Discrimination of the Taxonomic Groups:
 When the taxonomic groups chosen for the study show overlapping of
characters, discrimination should be used to select them.
Discrimination analysis can be done by various techniques, specially
devised for such purposes. Numerical taxonomy is thus, based on
certain principles, also called neo Adansonian principles.
 Principles of numerical taxonomy have been enumerated by
Sneath and Sokal:
 (i) The greater the content of information in the taxa, and more the
characters taken into consideration, the better a given classification
system will be.
 (ii) Every character should be given equal weightage in creating new
taxa.
 (iii) The overall similarity between any two entities is a function of
the individual similarities in each of the many characters, which are
considered for comparison.
PRINCIPLES OF NUMERICAL TAXONOMY
 (iv) Correlation of characters differ in the groups of organisms under
study. Thus distinct taxa can be recognized.
 (v) Phylogenetic conclusions can be drawn from the taxonomic structure
of a group and from character correlations, assuming some evolutionary
mechanisms and pathways.
 (vi) The science of taxonomy is viewed and practiced as an empirical
science.
 (vii) Phenetic similarity is the base of classifications.
 SLECTION OF CHARACTERS:
 The unit characters may be two or more states depending upon the nature
of the characters taken into account successive weightage should be
employed for homoplasy which arte basically unique in all respect.
 A. Binary Characters: This characters basically denote only two states-
present or absent denoted by +/- or 1 /0, if missing denoted with NC
 B. Multistate Characters: More different states of characters are explored
either qualitative or quantitative. It is denoted with 0,1,2,3,4,5,6,7 etc .
For example color of the flower to be denoted by different assigned
values for each color.
PRINCIPLES OF NUMERICAL TAXONOMY
 RULES:
 There are number of rules are followed in this regard as stated below.
 i. The characters must to be chosen almost all parts of the organism
irrespective of the occurrence,
 Ii. Not less than 50 characters are to be considered in this analysis,
 The characters must comprise almost all the stages of the life cycle of
the plants,
 Attention to be given in all the respects with special reference to
morphology, physiology, ecology etc.
 CHARACTERS WEIGHTING:
 1. Equal weightage – All the characters should be given equal weightage
as the numerical taxonomy deserves equal importance of all the
measurable units,
 Ii. Successive Weightage- Homoplasy characters which are unique in
real sense like thorns, spines etc should be given more weightage for
consideration
CLUSTER ANALYSIS
 It is a statistical tool in which more similar elements are placed in one
group rather different from objects belonging to other groups used for
the exploratory data analysis. Here, mostly computer driven software
sort out the OTUs according to their overall similarity and produces a
phenogram , a kind of dendogram which shows the taxonomic
relationship between the two organisms.
 It can be done by two categories methods-
 A. Hierarchical cluster analysis method- two types. Agglomerative and
divisive method. In the agglomerative method, all objects start in
separate clusters till slowly the similar objects are combined and the
optimum number is chosen from among all options.
 In divisive method, all objects start in the same cluster and it is reverse
of agglomerative method
 B. Non- hierarchical cluster analysis method.
CLUSTERING METHODS
 Clustering can be done by two methods-
 Monolethic system- this system employs the attributes one at a time.
This method leads to the artificial clustering.
 Considering all their attributes simultaneously, this method gives a
natural grouping. One cluster group is separated from the other by
dividing line which indicates a distinct gap between the two.
 Phenetic Clustering methods:
 It is mostly phenetic approaches and is now rarely employed in
taxonomy as they often lead to substantially different clusters when
applied to real data. The following method is mostly used in this case.
 Nearest neighbor clustering method: It is called a single linkage
clustering . Here phenograms are constructed by joining OTUs and
groups on the basis of their similar members i.e almost shortest
distance. Whether an OUT will join an existing cluster depends on its
maximum similarity ( or minimum distance from) any member of that
cluster. A Phenogram is initiated by joining the two most similar OTUs.
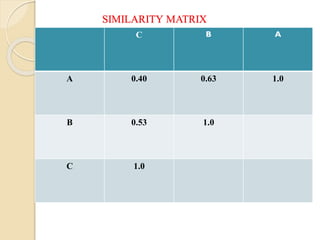
The following example can impregnate the concept.
SIMILARITY MATRIX
C B A
A 0.40 0.63 1.0
B 0.53 1.0
C 1.0
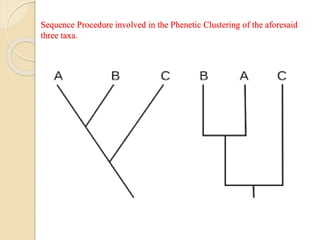
Sequence Procedure involved in the Phenetic Clustering of the
aforesaid three taxa:
STEP ACTION RESULT ACTION TREE
1. Find greatest
similarity less
than unity
0.63( A-B) Join A to B at
level 0.63
See on the
next page
2. Find the next
highest
similarity
0.53 ( B-C) Join C to
A+B Cluster
at level 0.53
See on the
next page
Sequence Procedure involved in the Phenetic Clustering of the aforesaid
three taxa.
I- Cladograms, II- Phylogram, III- Dendrogram
ADVANTAGES
 a. The data of conventional taxonomy is improved by numerical
taxonomy as it utilizes better and more number of described
characters. The data are collected from a variety of sources, such as
morphology, chemistry, physiology, etc.
 b. As numerical methods are more sensitive in delimiting taxa, the
data obtained can be efficiently used in the construction of better keys
and classification systems, creation of maps, descriptions, catalogues,
etc. with the help of electronic data processing systems. Numerical
taxonomy has in fact suggested several fundamental changes in the
conventional classification systems. c. The number of existing
biological concepts have been reinterpreted in the light of numerical
taxonomy.
 C.
 d. Numerical taxonomy allows more taxonomic work to be done by
less highly skilled workers.
DISADVANTAGES
 a. The numerical methods are useful in phenetic classifications
and not phylogenetic classifications.
 b. The proponents of “biological” species concept, may not
accept the specific limits bound by these methods.
 c. Character selection is the greatest disadvantage in this
approach. If characters chosen for comparison are inadequate,
the statistical methods may give less satisfactory solution.
 d. According to Steam, different taxonometric procedures may
yield different results. A major difficulty is to choose a
procedure for the purpose and the number of characters needed
in order to obtain satisfactory results by these mechanical aids.
It is necessary to ascertain whether a large number of
characters would really give satisfactory results than those
using a smaller number.
APPLICATIONS OF NT
 a. Study of similarities and differences in bacteria, other micro-
organisms and several animal groups.
 b. Delimitation of several angiospermic genera like Oryza,
Sarcostemma Solarium, and other groups including Farinosae of
Engler and a few others.
 c. In the study of several other angiosperm genera including
Apocynum, Chenopodium, Crotalaria, Cucurbita, Oenothera, Salix,
Zinnia, wheat cultivars, Maize cultivars, etc.
 d. Phyto-chemical data from seed protein and mitochondrial DNA
RELP studies has been numerically analyzed by Mondal et al. to study
the inter-specific variations among eight species of cassia L .Based on
the results of electrophoresis patterns, the degree of pairing affinity
(PA) or similarity index was calculated by the following formula,
according to the method of Sokal & Sneth and Romero Lopes et al.:
PHENOGRAM
 Phenograms a type of dendrogram which is based on phenetic data .
Lines called phenon lines, drawn at right angles to the dichotomously
branching dendrogram, represent lines of percentage similarity of
phenetic features between organisms. A Phenogram is mainly built up
on the data of the numerical analysis of phenetic data. During the
construction of diagram, results of large number of characters data from
all available field are taken. It includes calculating the similarity
between taxa and constructing a diagram through cluster analysis.
Phenogram is very useful as it involves a large number of characters.
Further, hierarchical classification can be achieved by deciding upon
the similarity between taxa assigned to various rank.
PHENOGRAM
CLADOGRAM
A Cladogram is a diagram used in cladistics to show relationships
among organisms. A cladogram is not, however, an evolutionary tree
because it does not show how ancestors are related to the descendents,
nor does it show how much they have changed; many evolutionary
trees can be inferred from a single cladogram. A Cladogram uses lines
that branch off in different directions ending at clade, a group of
organisms derived from a last common ancestor. There are many shapes
of cladograms but all have lines that branch off from others. The lines
can be traced back to where they branch off. These branching point
represents a hypothetical ancestor which can be inferred to exhibit the
traits shared among the terminal taxa above it. The hypothetical
ancestor might then provide clues about the order of evolution of
various features, adaptation and other evolutionary narratives about the
ancestor. Primarily, the morphological data are mostly used but with the
passage of time, DNA, RNA sequencing data are now commonly used
in the generation of cladogram in addition to the conventional data.
CLADOGRAM
DIFFERENCE BETWEEN CLADISTICS & PHENETICS
Cladistics Phenetics
It is the method of the classifying
organisms on the basis of their
ancestry & evolutionary relationships.
It is the method of the classifying
organisms based on the structural &
morphological characters that are
observable.
Mostly evolutionary relationships,
genetic similarity & ancestry related
characters are taken into account
Structure , morphology and ecological
characters are taken into account .
Cladograms of phylogenetic tree is
considered to describe relationship.
Phenograms are used to describe
relationship
High accuracy & high reproducibility Low accuracy & low reproducibility.
Taxa may be grouped together by
shared group character states
(Synapomorphies) Only
Taxa may be grouped together by
shared ancestral features
(Symplesiomorphies) as well shared
derived character states (
Synapomorphies)
HOPE, YOU HAVE
ENJOYED THE JOURNEY
THANKYOUTO EXPLORE
THE ROAD
ACKNOWLEDGEMENT
 Google for images
 College Botany- B.P. Pandey
 Advanced Plant Taxonomy by A. K. Mondal
 A Text book of Botany- Hait, Bhattacharya & Ghosh
 Plant Taxonomy –O. P. Sharma
 Text Book of Plant Systematics- Chittaranjan Mohanty
 Taxonomy of Vascular plants- H. G. Lawrence.
 Disclaimer:
 This presentation has been developed for the enrichment of online
learning without any financial interest. The author is grateful for all for
having the pleasure of uses of the content used in this presentation.