Novel pyrimidine derivatives as potent BUB1B inhibitors for clear cell renal
cell carcinoma: From synthesis and characterization to docking insights and
therapeutic validation
Negar Parvizi a,1
, Mohamed El Hafi a,b,1
, Melek Hajji c,1
, Younos Bouzian a,1
, Woonghee Kim d,1
,
Mine Subaşioğlu a
, Mehmet Ozcan e,1
, Hanan Al-Ghulikah f
, Hasan Turkez h
,
Adil Mardinoglu d,j,*
a
Trustlife Labs Drug Research & Development Center, 34774, Istanbul, Türkiye
b
Faculty of Medicine and Pharmacy, Mohammed First University, Oujda, Morocco
c
Computational Chemistry Research Unit (CCRU), Sirte Gulf International University, Sirte, Libya
d
Science for Life Laboratory, KTH – Royal Institute of Technology, Stockholm, SE, 17165, Sweden
e
Department of Medical Biochemistry, Faculty of Medicine, Zonguldak Bulent Ecevit University, Zonguldak, Türkiye
f
Department of Chemistry, College of Science, Princess Nourah bint Abdulrahman University, P.O. Box 84428, Riyadh 11671, Saudi Arabia
h
Department of Medical Biology, Faculty of Medicine, Atatürk University, Erzurum, Türkiye
j
Centre for Host-Microbiome Interactions, Faculty of Dentistry, Oral & Craniofacial Sciences, King’s College London, London, SE1 9RT, UK
A R T I C L E I N F O
Keywords:
Pyrimidine derivatives
BUB1B inhibitors
Clear cell renal cell carcinoma
Density functional theory
Molecular docking and dynamics
A B S T R A C T
Clear cell Renal Cell Carcinoma (ccRCC) is the most common subtype of renal malignancy and remains a major
clinical challenge. This challenge underscores the urgent need to identify novel molecules with potential as
therapeutic targets in ccRCC. Therefore, in this study, four novel pyrimidine-based derivatives of TG-101,209
(3a-d) were designed and synthesized as potential inhibitors of BUB1B (Budding Uninhibited by Benzimid­
azoles 1 Mitotic Checkpoint Serine/Threonine Kinase B), a mitotic checkpoint kinase involved in ccRCC path­
ogenesis. Complete structural characterization of all synthesized compounds was achieved using Fourier-
transform infrared (FT-IR) spectroscopy, nuclear magnetic resonance (1
H and 13
C NMR), and mass spectrom­
etry (MS). The crystalline architecture and intermolecular interactions of compound 3a were further elucidated
by single-crystal X-ray diffraction. Theoretical computations were performed using Density Functional Theory
(DFT) at the B3LYP/6–311++G(d,p) level of theory to investigate the electronic and structural properties of the
most active compound. The computed IR spectrum of compound 3a showed excellent agreement with experi­
mental data, supporting the structural findings from X-ray analysis. Hirshfeld surfaces (HS) analyses were carried
out to visualize the intermolecular interactions in the crystal packing of 3a. This analysis highlighted key
N—H⋅⋅⋅O and N—H⋅⋅⋅N hydrogen bonds, which were found to be in excellent agreement with the experimental
single-crystal X-ray diffraction data. Multiple noncovalent interactions (N–H⋅⋅⋅O/N, C–H⋅⋅⋅O, C–H⋅⋅⋅π) were
identified in the solid state and quantitatively examined using Independent Gradient Model based on Hirshfeld
partition (IGMH) analysis, confirming N–H⋅⋅⋅N as the strongest interaction. In vitro cytotoxicity assays on Caki-1
cells revealed that compounds 3a, 3c, and 3d exerted significant antiproliferative effects. Compound 3a
exhibited superior BUB1B inhibition compared to the other derivatives, eliciting a robust apoptotic response as
evidenced by enhanced PARP cleavage and caspase activation. Molecular docking and dynamics studies revealed
stable and favorable binding affinity of the compound 3a within the BUB1B active site, consistent with exper­
imental observations. The combined experimental and computational findings indicate that these pyrimidine
derivatives, particularly compound 3a, act as promising BUB1B inhibitors with potential therapeutic relevance in
ccRCC therapy.
* Corresponding author to: Science for Life Laboratory, KTH – Royal Institute of Technology, Stockholm, SE, 17165, Sweden.
E-mail address: adilm@scilifelab.se (A. Mardinoglu).
1
These authors contributed equally to this work.
Contents lists available at ScienceDirect
Journal of Molecular Structure
journal homepage: www.elsevier.com/locate/molstr
https://doi.org/10.1016/j.molstruc.2026.146659
Received 24 December 2025; Received in revised form 20 April 2026; Accepted 23 May 2026
Journal of Molecular Structure 1374 (2026) 146659
Available online 26 May 2026
0022-2860/© 2026 The Author(s). Published by Elsevier B.V. This is an open access article under the CC BY license (http://creativecommons.org/licenses/by/4.0/).
1. Introduction
Cancer is fundamentally characterized by uncontrolled cell prolif­
eration, genomic instability, and the evasion of programmed cell death.
Despite remarkable advances in cancer biology, many solid tumors
remain difficult to treat due to their heterogeneity and adaptive resis­
tance mechanisms. Among these, clear cell Renal Cell Carcinoma
(ccRCC) represents a highly aggressive and treatment-resistant malig­
nancy. Renal cell carcinoma (RCC) accounts for nearly 90% of kidney
cancers and approximately 4% of all adult malignancies [1]. The clear
cell subtype (ccRCC) constitutes 70–75% of all RCC cases [2]. Because
ccRCC is often asymptomatic in its early stages, over 30% of patients
present with metastatic disease at diagnosis, precluding surgical inter­
vention. Despite surgical tumor resection, recurrence occurs in nearly
40% of patients, and the 5-year overall survival remains <10% [3,4].
These statistics highlight the urgent need for new therapeutic strategies
and a deeper molecular understanding of ccRCC pathogenesis [5].
Current therapeutic strategies for ccRCC combine immune checkpoint
inhibitors and targeted therapies, improving patient outcomes but often
leading to the emergence of drug resistance that limits long-term clinical
benefits. Identifying new molecular targets and designing selective in­
hibitors remain essential for developing more durable treatment
options.
Computational drug repositioning based on systems biology ap­
proaches have a pivotal role in helping to identify potential interactions
between drugs, their targets and even and the link between drugs and
diseases [6,7]. Since pharmacology and safety of the repositioned drugs
have been well-characterized, it can reduce costs and speed up the
development of effective therapies [8,9]. In our previous research that
was performed in our group, we utilized co-expression network analysis
of transcriptomics profiles of ccRCC patients to identify high-priority
hub genes, which resulted in four key genes—BUB1B (BUB1 mitotic
checkpoint serine/threonine kinase B), RRM2 (Ribonucleotide Reduc­
tase Regulatory Subunit M2), ASF1B (Anti-Silencing Function 1B His­
tone Chaperone), and CCNB2 (Cyclin B2)— that controlled the ccRCC
development were associated with the cell cycle dysfunctions. Further,
TG-101,209 was identified as a drug candidate to regulate BUB1B
expression through drug repositioning. Finally, experimental validation
in the Caki-1 cell line confirmed that TG-101,209 effectively down­
regulates BUB1B protein levels and suppresses cell viability, under­
scoring its potential as a targeted therapeutic scaffold for ccRCC
management [10].
Pyrimidine, a six-membered aromatic heterocycle with nitrogen
atoms at positions 1 and 3, is a key structural motif in numerous bio­
logically active compounds. Its hydrogen-bonding capability, π–π
stacking, and electronic versatility confer broad pharmacological utility
across diverse therapeutic areas. Clinically approved pyrimidine-based
drugs, including 5-fluorouracil, zidovudine, and imatinib, exemplify
the scaffold’s potential in oncology, antiviral, and anti-inflammatory
applications [11,12]. Continued development of pyrimidine de­
rivatives and fused heterocycles has enabled the design of molecules
with improved selectivity and multi-target interactions [13,14].
Developing novel therapeutics is a complex, multi-stage endeavour
necessitating the precise design and chemical synthesis of candidates
with superior potency and clinical efficacy. Our previous works identi­
fied TG-101,209 as a potential BUB1B inhibitor for ccRCC therapy;
however, structural modifications are necessary to enhance its binding
affinity for the BUB1B and to more effectively promote apoptosis. In
continuation of our efforts to identify effective ccRCC therapeutics, the
present study describes the development and characterization of novel
inhibitors targeting the BUB1B kinase domain [15,16]. This study aimed
to design and evaluate novel TG-101,209 derivatives as modulators of
BUB1B activity. To this end, four derivatives were synthesized by
modifying specific position on the TG-101,209 scaffold, focusing on
enhancing binding efficacy, BUB1B inhibition, and the induction of
apoptosis in Caki-1 cells. These compounds were characterized using an
array of experimental and spectroscopic techniques. Furthermore,
Structure-Activity Relationship (SAR) analysis, molecular docking, and
Molecular Dynamics (MD) simulations were employed to gain a deeper
understanding of how the chemical architecture influences biological
performance. Such an integrated methodology facilitates the identifi­
cation of critical functional groups that augment potency, ultimately
supporting the rational design of more effective therapeutic agents.
2. Experimental section
2.1. General information
All reagents were purchased from commercial suppliers and used
without further purification. Reactions were monitored by LC–MS
(Thermo Fisher TSQ Series, Athena C18-WP, 100 Å, 2.1 × 50 mm, 3 μm;
water: methanol with 0.01% formic acid) or by thin-layer chromatog­
raphy (TLC). TLC analyses were performed using silica gel pre-coated
aluminum plates (Kieselgel 60, F254, E. Merck, Germany). High-
resolution mass spectra (HRMS) were obtained using a Thermo Fisher
Dionex Ultimate 3000 UHPLC System (Thermo Scientific). Chromato­
grams were visualized under ultraviolet light at 254 and 366 nm. 1
H
NMR spectra were recorded on a Bruker Avance 500 MHz spectrometer
in DMSO‑d₆. 13
C NMR spectra were recorded on a Bruker spectrometer
at 126 MHz in deuterated solvents, with the central peak of the solvent
used as the internal standard. Chemical shifts (δ) are reported in parts
per million (ppm) relative to tetramethylsilane (TMS). The following
abbreviations are used to describe signal multiplicities: s (singlet),
d (doublet), t (triplet), q (quartet), qt (quintuplet), and m (multiplet).
Coupling constants (J) are reported in Hertz (Hz). Flash column chro­
matography was performed on a PuriFlash XS 520 Plus system (Inter­
chim) equipped with a built-in UV detector, ELSD detector, and fraction
collector, using Interchim silica gel columns. The IR spectrum of com­
pound 3a was recorded using the diffuse reflectance technique. The
crystal was finely ground, mixed with KBr, and analyzed at room tem­
perature over the 4000–400 cm⁻¹ range using a PerkinElmer Frontier FT-
IR spectrometer. The resulting experimental spectrum was employed for
comparison with the theoretically calculated IR frequencies in order to
support the vibrational assignments and validate the optimized molec­
ular structure.
2.2. Synthesis
2.2.1. N-cyclobutyl-3-((5-methyl-2-((4-(4-methylpiperazin-1-yl)phenyl)
amino)pyrimidin-4-yl)amino)benzenesulfonamide (3a)
A mixture of intermediate 2 (0.12 g, 0.4 mmol), 3‑bromo-N-cyclo­
butylbenzenesulfonamide (0.14 g, 0.48 mmol), Pd2(dba)3 (0.035 g, 0.04
mmol), Xantphos (0.035 g, 0.06 mmol) and cesium carbonate (0.25 g,
0.8 mmol) was suspended in dioxane/DMF (3/1, 8 mL) and heated at
155 ◦
C under the nitrogen atmosphere for 18–24 h, after completion of
the reaction, the reaction mixture was cooled to room temperature and
diluted with DCM (10 mL). The mixture was filtered and the filtrate was
concentrated under vacuum. The residue was purified by column
chromatography (chloroform: methanol = 9: 1) to give the desired
compound 3a (80 mg, yield: 40%) as a light yellow solid. 1
H NMR (500
MHz, DMSO‑d6) δ 8.71 (s, 1H), 8.53 (s, 1H), 8.21 (d, J = 7.9 Hz, 1H),
7.98 – 7.93 (m, 2H), 7.89 (s, 1H), 7.49 – 7.43 (m, 4H), 6.79 (d, J = 9.0
Hz, 2H), 3.63 (m, 1H), 3.03 – 3.00 (m, 4H), 2.46 – 2.44 (m, 4H), 2.22 (s,
3H), 2.11 (s, 3H), 1.92 (m, 2H), 1.80 – 1.74 (m, 2H), 1.49 – 1.41 (m, 2H).
13
C NMR (126 MHz, DMSO‑d6) δ 158.93, 158.38, 156.23, 145.68,
141.67, 140.70, 133.29, 129.07, 125.29, 120.08, 120.01, 119.16,
115.96, 105.39, 54.74, 49.04, 47.61, 45.78, 30.62, 14.55, 13.51. MS
(ESI): m/z 508. 17 [M+H]+
. HRMS (ESI): calcd for C26H33N7O2S
[M+H]+
508.24892; found 508.24854.
N. Parvizi et al. Journal of Molecular Structure 1374 (2026) 146659
2
2.2.2. 5-methyl-N4
-(5-methyl-4-(4-(trifluoromethyl)phenyl)pyrimidin-2-
yl)-N2
-(4-(4-methylpiperazin-1-yl)phenyl)pyrimidine-2,4-diamine (3b)
A mixture of intermediate 2 (0.15 g, 0.48 mmol), 2‑chloro-5-methyl-
4-(4-(trifluoromethyl)phenyl)pyrimidine (0.12 g, 0.44 mmol),
Pd2(dba)3 (0.04 g, 0.048 mmol), Xantphos (0.08 g, 0.13 mmol) and
cesium carbonate (0.3 g, 0.9 mmol) was suspended in dioxane/DMF (3/
1, 5 mL) and heated at 155 ◦
C under the nitrogen atmosphere for 20 h,
after completion of the reaction, the reaction mixture was cooled to
room temperature and diluted with CHCl3 (15 mL). The mixture was
filtered and the filtrate was concentrated under vacuum. The residue
was purified by column chromatography (chloroform: methanol = 9: 1)
to give the desired compound 3b (35 mg, yield: 15%) as a yellow solid.
1
H NMR (500 MHz, DMSO‑d6) δ 9.33 (s, 1H), 8.86 (s, 1H), 8.63 (s, 1H),
8.04 (s, 1H), 7.93 (d, J = 8.2 Hz, 2H), 7.84 (d, J = 8.4 Hz, 2H), 7.50 (d, J
= 9.0 Hz, 2H), 6.48 (d, J = 8.9 Hz, 2H), 2.91 – 2.89 (m, 4H), 2.42 – 2.39
(m, 4H), 2.31 (s, 3H), 2.19 (s, 3H), 2.09 (s, 3H). 13
C NMR (126 MHz,
DMSO‑d6) δ 163.31, 160.51, 158.43, 158.38, 158.20, 157.99, 145.49,
141.83, 133.37, 130.00, 129.65, 129.39, 129.35, 127.46, 125.31,
125.28, 125.25, 125.22, 123.13, 121.27, 119.49, 115.85, 108.77, 54.78,
49.20, 45.88, 16.08, 13.78. MS (ESI): m/z 535. 26 [M+H]+
. HRMS (ESI):
calcd for C28H29F3N8 [M+H]+
535.25400; found 535.25366.
2.2.3. N-cyclopentyl-3-((5-methyl-2-((4-(4-methylpiperazin-1-yl)phenyl)
amino)pyrimidin-4-yl)amino)benzenesulfonamide (3c)
A mixture of intermediate 2 (0.15 g, 0.5 mmol), 3‑bromo-N-cyclo­
pentylbenzenesulfonamide (0.17 g, 0.55 mmol), Pd2(dba)3 (0.03 g,
0.035 mmol), Xantphos (0.04 g, 0.075 mmol) and cesium carbonate
(0.33 g, 1.0 mmol) was suspended in Dioxane/DMF (3/1, 8 mL) and
heated at 155 ◦
C under the nitrogen atmosphere for 20 h, after
completion of the reaction, the reaction mixture was cooled to room
temperature and diluted with DCM (15 mL). The mixture was filtered
and the filtrate was concentrated under vacuum. The residue was pu­
rified by column chromatography (chloroform: methanol = 9: 1) to give
the desired compound 3c (50 mg, yield: 19%) as a white solid. 1
H NMR
(500 MHz, DMSO‑d6) δ 8.73 (s, 1H), 8.54 (s, 1H), 8.04 (s, 1H), 7.89 (s,
1H), 7.66 (d, J = 7.0 Hz, 2H), 7.52 – 7.46 (m, 4H), 6.81 (d, J = 9.1 Hz,
2H) 3.44 – 3.40 (m, 1H), 3.03 – 3.01 (m, 4H), 2.46 – 2.44 (m, 4H), 2.22
(s, 3H), 2.11 (s, 3H), 1.63 – 1.60 (m, 2H), 1.54 – 1.53 (m, 2H), 1.37 –
1.33 (m, 4H). 13
C NMR (126 MHz, DMSO‑d6) δ 159.09, 158.53, 156.33,
145.84, 141.78, 140.86, 133.45, 129.24, 125.28, 120.23, 120.20,
119.36, 116.10, 105.57, 54.93, 54.65, 49.21, 45.97, 32.68, 23.01,
13.70. MS (ESI): m/z 522. 19 [M+H]+
. HRMS (ESI): calcd for
C27H35N7O2S [M+H]+
522.26457; found 522.26392.
2.2.4. 3-((5-methyl-2-((4-(4-methylpiperazin-1-yl)phenyl)amino)
pyrimidin-4-yl)amino)-N-phenylbenzenesulfonamide (3d)
A mixture of intermediate 2 (0.1 g, 0.3 mmol), 3‑bromo-N-phenyl­
benzenesulfonamide (0.11 g, 0.36 mmol), Pd2(dba)3 (0.02 g, 0.02
mmol), Xantphos (0.03 g, 0.045 mmol) and cesium carbonate (0.2 g, 0.6
mmol) was suspended in dioxane/DMF (3/1, 8 mL) and heated at 155 ◦
C
under the nitrogen atmosphere for 24 h, after completion of the reaction,
the reaction mixture was cooled to room temperature and diluted with
DCM (10 mL). The mixture was filtered and the filtrate was concentrated
under vacuum. The residue was purified by column chromatography
(chloroform: methanol = 9: 1) to give the desired compound 3d (55 mg,
yield: 30%) as a white solid. 1
H NMR (500 MHz, DMSO‑d6) δ 8.69 (s,
1H), 8.53 (s, 1H), 8.20–8.19 (m, 1H), 7.89 (s, 1H), 7.47–7.43 (m, 4H),
7.24 − 7.20 (m, 3H), 7.12–7.11 (m, 2H), 7.02 – 6.99 (m, 2H), 6.82–6.80
(m, 2H), 3.03 (m, 4H), 2.45 (m, 4H), 2.22 (s, 3H), 2.09 (s, 3H). 13
C NMR
(126 MHz, DMSO‑d6) δ 158.94, 158.50, 156.42, 145.90, 140.98,
139.92, 137.98, 133.33, 129.31, 125.69, 124.06, 120.32, 120.23,
120.02, 119.41, 116.09, 105.62, 54.92, 49.20, 45.98, 13.65. MS (ESI):
m/z 530. 23 [M+H]+
HRMS (ESI): calcd for C28H31N7O2S [M+H]+
530.23327; found 530.23260.
2.3. Biological assays
2.3.1. Cell culture, cell viability, and cytotoxicity assays
The human clear cell renal cell carcinoma (ccRCC) cell line Caki-1
was purchased from CLS Cell Lines Service (Germany). Cells were
cultured in McCoy’s 5A (Modified) medium (16,600,082, Thermo Fisher
Scientific, USA) supplemented with 10% fetal bovine serum (FBS,
F7524, Sigma-Aldrich) and 1% penicillin–streptomycin (P4333, Sigma-
Aldrich). MRC-5 human lung fibroblast cells were maintained in high-
glucose DMEM (D0822, Sigma-Aldrich) supplemented with 10% FBS
and 1% P/S. The tested compounds were initially dissolved in 100%
DMSO to prepare stock solutions and subsequently diluted in the culture
medium to the final working concentrations, ensuring that the final
DMSO concentration remained below 0.1% (v/v). During the incubation
period, no visible precipitation or degradation was observed in the assay
medium across the tested concentration range. For MTT and LDH assays,
2 × 10⁴ Caki-1 cells per well were seeded into 96-well plates in triplicate.
Cells were treated with serial concentrations (30, 10, 3, 1, 0.3, 0.1, and
0.03 µM) for 48 h. Cell viability was assessed using the MTT assay kit
(M6494, Thermo Fisher Scientific), while cytotoxicity was evaluated
with the LDH assay kit (ab65393, Abcam), following the manufacturers’
protocols. Absorbance was measured with a microplate reader (Hidex
Sense Meta Plus).
2.3.2. Western blot and CETSA analysis
To evaluate BUB1B protein expression, 4 × 10⁵ Caki-1 cells were
seeded in 6-well plates and treated with 10 µM of the compounds for 24
h. Protein lysates were prepared using CelLytic M (C2978, Sigma-
Aldrich). For CETSA experiments, 5 × 10⁵ Caki-1 cells were treated
with 20 µM of each compound for 1 h. After PBS washing, cells were
subjected to heat shock at 45 ◦
C for 3 min using a MultiTherm Shaker
(H5000-HC-E, Benchmark Scientific) at 300 rpm. Proteins were
extracted through three freeze–thaw cycles (liquid nitrogen and 25 ◦
C),
followed by centrifugation at 20,000 × g for 20 min at 4 ◦
C. SDS–PAGE
was performed using Mini-PROTEAN® TGX™ Precast Gels (4561,086,
Bio-Rad), and proteins were transferred onto 0.2 μm PVDF membranes
(1704,158, Bio-Rad) using a Trans-Blot® Turbo™ Transfer System (Bio-
Rad). Membranes were incubated overnight at 4 ◦
C with primary anti­
bodies: Anti-BUB1B (ab254326, Abcam), PARP (95,425, Cell Signaling),
active Caspase-9 (ab2324, Abcam), active Caspase-3 (ab32042, Abcam),
and GAPDH (ab8245, Abcam). After washing, membranes were incu­
bated with HRP-conjugated secondary antibodies (Goat anti-Rabbit IgG-
HRP, ab205718; Goat anti-Mouse IgG-HRP, ab6789; Abcam) for 1 h at 4
◦
C. Protein bands were visualized using an enhanced chem­
iluminescence substrate (WBLUF0500, Merck) and imaged with
ImageQuant™ LAS 500 (GE Healthcare).
2.3.3. Flow cytometry analysis of the cell cycle
Caki-1 cells (4 × 10⁵ per well) were treated with 10 µM of the
compounds for 48 h in 6-well plates. Cells were fixed with 70% ethanol,
stained with 10 µg/mL propidium iodide (PI), and analyzed using a BD
FACS Canto II flow cytometer (PE-A channel). A total of 20,000 cells per
sample were measured, and data were analyzed using BD FACSDiva 9.0
software.
2.3.4. BUB1B IC₅₀ enzymatic assay
The BUB1B kinase activity assay for IC₅₀ determination was per­
formed by Reaction Biology. Test compounds were prepared at ten
concentrations (100 µM, 30 µM, 10 µM, 3 µM, 1 µM, 300 nM, 100 nM, 30
nM, 10 nM, and 3 nM). Each reaction contained 25 µL of assay buffer (70
mM HEPES–NaOH, pH 7.5; 3 mM MgCl₂; 3 mM MnCl₂; 3 µM Na₃VO₄; 1.2
mM DTT; 50 μg/mL PEG20000), 10 µL of 0.3 µM [γ-³³P]-ATP, 5 µL of
compound solution, and 10 µL of 9.5 nM recombinant BUB1B. The
mixtures were incubated at 30 ◦
C for 60 min, and the reactions were
terminated with 50 µL of 2% (v/v) H₃PO₄. Plates were washed twice with
0.9% (w/v) NaCl, and the incorporation of ³³Pi was quantified using a
N. Parvizi et al. Journal of Molecular Structure 1374 (2026) 146659
3
microplate scintillation counter (MicroBeta, Wallac).
2.4. Single-crystal X-ray diffraction
The crystal structure of compound 3a was determined using single-
crystal X-ray diffraction (SC-XRD). Data was collected on a Bruker
APEX II three-circle diffractometer. Using Olex2 [17], the structure was
solved with the olex2.solve [18] structure solution program using
Charge Flipping and refined with the XL [19] refinement package using
Least Squares minimization. The crystallographic information files (CIF)
are deposited in the Cambridge Crystallographic Data Centre (CCDC),
and are directly accessible at https://www.ccdc.cam.ac.uk/structures/
(CCDC numbers: 2377,633). Software packages Mercury (version
2022.3.0) [20] and Platon (version 1.17) [21] were employed to identify
and visualize noncovalent interactions. The asymmetric unit was drawn
using ORTEP-3 (version 2023.1) [22]. Additional details on crystal data
and structure refinement can be found in Table 1.
2.5. Hirshfeld surfaces
Hirshfeld surface analysis was performed using CrystalExplorer21
[23] to quantify intermolecular interactions stabilizing the crystal
packing. CIF structural data were used to generate Hirshfeld surfaces
and 2D fingerprint plots, revealing the nature and distribution of
atom–atom contacts. Surfaces were mapped with the normalized contact
distance (dnorm), displayed with transparency and a red–blue scale
(–0.141 to +1.400 a.u.) to highlight close contacts and potential weak
hydrogen bonds. Fingerprint plots were generated at 0.5 a.u. isovalue,
over a 1–3 Å range, and filtered by element. The void surface, repre­
senting the procrystal electron density, was visualized at 0.002 e au⁻³ for
the full unit cell.
2.6. Energy frameworks
Energy lattice and energy framework analyses were performed using
the Tonto program implemented within CrystalExplorer21. Molecular
clusters within a 3.8 Å radius were generated, and interaction energy
was derived using the B3LYP/6–31G(d,p) level of theory. The tube di­
mensions were calibrated using a scale factor of 100. The default scale
factors for the energy framework calculations were set to Kele= 1.057,
Kpol= 0.740, Kdis= 0.871, Krep= 0.618, with a cut-off value of 5 kJ/mol.
2.7. Quantum chemical calculations
All density functional theory (DFT) calculations were performed
using the Gaussian 09 software package [24] in conjunction with the
GaussView 6.0.16 program [25]. The experimental X-ray crystal struc­
ture served as the initial geometry for all computational work. All cal­
culations were performed in the gas phase. For geometry optimization,
vibrational frequency analysis, and the calculation of global chemical
reactivity descriptors—including Frontier Molecular Orbitals (HOMO,
LUMO) and the Molecular Electrostatic Potential (MEP)—calculations
were performed at the B3LYP/6–311++G(d,p) level of theory [26,27].
The absence of imaginary frequencies confirmed each optimized struc­
ture as a true energy minimum. The MEP surface was generated from the
resulting wavefunction and visualized on the 0.001 a.u. electron density
isosurface using GaussView 6.0.16. For the analysis of noncovalent in­
teractions, the Independent Gradient Model based on Hirshfeld partition
(IGMH) was employed [28,29]. To accurately describe dispersion forces,
geometry optimizations of selected dimers were performed using the
dispersion-corrected ωB97X-D functional [30,31] with the aug-cc-pVDZ
basis set [32]. Higher-accuracy single-point energy calculations were
subsequently carried out using the aug-cc-pVTZ basis set. This approach
has proven reliable for characterizing intermolecular interactions in
organic molecular crystals [33–35]. The IGMH analysis was conducted
on the obtained DFT-wavefunctions using Multiwfn 3.8 [36,37]. The 3D
δginter
isosurfaces (isovalue = 0.01 a.u.) were visualized with VMD 1.9.3
[38], and the corresponding 2D scatter plots were generated with
Gnuplot 6.0.4 [39]. Due to the lack of solid-state structures for 3b-3d,
the detailed DFT analysis is intentionally restricted to 3a and is meant
as an in-depth characterization of the lead rather than a full
quantum-chemical SAR.
2.8. Molecular docking
Molecular docking studies were carried out using Glide XP [40]. The
2D structures of the compounds were drawn with ChemDraw and con­
verted to 3D geometries using LigPrep [41] with the OPLS_4 force field
to generate energy-minimized conformations and relevant tautomeric,
stereochemical, and ionization variants. All possible ionizable (proto­
nation/deprotonation) states as well as tautomeric forms in the pH range
of 7.0 ± 2.0 were generated using the Epik function of LigPrep module
[42]. The crystal structure of the human BUB1 kinase domain (PDB ID:
6F7B, 2.00 Å resolution) was obtained from the Protein Data Bank and
prepared in Maestro using the Protein Preparation Wizard [43]. Bond
orders, formal charges, and missing hydrogens were corrected; incom­
plete amide groups were refined; protonation states were adjusted at
physiological pH; and all water molecules were removed. Energy
minimization was performed using the OPLS_4 force field. The receptor
grid was generated in the Glide module with the grid box centered on the
active site at x = 10.07 Å, y = –31.06 Å, z = –15.57 Å, accommodating
ligands up to 16 Å. Docking was performed in extra precision (XP) mode
with flexible ligand sampling. The Glide scoring function (G-score),
incorporating van der Waals, Coulombic, lipophilic, hydrogen-bonding,
buried polar, rotatable bond, and site penalty terms, was used to eval­
uate binding affinities. Default XP parameters were applied, including a
van der Waals scaling factor of 0.80 and a partial charge cutoff of 0.15e.
The alignment between the native conformation of the co-
crystallized ligand and the conformation predicted by the docking
simulation resulted in RMSD value of 0.5741 Å. This value is well within
the widely accepted threshold for docking validation. This result dem­
onstrates that the docking protocol effectively reproduces the experi­
mental binding mode, ensuring the reliability of the subsequent
calculations.
2.9. Molecular dynamics (MD) simulation
Molecular dynamics simulations were performed using the Desmond
package [44] to evaluate the structural stability and conformational
flexibility of the BUB1 kinase domain–ligand complex. The crystal
structure of BUB1B in complex with BAY-1816,032 (PDB ID: 6F7B) was
Table 1
Crystal data and details of the structure determination for compound 3a.
CCDC Number 2377,633
Chemical formula C26H33N7O2S
Formula weight (g/mol) 507.65
Crystal system/Space group Triclinic, P-1
a, b, c (Å) 11.080(2), 15.267(2), 18.038(2)
α, β, γ (◦
) 108.373(2), 98.529(2), 97.246(2)
Volume (Å3
) / Z 2814.9(6) / 4
Dcalc (g. cm− 3
) / μ(mm− 1
) 1.198 / 0.150
F(000) 1080
Crystal size (mm3
) 0.15 × 0.21 × 0.35
θ (◦
) 1.4 − 27.5
Index ranges − 14, 14 / − 19, 19 / − 23, 23
Reflections measured 35,710
Independent/obs. reflections 12,888/6959
Data/parameters 12,888/653
Goodness-of-fit on F2
0.91
Final R indices 0.0554
wR2 0.1547
Rint 0.089
Largest diff. peak/hole (e.Å− 3
) 0.49/− 0.55
N. Parvizi et al. Journal of Molecular Structure 1374 (2026) 146659
4
obtained from the Protein Data Bank. Since no PDB ID currently exists
for BUB1B in complex with the ligand (holo-structure), we selected this
specific PDB ID (6F7B) file based on the high sequence conservation and
similar domain organization between BUB1 and BUB1B, as well as
previously reported findings in the literature [45]. The complex was
placed at the center of an orthorhombic simulation box filled with SPC
water molecules, maintaining a 10 Å buffer from the box edges. Na⁺ and
Cl⁻ ions were added to neutralize the system. Simulations were per­
formed under isothermal–isobaric (NPT) conditions at 310 K and 1 atm,
using the Nose–Hoover thermostat for temperature coupling and the
Martyna–Tobias–Klein barostat for pressure control. After system
equilibration, production MD was conducted with trajectories saved
every 200 ps. Stability and convergence were analyzed by monitoring
the root-mean-square deviation (RMSD) of the protein backbone and
ligand throughout the simulation.
3. Results and discussion
3.1. Chemistry
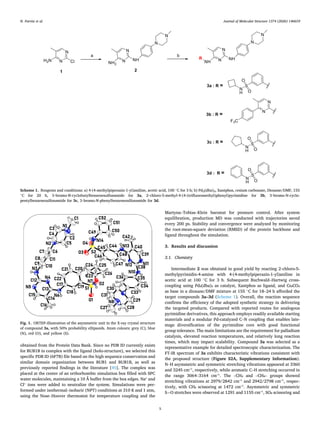
Intermediate 2 was obtained in good yield by reacting 2‑chloro-5-
methylpyrimidin-4-amine with 4-(4-methylpiperazin-1-yl)aniline in
acetic acid at 100 ◦
C for 3 h. Subsequent Buchwald–Hartwig cross-
coupling using Pd₂(dba)₃ as catalyst, Xantphos as ligand, and Cs₂CO₃
as base in a dioxane/DMF mixture at 155 ◦
C for 18–24 h afforded the
target compounds 3a–3d (Scheme 1). Overall, the reaction sequence
confirms the efficiency of the adopted synthetic strategy in delivering
the targeted products. Compared with reported routes for analogous
pyrimidine derivatives, this approach employs readily available starting
materials and a modular Pd-catalyzed C–N coupling that enables late-
stage diversification of the pyrimidine core with good functional
group tolerance. The main limitations are the requirement for palladium
catalysis, elevated reaction temperatures, and relatively long reaction
times, which may impact scalability. Compound 3a was selected as a
representative example for detailed spectroscopic characterization. The
FT-IR spectrum of 3a exhibits characteristic vibrations consistent with
the proposed structure (Figure S2A, Supplementary Information).
N–H asymmetric and symmetric stretching vibrations appeared at 3360
and 3245 cm⁻¹, respectively, while aromatic C–H stretching occurred in
the range 3064–3164 cm⁻¹. The –CH₃ and –CH₂– groups showed
stretching vibrations at 2979/2842 cm⁻¹ and 2942/2798 cm⁻¹, respec­
tively, with CH₂ scissoring at 1472 cm⁻¹. Asymmetric and symmetric
S=O stretches were observed at 1291 and 1155 cm⁻¹, SO₂ scissoring and
Scheme 1. Reagents and conditions: a) 4-(4-methylpiperazin-1-yl)aniline, acetic acid, 100 ◦
C for 3 h; b) Pd2(dba)3, Xantphos, cesium carbonate, Dioxane/DMF, 155
◦
C for 20 h, 3‑bromo-N-cyclobutylbenzenesulfonamide for 3a, 2‑chloro-5-methyl-4-(4-(trifluoromethyl)phenyl)pyrimidine for 3b, 3‑bromo-N-cyclo­
pentylbenzenesulfonamide for 3c, 3‑bromo-N-phenylbenzenesulfonamide for 3d.
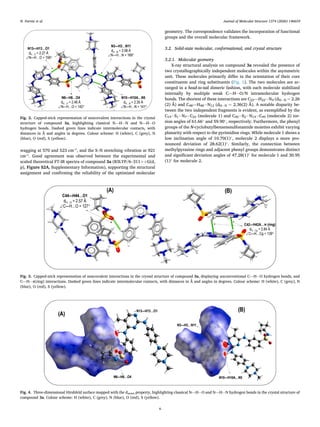
Fig. 1. ORTEP-illustration of the asymmetric unit in the X-ray crystal structure
of compound 3a, with 50% probability ellipsoids. Atom colours: grey (C), blue
(N), red (O), and yellow (S).
N. Parvizi et al. Journal of Molecular Structure 1374 (2026) 146659
5
wagging at 570 and 523 cm⁻¹, and the S–N stretching vibration at 921
cm⁻¹. Good agreement was observed between the experimental and
scaled theoretical FT-IR spectra of compound 3a (B3LYP/6–311++G(d,
p), Figure S2A, Supplementary Information), supporting the structural
assignment and confirming the reliability of the optimized molecular
geometry. The correspondence validates the incorporation of functional
groups and the overall molecular framework.
3.2. Solid-state molecular, conformational, and crystal structure
3.2.1. Molecular geometry
X-ray structural analysis on compound 3a revealed the presence of
two crystallographically independent molecules within the asymmetric
unit. These molecules primarily differ in the orientation of their core
constituents and ring substituents (Fig. 1). The two molecules are ar­
ranged in a head-to-tail dimeric fashion, with each molecule stabilized
internally by multiple weak C—H⋅⋅⋅O/N intramolecular hydrogen
bonds. The shortest of these interactions are C22—H22⋅⋅⋅N4 (dH⋅⋅⋅N = 2.26
(2) Å) and C48—H48⋅⋅⋅N12 (dH⋅⋅⋅N = 2.36(2) Å). A notable disparity be­
tween the two independent fragments is evident, as exemplified by the
C19− S1− N7− C23 (molecule 1) and C45− S2− N14− C49 (molecule 2) tor­
sion angles of 61.66◦
and 59.90◦
, respectively. Furthermore, the phenyl
groups of the N-cyclobutylbenzenesulfonamide moieties exhibit varying
planarity with respect to the pyrimidine rings. While molecule 1 shows a
low inclination angle of 10.70(1)◦
, molecule 2 displays a more pro­
nounced deviation of 28.62(1)◦
. Similarly, the connection between
methylpyrazine rings and adjacent phenyl groups demonstrates distinct
and significant deviation angles of 47.28(1)◦
for molecule 1 and 30.95
(1)◦
for molecule 2.
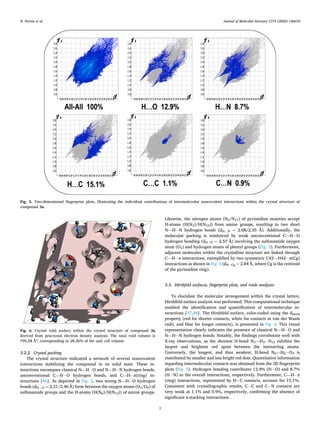
Fig. 2. Capped-stick representation of noncovalent interactions in the crystal
structure of compound 3a, highlighting classical N—H⋅⋅⋅N and N—H⋅⋅⋅O
hydrogen bonds. Dashed green lines indicate intermolecular contacts, with
distances in Å and angles in degrees. Colour scheme: H (white), C (grey), N
(blue), O (red), S (yellow).
Fig. 3. Capped-stick representation of noncovalent interactions in the crystal structure of compound 3a, displaying unconventional C—H⋅⋅⋅O hydrogen bonds, and
C—H⋅⋅⋅π(ring) interactions. Dashed green lines indicate intermolecular contacts, with distances in Å and angles in degrees. Colour scheme: H (white), C (grey), N
(blue), O (red), S (yellow).
Fig. 4. Three-dimensional Hirshfeld surface mapped with the dnorm property, highlighting classical N—H⋅⋅⋅O and N—H⋅⋅⋅N hydrogen bonds in the crystal structure of
compound 3a. Colour scheme: H (white), C (grey), N (blue), O (red), S (yellow).
N. Parvizi et al. Journal of Molecular Structure 1374 (2026) 146659
6
3.2.2. Crystal packing
The crystal structure indicated a network of several noncovalent
interactions stabilizing the compound in its solid state. These in­
teractions encompass classical N—H⋅⋅⋅O and N—H⋅⋅⋅N hydrogen bonds,
unconventional C—H⋅⋅⋅O hydrogen bonds, and C—H⋅⋅⋅π(ring) in­
teractions [46]. As depicted in Fig. 2, two strong N—H⋅⋅⋅O hydrogen
bonds (dH…O = 2.21/2.46 Å) form between the oxygen atoms (O1/O4) of
sulfonamide groups and the H-atoms (H(N6)/H(N13)) of amine groups.
Likewise, the nitrogen atoms (N5/N11) of pyrimidine moieties accept
H-atoms (H(N3)/H(N10)) from amine groups, resulting in two short
N—H⋅⋅⋅N hydrogen bonds (dH…N = 2.08/2.35 Å). Additionally, the
molecular packing is reinforced by weak unconventional C—H⋅⋅⋅O
hydrogen bonding (dH⋅⋅⋅O = 2.57 Å) involving the sulfonamide oxygen
atom (O1) and hydrogen atoms of phenyl groups (Fig. 3). Furthermore,
adjacent molecules within the crystalline structure are linked through
C—H⋅⋅⋅π interactions, exemplified by two symmetric C42—H42⋅⋅⋅π(Cg)
interactions as shown in Fig. 3 (dH⋅⋅⋅Cg = 2.84 Å, where Cg is the centroid
of the pyrimidine ring).
3.3. Hirshfeld surfaces, fingerprint plots, and voids analyses
To elucidate the molecular arrangement within the crystal lattice,
Hirshfeld surface analysis was performed. This computational technique
enabled the identification and quantification of intermolecular in­
teractions [47,48]. The Hirshfeld surface, color-coded using the dnorm
property (red for shorter contacts, white for contacts at van der Waals
radii, and blue for longer contacts), is presented in Fig. 4. This visual
representation clearly indicates the presence of classical N—H⋅⋅⋅O and
N—H⋅⋅⋅N hydrogen bonds. Notably, the findings corroborate well with
X-ray observations, as the shortest H-bond N3—H3⋅⋅⋅N13 exhibits the
largest and brightest red spots between the interacting atoms.
Conversely, the longest, and thus weakest, H-bond N6—H6⋅⋅⋅O4 is
manifested by smaller and less bright red dots. Quantitative information
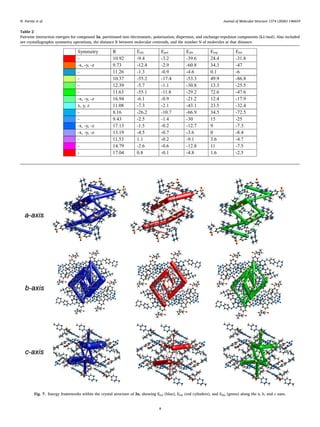
regarding intermolecular contacts was obtained from the 2D fingerprint
plots (Fig. 5). Hydrogen bonding contributes 12.9% (H⋅⋅⋅O) and 8.7%
(H⋅⋅⋅N) to the overall interactions, respectively. Furthermore, C—H⋅⋅⋅π
(ring) interactions, represented by H⋅⋅⋅C contacts, account for 15.1%.
Consistent with crystallographic results, C⋅⋅⋅C and C⋅⋅⋅N contacts are
very weak at 1.1% and 0.9%, respectively, confirming the absence of
significant π-stacking interactions.
Fig. 5. Two-dimensional fingerprint plots, illustrating the individual contributions of intermolecular noncovalent interactions within the crystal structure of
compound 3a.
Fig. 6. Crystal void surface within the crystal structure of compound 3a
derived from procrystal electron density analysis. The total void volume is
795.58 ų, corresponding to 28.26% of the unit cell volume.
N. Parvizi et al. Journal of Molecular Structure 1374 (2026) 146659
7
Table 2
Pairwise interaction energies for compound 3a, partitioned into electrostatic, polarization, dispersion, and exchange-repulsion components (kJ/mol). Also included
are crystallographic symmetry operations, the distance R between molecular centroids, and the number N of molecules at that distance.
Fig. 7. Energy frameworks within the crystal structure of 3a, showing Etot (blue), Eele (red cylinders), and Edis (green) along the a, b, and c axes.
N. Parvizi et al. Journal of Molecular Structure 1374 (2026) 146659
8
To evaluate the crystal packing efficiency and potential structur­
e–property relationships, a void analysis was performed based on iso­
surfaces of the procrystal electron density (Fig. 6) [49]. The total void
volume was calculated to be 795.58 ų, corresponding to 28.26% of the
unit cell volume, indicating the presence of appreciable empty space
within the crystal lattice. Despite this relatively large void fraction, the
crystal structure remains effectively stabilized by directional intermo­
lecular interactions, particularly the N–H⋅⋅⋅N and N/C–H⋅⋅⋅O hydrogen
bonds that dominate the primary packing motifs. This apparent coex­
istence of significant void space and strong pairwise interactions suggest
Fig. 8. Independent gradient model based on Hirshfeld partition (IGMH) analysis of noncovalent interaction motifs in selected dimers D1–D3. Three-dimensional
δginter
isosurfaces (0.01 a.u.) coloured by sign(λ₂)ρ are shown together with the corresponding atomic-pair indices (δGpair
) and percentage contributions. The asso­
ciated two-dimensional scatter plots of δginter
versus sign(λ₂)ρ are provided for each dimer. Atom colour scheme: H (white), C (grey), N (blue), O (red), S (yellow).
N. Parvizi et al. Journal of Molecular Structure 1374 (2026) 146659
9
an anisotropic packing arrangement, in which densely hydrogen-bonded
regions alternate with void-rich zones supported mainly by weaker
dispersion interactions. Although no guest species are present in the
current structure, the presence of accessible voids may indicate a po­
tential for host–guest inclusion or structural adaptability under external
stimuli, which could be of interest for future investigations.
3.4. Lattice energies and energy framework analyses
Energy Frameworks offer a valuable tool for visualizing the supra­
molecular architecture of molecular crystal structures. We calculated
the lattice energy and associated energy frameworks to evaluate the
stability, strength, and extent of pairwise interactions within the crys­
talline structure of compound 3a. Table 2 presents the decomposed
lattice energies, categorized into coulombic, polarization, dispersion,
and repulsion components. Fig. 7 illustrates the energy frameworks,
with Eele, Edis, and Etot represented by red, green, and blue cylinders,
respectively. These cylinders signify the relative strengths of molecular
packing in different directions. Energies between molecular pairs are
depicted as cylinders connecting the centroids of molecular pairs, with
the cylinder radius proportional to the interaction energy magnitude.
The calculated total energy is − 359.4 kJ/mol. The electrostatic, polar­
ization, dispersion, and repulsion energies are − 187.9 kJ/mol, − 54.2
kJ/mol, − 422.5 kJ/mol, and 305.2 kJ/mol, respectively. The dispersion
interaction energy significantly dominates over other interactions. For
this compound, dispersion energies contribute more to the total energy
than Coulombic energies. While the partial sum of dispersion energies
slightly exceeds that of electrostatic energies, the electrostatic energy
framework exhibits stronger interactions, as evidenced by thicker, larger
connecting cylinders. A more detailed inspection of the pairwise inter­
action energies listed in Table 2 reveals that the most stabilizing Etot
contributions correspond to molecular pairs engaged in the head-to-tail
hydrogen-bonded dimers described in the crystal structure section. In
particular, the strongest interaction (Etot = − 31.8 kJ/mol, R = 10.92 Å)
is associated with the dimer sustained by cooperative N–H⋅⋅⋅N and
N–H⋅⋅⋅O hydrogen bonds between symmetry-related molecules. These
hydrogen-bonded dimers give rise to the thickest Etot cylinders
observed in the energy framework (Fig. 7), confirming that directional
electrostatic interactions dominate the primary stabilization pathways
within the crystal. Secondary Etot contributions, with interaction en­
ergies in the range of − 25 to − 47 kJ/mol, originate from molecular pairs
linked by weaker N–H⋅⋅⋅O, C–H⋅⋅⋅O, and C–H⋅⋅⋅π interactions. These
contacts generate thinner cylinders in the energy framework and act as
auxiliary stabilizing forces that reinforce the three-dimensional packing.
In general, the topology of the energy framework directly mirrors the
hierarchy of noncovalent interactions identified crystallographically,
demonstrating that the crystal packing of compound 3a is governed by a
limited number of energetically dominant hydrogen-bonded dimers
complemented by a network of weaker dispersive contacts.
3.5. Independent gradient model based on Hirshfeld partition (IGMH)
study of noncovalent interactions
To further elucidate the nature and relative strength of the weak
noncovalent interactions identified in the crystal structure, the inde­
pendent gradient model based on Hirshfeld partition (IGMH) approach
was employed. This advanced real-space method represents an
improved version of the original independent gradient model (IGM), as
it incorporates Hirshfeld atomic partitioning, thereby enabling a quan­
titative decomposition of interactions into atomic and fragment contri­
butions [28,29]. By relying explicitly on wavefunction information,
IGMH provides a more physically grounded description than the pro­
molecular IGM, avoiding artificially inflated (“bulgy”) isosurfaces.
Moreover, it overcomes key limitations of conventional NCI (RDG)
analysis by clearly separating intra- and inter-fragment interactions. For
Fig. 9. (A) Optimized molecular structure of compound 3a, (B) HOMO and LUMO orbitals, and (C) molecular electrostatic potential (MEP) surface (B3LYP/
6–311++G(d,p)).
Table 3
HOMO and LUMO energies and global reactivity descriptors of
compound 3a calculated at the B3LYP/6–311++G(d,p) level.
Parameters include energy gap (ΔE), electronegativity (χ),
chemical potential (μ), global hardness (η), softness (S), and
electrophilicity index (ω), providing insight into the compound’s
chemical stability and reactivity.
Parameter Value
EHOMO (eV) –5.2659
ELUMO (eV) –1.3943
ΔE (ELUMO–EHOMO, eV) 3.8711
Electronegativity, χ (eV) 3.3301
Chemical potential, μ (eV) –3.3301
Global hardness, η (eV) 1.9358
Softness, S (eV⁻¹) 0.2583
Electrophilicity index, ω (eV) 2.8643
N. Parvizi et al. Journal of Molecular Structure 1374 (2026) 146659
10
this purpose, three representative dimers corresponding to the dominant
supramolecular synthons observed in the crystal packing were extracted
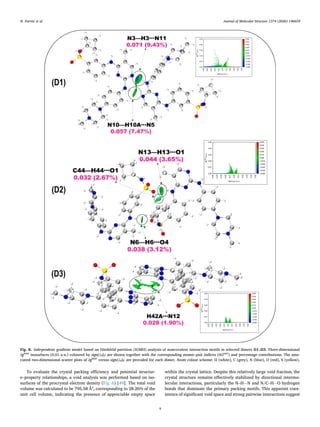
and analysed: N–H⋅⋅⋅N (D1), N–H⋅⋅⋅O and C–H⋅⋅⋅O (D2), and C–H⋅⋅⋅π
(D3). Both visual and quantitative IGMH analyses were performed for
these dimers.
As illustrated in Fig. 8, the δginter
isosurfaces coloured according to
sign(λ₂)ρ confirm the presence of all intermolecular interactions identi­
fied crystallographically. Most isosurfaces appear predominantly green,
indicative of weak hydrogen-bonding interactions with a dispersion-
dominated character. In contrast, the isosurface associated with the
Fig. 10. Anti-ccRCC effects in vitro. A. Cell viability and cytotoxicity test at 10 μM compounds treatment for 2 days. B. Western blot analysis of target protein and
apoptotic proteins. C. IC50 values of compounds. D. FACS analysis for cell cycle distribution. * P < 0.05.
N. Parvizi et al. Journal of Molecular Structure 1374 (2026) 146659
11
N3–H3⋅⋅⋅N11 interaction in dimer D1 exhibits a distinct blue region
embedded within the green envelope, reflecting a relatively stronger
attractive interaction. These observations are further supported by the
corresponding 2D scatter plots of δginter
versus sign(λ₂)ρ, which display
interaction-specific peaks located in negative sign(λ₂)ρ regions charac­
teristic of hydrogen bonding. Notably, the most intense peak corre­
sponds to dimer D1, for which δginter
reaches approximately 0.04 a.u.,
confirming the stronger nature of the N–H⋅⋅⋅N hydrogen bond relative to
the N/C–H⋅⋅⋅O interactions present in the structure.
To provide a quantitative assessment, the interfragment interactions
were further decomposed into atomic-pair contributions using the
IGMH-derived atomic-pair index (δGpair
), calculated on a high-quality
grid. This descriptor quantitatively reflects the contribution of a given
atomic pair to the total δginter
between the interacting fragments. As
shown in Fig. 6, the δGpair
values and their percentage contributions
clearly identify N3–H3⋅⋅⋅N11 as the strongest interaction, with a δGpair
value of 0.071 a.u., accounting for 9.43% of the total interfragment
interaction. Additionally, based on these quantitative results, the
hydrogen bonds in the crystal can be ranked in descending order of
strength as follows: N–H⋅⋅⋅N > N–H⋅⋅⋅O > C–H⋅⋅⋅O. Remarkably, this
hierarchy is fully consistent with the corresponding H⋅⋅⋅acceptor dis­
tances derived from the X-ray crystal structure. Finally, the presence of a
weak C–H⋅⋅⋅π interaction is also detected, associated with the
H42A⋅⋅⋅N12 contact (D3), which exhibits a δGpair
value of 0.028 a.u.
(1.90%), confirming its minor yet non-negligible contribution to the
overall stabilization of the crystal packing.
3.6. DFT calculations on chemical reactivity
DFT computations at the B3LYP/6–311++G(d,p) level were per­
formed to evaluate the electronic properties and chemical reactivity of
compound 3a. Frontier Molecular Orbitals (FMOs), including the
Highest Occupied Molecular Orbital (HOMO) and the Lowest Unoccu­
pied Molecular Orbital (LUMO), provide insight into the electron-
donating and electron-accepting tendencies of the molecule. The en­
ergy gap between HOMO and LUMO (ΔE) serves as a metric for chemical
reactivity, with larger gaps indicating higher kinetic stability and lower
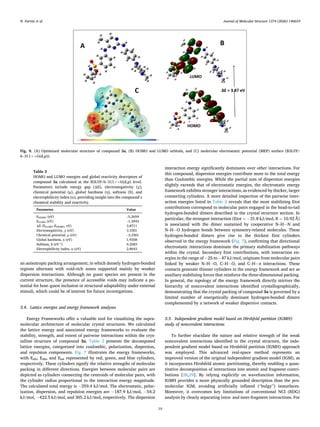
reactivity [50]. The optimized molecular geometry of compound 3a is
shown in Fig. 9A. RMSD for experimental and optimized structures of 3a
over heavy atoms is 1.0574 Å was obtained, which is well within the
widely accepted threshold. The bond length and angle values calculated
using DFT methods were compared with the corresponding experi­
mental values, as summarized in Table S1. An excellent agreement was
observed between the theoretical and experimental data, with a corre­
lation coefficient (R2
) of 0.99 for both parameters (for example the
calculated dihedral angles for C23–N7–S1–O1, C20–C19–S1–O1, and
C18–C19–S1–O2 at the B3LYP/6–311++G(d,p) level are 177.61◦
,
155.99◦
, and − 157.80◦
, respectively, showing excellent correlation with
the corresponding experimental X-ray values of 177.21◦
, 159.96◦
, and
− 153.14◦
). The DFT-calculated HOMO and LUMO energies are –5.2659
eV and –1.3943 eV, respectively, yielding a HOMO-LUMO gap of 3.8711
eV, indicative of a chemically hard and stable molecule. HOMO electron
density is primarily localized on the pyrimidine, phenyl, and piperazine
rings, while LUMO density resides on the cyclobutene, benzenesulfo­
namide, and pyrimidine rings (Fig. 9B). Next, Molecular Electrostatic
Potential (MEP) analysis was performed to visualize electron density
distribution and identify reactive sites. The MEP map (Fig. 9C) is
color-coded: red represents electron-rich regions (potential nucleophilic
sites), blue indicates electron-poor regions (potential electrophilic sites),
and green corresponds to non-polar or neutral areas. In compound 3a,
red regions surround the sulfonyl oxygen atoms (S=O), suggesting
probable electrophilic interaction sites, while hydrogen atoms on the
pyrimidine moiety occupy blue regions, prone to nucleophilic attack.
These features provide insight into potential protein-ligand interactions
and biological activity. Moreover, global reactivity descriptors were
calculated using Koopmans’ theorem, including electronegativity (χ),
chemical potential (μ), global hardness (η), softness (S), and electro­
philicity index (ω), as summarized in Table 3. For compound 3a, the
high ΔE (3.8711 eV) and η (1.9358 eV) indicate significant stability and
low polarizability, while the electrophilicity index (ω = 2.8643 eV) re­
flects the molecule’s electron-accepting ability. The low chemical soft­
ness (S = 0.2583 eV⁻¹) further confirms molecular hardness and low
reactivity.
These findings are further corroborated by both experimental data
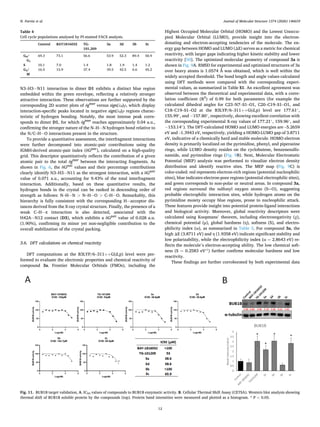
Table 4
Cell cycle populations analysed by PI-stained FACS analysis.
Control BAY1816032 TG-
101,209
3a 3d 3b 3c
G0/
G1
69.3 73.1 56.6 53.9 52.3 89.4 50.9
S 10.1 7.0 1.4 1.8 1.9 1.4 1.2
G2/
M
16.5 15.9 37.4 39.5 42.5 6.6 45.2
Fig. 11. BUB1B target validation, A. IC50 values of compounds to BUB1B enzymatic activity. B. Cellular Thermal Shift Assay (CETSA). Western blot analysis showing
thermal shift of BUB1B soluble protein by the compounds (top). Protein band intensities were measured and plotted as a histogram. * P < 0.05.
N. Parvizi et al. Journal of Molecular Structure 1374 (2026) 146659
12
and MD simulation results.
3.7. In vitro biological evaluation and mechanistic validation of BUB1B
inhibitors in ccRCC
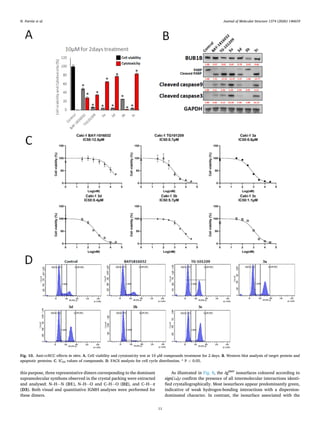
The four compounds, 3a-d, were evaluated for their anti-ccRCC ef­
fects on Caki-1 human renal cancer cells (Fig. 10). Treatment with 10 μM
of the compounds for 2 days markedly decreased cell viability and
induced cytotoxicity (Fig. 10A), using BAY-1816,032, an inhibitor of
BUB1B protein, as the positive control. Cell viability was observed as
follows: 3a (5.1% ± 0.01), 3d (4.6% ± 0.44), 3b (24.9% ± 0.59), and 3c
(4.4% ± 0.23) compared to BAY-1816,032 (48.4% ± 2.23) and TG-
101,209 (6.5% ± 0.77). Cytotoxic effects were stronger for 3a (64.9%
± 1.06), 3d (77.5% ± 1.09), and 3c (82.9% ± 2.08) compared to BAY-
1816,032 (28.3% ± 2.95) and TG-101,209 (35.0% ± 1.03), whereas 3b
(24.9% ± 0.59) did not induce significant cytotoxicity.
IC₅₀ values from cell viability assays revealed strong potency for 3a
(0.6 μM), 3d (0.4 μM), and 3c (1.1 μM) compared to BAY-1816,032
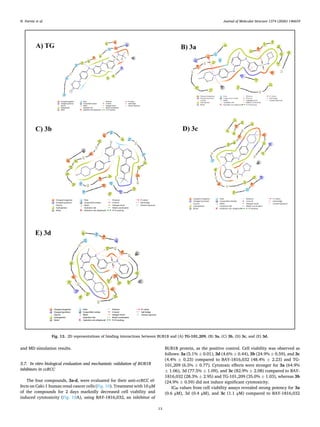
Fig. 12. 2D representations of binding interactions between BUB1B and (A) TG-101,209, (B) 3a, (C) 3b, (D) 3c, and (E) 3d.
N. Parvizi et al. Journal of Molecular Structure 1374 (2026) 146659
13
(12.0 μM) and TG-101,209 (0.7 μM) (Fig. 10C). The compounds were
less toxic toward MRC-5 lung fibroblasts (Figure S17, Supplementary
Information).
Apoptotic pathway activation was evaluated by western blot analysis
(Fig. 10B). Treatment with compounds 3a, 3d, and 3c resulted in
approximately 60–70% reduction in BUB1B protein levels, increased
cleaved PARP 5–12-fold, cleaved caspase-9 2–5-fold, and cleaved
caspase-3 2–22-fold compared to control. Interestingly, 3b did not
induce cytotoxicity or expression of apoptosis-related proteins, despite
strong inhibition of cell viability and prominent suppression of BUB1B
protein expression.
To further evaluate the therapeutic effects, PI staining FACS analysis
was performed (Fig. 10D). Apoptosis-inducing compounds 3a, 3d, 3c,
and TG-101,209 significantly reduced the S-phase cell population. This
provides a possible explanation for how 3b decreases cell viability
without inducing cytotoxicity or apoptosis. Specifically, 3b showed
89.4% of cells arrested in G0/G1 phase compared to 69.3% in the con­
trol group. The S-phase and G2/M-phase populations were 1.4% and
6.6%, respectively, versus 10.1% and 16.5% in the control (Table 4).
To validate compound interactions with BUB1B, IC₅₀ values for
enzymatic activity were measured, and Cellular Thermal Shift Assay
(CETSA) was performed (Fig. 11). Compounds 3a (38.6 μM) and 3d
(38.6 μM) showed better inhibition than TG-101,209, whereas 3c (65.9
μM) was less potent. Compound 3b, which mainly reduced BUB1B
protein levels and induced strong G0/G1 arrest, exhibited very low
binding affinity (IC₅₀ > 100 μM), similar to BAY-1816,032.
CETSA results supported these findings. Compounds 3a, 3d, 3c, and
TG-101,209 stabilized BUB1B under heat shock conditions, suggesting
direct target binding. In contrast, 3b destabilized BUB1B, indicating a
different binding mechanism. These data suggest that 3b may interact
with BUB1B through an alternative mode of action, likely targeting a
non-catalytic site distinct from the enzymatic pocket engaged by other
active compounds.
Overall, comparative analysis of the four derivatives identifies
compound 3a as the most potent BUB1B inhibitor in ccRCC cells. While
both 3a and 3d displayed similar enzymatic inhibition profiles, 3a
achieved a slightly greater reduction in BUB1B protein levels compared
to 3d Moreover, 3a induced a stronger apoptotic response, as reflected
by higher levels of cleaved PARP and caspase activation. This suggests
that 3a not only inhibits BUB1B activity but also triggers a more effec­
tive downstream apoptotic cascade. The cell cycle analysis further
supports these findings, as both 3a and 3d induced marked G2/M arrest,
with 3d showing a slightly higher accumulation at this phase; however,
the more pronounced apoptotic activation observed with 3a indicates a
stronger overall cytotoxic mechanism.
In addition, as shown in the supplementary data (Figure S18),
compound 3a exhibited slightly lower toxicity toward normal MRC-5
fibroblasts compared to the other derivatives, indicating a better selec­
tivity profile between cancerous and noncancerous cells. Despite their
comparable biochemical inhibition capacities, 3a demonstrated a more
balanced relationship between enzymatic inhibition, apoptotic activa­
tion, and cellular selectivity, which may explain its overall superior
cytotoxic effect against Caki-1 cells. These results collectively suggest
that compound 3a exerts its anti-ccRCC activity through both potent
BUB1B inhibition and efficient induction of apoptosis, while maintain­
ing relatively lower toxicity toward normal cells.
3.8. Molecular docking and dynamics studies
Molecular docking was performed to predict the binding modes and
affinities of the synthesized compounds within the BUB1B active site
(Fig. 12). Among the four molecules, compound 3a exhibited the most
favorable binding interactions and docking score, indicating strong af­
finity and complementarity with the target site. The compound estab­
lished three key hydrogen bonds with ASP921 (2.13 Å), ASP946 (2.13
Å), and LEU947 (2.72 Å), in addition to a π–cation interaction with
LYS821. These interactions contribute to complex stabilization, while
Fig. 13. RMSD plots of (A) BUB1B–TG-101,209 and (B) BUB1B–3a complexes
over 200 ns MD simulation.
Fig. 14. RMSF plots showing per-residue flexibility for (A) BUB1B–TG-101,209
and (B) BUB1B–3a complexes.
N. Parvizi et al. Journal of Molecular Structure 1374 (2026) 146659
14
hydrophobic contacts with residues LEU944, ILE945, VAL819, ILE924,
VAL801, ALA799, TYR869, PHE849, MET850, PHE850, and LEU837
further enhance binding affinity. The cyclobutene ring of 3a also favors
conformational stability within the binding pocket. These findings
suggest compound 3a as the most promising candidate compared to the
other analogs.
To evaluate the dynamic behavior and stability of the docked com­
plexes, molecular dynamics (MD) simulations were performed for 200
ns using the Desmond package. Both the TG–BUB1B reference complex
and the 3a–BUB1B complex were simulated under identical conditions
in an orthorhombic box of 424,944 ų, containing ~39,500 atoms
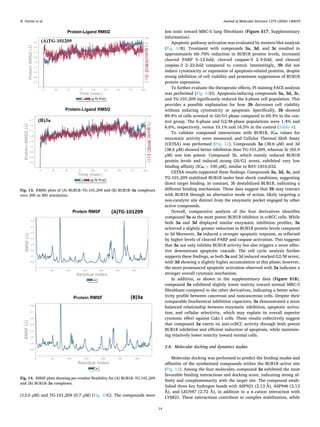
including water molecules. The RMSD trajectories (Fig. 13) revealed
that the protein backbone remained stable, fluctuating between 2.1–2.7
Å for both complexes, indicating no significant conformational drift.
Ligand RMSD values ranged from 2.5 to 3.2 Å for TG and 2.5–3.5 Å for
3a, suggesting flexible yet stable accommodation of both ligands. The
slightly higher fluctuation of 3a reflects adaptive binding within the
pocket, maintaining overall equilibrium throughout the trajectory.
Residue-wise RMSF analysis (Fig. 14) demonstrated comparable
flexibility profiles for both systems. However, the BUB1B–3a complex
exhibited generally lower RMSF amplitudes, implying reduced local
flexibility and a more rigidified binding pocket. This stabilization effect
indicates that compound 3a induces tighter conformational restraint
compared to TG-101,209, particularly around the catalytic residues.
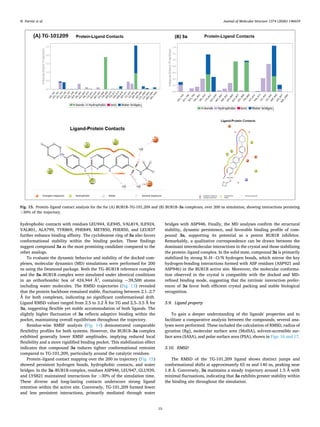
Protein–ligand contact mapping over the 200 ns trajectory (Fig. 15)
showed persistent hydrogen bonds, hydrophobic contacts, and water
bridges. In the 3a–BUB1B complex, residues ASP946, LEU947, GLU939,
and LYS821 maintained interactions for >30% of the simulation time.
These diverse and long-lasting contacts underscore strong ligand
retention within the active site. Conversely, TG-101,209 formed fewer
and less persistent interactions, primarily mediated through water
bridges with ASP946. Finally, the MD analyses confirm the structural
stability, dynamic persistence, and favorable binding profile of com­
pound 3a, supporting its potential as a potent BUB1B inhibitor.
Remarkably, a qualitative correspondence can be drawn between the
dominant intermolecular interactions in the crystal and those stabilizing
the protein–ligand complex. In the solid state, compound 3a is primarily
stabilized by strong N–H⋅⋅⋅O/N hydrogen bonds, which mirror the key
hydrogen-bonding interactions formed with ASP residues (ASP921 and
ASP946) in the BUB1B active site. Moreover, the molecular conforma­
tion observed in the crystal is compatible with the docked and MD-
refined binding mode, suggesting that the intrinsic interaction prefer­
ences of 3a favor both efficient crystal packing and stable biological
recognition.
3.9. Ligand property
To gain a deeper understanding of the ligands' properties and to
facilitate a comparative analysis between the compounds, several ana­
lyses were performed. These included the calculation of RMSD, radius of
gyration (Rg), molecular surface area (MolSA), solvent-accessible sur­
face area (SASA), and polar surface area (PSA), shown in Figs. 16 and 17.
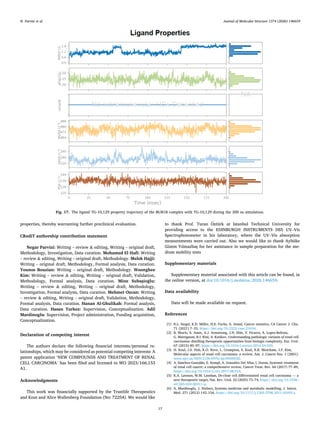
3.10. RMSD
The RMSD of the TG-101,209 ligand shows distinct jumps and
conformational shifts at approximately 65 ns and 140 ns, peaking near
1.8 Å. Conversely, 3a maintains a steady trajectory around 1.5 Å with
minimal fluctuations, indicating that 3a exhibits greater stability within
the binding site throughout the simulation.
Fig. 15. Protein–ligand contact analysis for the for (A) BUB1B–TG-101,209 and (B) BUB1B–3a complexes, over 200 ns simulation, showing interactions persisting
>30% of the trajectory.
N. Parvizi et al. Journal of Molecular Structure 1374 (2026) 146659
15
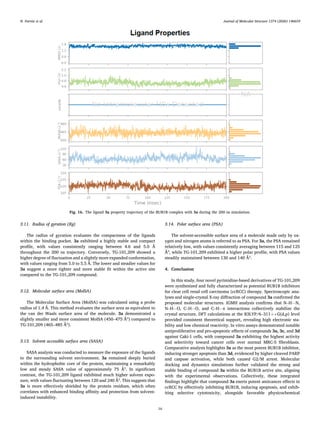
3.11. Radius of gyration (Rg)
The radius of gyration evaluates the compactness of the ligands
within the binding pocket. 3a exhibited a highly stable and compact
profile, with values consistently ranging between 4.6 and 5.0 Å
throughout the 200 ns trajectory. Conversely, TG-101,209 showed a
higher degree of fluctuation and a slightly more expanded conformation,
with values ranging from 5.0 to 5.5 Å. The lower and steadier values for
3a suggest a more tighter and more stable fit within the active site
compared to the TG-101,209 compound.
3.12. Molecular surface area (MolSA)
The Molecular Surface Area (MolSA) was calculated using a probe
radius of 1.4 Å. This method evaluates the surface area as equivalent to
the van der Waals surface area of the molecule. 3a demonstrated a
slightly smaller and more consistent MolSA (450–475 Ų) compared to
TG-101,209 (465–485 Ų).
3.13. Solvent accessible surface area (SASA)
SASA analysis was conducted to measure the exposure of the ligands
to the surrounding solvent environment. 3a remained deeply buried
within the hydrophobic core of the protein, maintaining a remarkably
low and steady SASA value of approximately 75 Ų. In significant
contrast, the TG-101,209 ligand exhibited much higher solvent expo­
sure, with values fluctuating between 120 and 240 Ų. This suggests that
3a is more effectively shielded by the protein residues, which often
correlates with enhanced binding affinity and protection from solvent-
induced instability.
3.14. Polar surface area (PSA)
The solvent-accessible surface area of a molecule made only by ox­
ygen and nitrogen atoms is referred to as PSA. For 3a, the PSA remained
relatively low, with values consistently averaging between 115 and 125
Ų, while TG-101,209 exhibited a higher polar profile, with PSA values
steadily maintained between 130 and 140 Ų.
4. Conclusion
In this study, four novel pyrimidine-based derivatives of TG-101,209
were synthesized and fully characterized as potential BUB1B inhibitors
for clear cell renal cell carcinoma (ccRCC) therapy. Spectroscopic ana­
lyses and single-crystal X-ray diffraction of compound 3a confirmed the
proposed molecular structures. IGMH analysis confirms that N–H⋅⋅⋅N,
N–H⋅⋅⋅O, C–H⋅⋅⋅O, and C–H⋅⋅⋅π interactions collectively stabilize the
crystal structure. DFT calculations at the B3LYP/6–311++G(d,p) level
provided consistent theoretical support, revealing high electronic sta­
bility and low chemical reactivity. In vitro assays demonstrated notable
antiproliferative and pro-apoptotic effects of compounds 3a, 3c, and 3d
against Caki-1 cells, with compound 3a exhibiting the highest activity
and selectivity toward cancer cells over normal MRC-5 fibroblasts.
Comparative analysis highlights 3a as the most potent BUB1B inhibitor,
inducing stronger apoptosis than 3d, evidenced by higher cleaved PARP
and caspase activation, while both caused G2/M arrest. Molecular
docking and dynamics simulations further validated the strong and
stable binding of compound 3a within the BUB1B active site, aligning
with the experimental observations. Collectively, these integrated
findings highlight that compound 3a exerts potent anticancer effects in
ccRCC by effectively inhibiting BUB1B, inducing apoptosis, and exhib­
iting selective cytotoxicity, alongside favorable physicochemical
Fig. 16. The ligand 3a property trajectory of the BUB1B complex with 3a during the 200 ns simulation.
N. Parvizi et al. Journal of Molecular Structure 1374 (2026) 146659
16
properties, thereby warranting further preclinical evaluation.
CRediT authorship contribution statement
Negar Parvizi: Writing – review & editing, Writing – original draft,
Methodology, Investigation, Data curation. Mohamed El Hafi: Writing
– review & editing, Writing – original draft, Methodology. Melek Hajji:
Writing – original draft, Methodology, Formal analysis, Data curation.
Younos Bouzian: Writing – original draft, Methodology. Woonghee
Kim: Writing – review & editing, Writing – original draft, Validation,
Methodology, Formal analysis, Data curation. Mine Subaşioğlu:
Writing – review & editing, Writing – original draft, Methodology,
Investigation, Formal analysis, Data curation. Mehmet Ozcan: Writing
– review & editing, Writing – original draft, Validation, Methodology,
Formal analysis, Data curation. Hanan Al-Ghulikah: Formal analysis,
Data curation. Hasan Turkez: Supervision, Conceptualization. Adil
Mardinoglu: Supervision, Project administration, Funding acquisition,
Conceptualization.
Declaration of competing interest
The authors declare the following financial interests/personal re­
lationships, which may be considered as potential competing interests: A
patent application ‘NEW COMPOUNDS AND TREATMENT OF RENAL
CELL CARCINOMA’ has been filed and licensed to WO 2023/166,153
A1.
Acknowledgments
This work was financially supported by the Trustlife Therapeutics
and Knut and Alice Wallenberg Foundation (No: 72254). We would like
to thank Prof. Turan Öztürk at Istanbul Technical University for
providing access to the EDINBURGH INSTRUMENTS DS5 UV–Vis
Spectrophotometer in his laboratory, where the UV–Vis absorption
measurements were carried out. Also we would like to thank Aybüke
Gizem Yılmazbaş for her assistance in sample preparation for the me­
dium stability tests
Supplementary materials
Supplementary material associated with this article can be found, in
the online version, at doi:10.1016/j.molstruc.2026.146659.
Data availability
Data will be made available on request.
References
[1] R.L. Siegel, K.D. Miller, H.E. Fuchs, A. Jemal, Cancer statistics, CA Cancer J. Clin.
71 (2021) 7–33, https://doi.org/10.3322/caac.21654.
[2] B. Shuch, A. Amin, A.J. Armstrong, J.N. Eble, V. Ficarra, A. Lopez-Beltran,
G. Martignoni, B.I. Rini, A. Kutikov, Understanding pathologic variants of renal cell
carcinoma: distilling therapeutic opportunities from biologic complexity, Eur. Urol.
67 (2015) 85–97, https://doi.org/10.1016/j.eururo.2014.04.029.
[3] H. Koul, J.S. Huh, K.O. Rove, L. Crompton, S. Koul, R.B. Meacham, J.F. Kim,
Molecular aspects of renal cell carcinoma: a review, Am. J. Cancer Res. 1 (2001).
www.ajcr.us/ISSN:2156-6976/ajcr0000020.
[4] A. Sánchez-Gastaldo, E. Kempf, A. González Del Alba, I. Duran, Systemic treatment
of renal cell cancer: a comprehensive review, Cancer Treat. Rev. 60 (2017) 77–89,
https://doi.org/10.1016/j.ctrv.2017.08.010.
[5] K.A. Lawson, W.M. Linehan, De-clear cell differentiated renal cell carcinoma — a
new therapeutic target, Nat. Rev. Urol. 22 (2025) 73–74, https://doi.org/10.1038/
s41585-024-00911-w.
[6] A. Mardinoglu, J. Nielsen, Systems medicine and metabolic modelling, J. Intern.
Med. 271 (2012) 142–154, https://doi.org/10.1111/j.1365-2796.2011.02493.x.
Fig. 17. The ligand TG-10,129 property trajectory of the BUB1B complex with TG-10,129 during the 200 ns simulation.
N. Parvizi et al. Journal of Molecular Structure 1374 (2026) 146659
17
[7] A. Mardinoglu, B.Ø. Palsson, Nat. Rev. Genet genome-scale models in human
metabologenomics, Nat. Rev. Genet. 26 (2025) 123–140, https://doi.org/10.1038/
s41576-024-00768-0.
[8] A. Mardinoglu, J. Nielsen, The impact of systems medicine on human health and
disease, Front. Physiol. 7 (2016), https://doi.org/10.3389/fphys.2016.00552.
[9] A. Mardinoglu, J. Boren, U. Smith, M. Uhlen, J. Nielsen, Systems biology in
hepatology: approaches and applications, Nat. Rev. Gastroenterol. Hepatol. 15
(2018) 365–377, https://doi.org/10.1038/s41575-018-0007-8.
[10] X. Li, K. Shong, W. Kim, M. Yuan, H. Yang, Y. Sato, H. Kume, S. Ogawa, H. Turkez,
S. Shoaie, J. Boren, J. Nielsen, M. Uhlen, C. Zhang, A. Mardinoglu, Prediction of
drug candidates for clear cell renal cell carcinoma using a systems biology-based
drug repositioning approach, EBioMedicine 78 (2022) 103963, https://doi.org/
10.1016/j.ebiom.2022.103963.
[11] Z. Kilic-Kurt, N. Ozmen, F. Bakar-Ates, Synthesis and anticancer activity of some
pyrimidine derivatives with aryl urea moieties as apoptosis-inducing agents,
Bioorg. Chem. 101 (2020) 104028, https://doi.org/10.1016/j.
bioorg.2020.104028.
[12] V. Sharma, N. Chitranshi, A.K. Agarwal, Significance and biological importance of
pyrimidine in the microbial world, Int. J. Med. Chem. 2014 (2014) 1–31, https://
doi.org/10.1155/2014/202784.
[13] V. Finger, M. Kufa, O. Soukup, D. Castagnolo, J. Roh, J. Korabecny, Pyrimidine
derivatives with antitubercular activity, Eur. J. Med. Chem. 246 (2023) 114946,
https://doi.org/10.1016/j.ejmech.2022.114946.
[14] T.J. Yeh, L.P. Chan, H.T. Tsai, C.M. Hsu, S.F. Cho, M.R. Pan, Y.C. Liu, C.J. Huang,
C.W. Wu, J.S. Du, H.C. Wang, The overall efficacy and outcomes of metronomic
tegafur-uracil chemotherapy on locally advanced head and neck squamous cell
carcinoma: a real-world cohort experience, Biology 10 (2021) 168, https://doi.
org/10.3390/biology10020168.
[15] Y. Bouzian, M. El Hafi, N. Parvizi, W. Kim, M. Subaşioğlu, M. Ozcan, H. Turkez,
A. Mardinoglu, Design and evaluation of novel inhibitors for the treatment of clear
cell renal cell carcinoma, Bioorg. Chem. 151 (2024) 107597, https://doi.org/
10.1016/j.bioorg.2024.107597.
[16] M. El Hafi, Y. Bouzian, N. Parvizi, W. Kim, M. Subaşioğlu, M. Ozcan, H. Turkez,
A. Mardinoglu, Synthesis and biological assessment of BUB1B inhibitors for the
treatment of clear cell renal cell carcinoma, Eur. J. Med. Chem. 285 (2025)
117247, https://doi.org/10.1016/j.ejmech.2025.117247.
[17] O.V. Dolomanov, L.J. Bourhis, R.J. Gildea, J.A.K. Howard, H. Puschmann, OLEX2 :
a complete structure solution, refinement and analysis program, J. Appl.
Crystallogr. 42 (2009) 339–341, https://doi.org/10.1107/S0021889808042726.
[18] L.J. Bourhis, O.V. Dolomanov, R.J. Gildea, J.A.K. Howard, H. Puschmann, The
anatomy of a comprehensive constrained, restrained refinement program for the
modern computing environment – Olex2 dissected, Acta Crystallogr, A Found Adv.
71 (2015) 59–75, https://doi.org/10.1107/S2053273314022207.
[19] G.M. Sheldrick, Crystal structure refinement with SHELXL, Acta Crystallogr. C.
Struct. Chem. 71 (2015) 3–8, https://doi.org/10.1107/S2053229614024218.
[20] C.F. Macrae, I. Sovago, S.J. Cottrell, P.T.A. Galek, P. McCabe, E. Pidcock,
M. Platings, G.P. Shields, J.S. Stevens, M. Towler, P.A. Wood, Mercury 4.0: from
visualization to analysis, design and prediction, J. Appl. Crystallogr. 53 (2020)
226–235, https://doi.org/10.1107/S1600576719014092.
[21] A.L. Spek, Structure validation in chemical crystallography, Acta Crystallogr. D. 65
(2009) 148–155, https://doi.org/10.1107/S090744490804362X.
[22] L.J. Farrugia, WinGX and ORTEP for Windows: an update, J. Appl. Crystallogr. 45
(2012) 849–854, https://doi.org/10.1107/S0021889812029111.
[23] P.R. Spackman, M.J. Turner, J.J. McKinnon, S.K. Wolff, D.J. Grimwood,
D. Jayatilaka, M.A. Spackman, CrystalExplorer : a program for Hirshfeld surface
analysis, visualization and quantitative analysis of molecular crystals, J. Appl.
Crystallogr. 54 (2021) 1006–1011, https://doi.org/10.1107/
S1600576721002910.
[24] J. and others Frisch, MJea and Trucks, GW03 and Schlegel, HB e al and Scuseria,
GE and Robb, MA and Cheeseman, JR and Montgomery Jr, JA and Vreven, TKKN
and Kudin, KN and Burant, Gaussian 03, revision C. 02, (2004).
[25] R. Dennington, T.A. Keith, J.M. Millam, GaussView Version 6, Semichem Inc,
Shawnee Mission KS, 2016.
[26] A.D. Becke, Density-functional thermochemistry. III. The role of exact exchange,
J. Chem. Phys. 98 (1993) 5648–5652, https://doi.org/10.1063/1.464913.
[27] R. Krishnan, J.S. Binkley, R. Seeger, J.A. Pople, Self-consistent molecular orbital
methods. XX. A basis set for correlated wave functions, J. Chem. Phys. 72 (1980)
650–654, https://doi.org/10.1063/1.438955.
[28] T. Lu, Q. Chen, Independent gradient model based on Hirshfeld partition: a new
method for visual study of interactions in chemical systems, J. Comput. Chem. 43
(2022) 539–555, https://doi.org/10.1002/jcc.26812.
[29] T. Lu, Visualization analysis of covalent and noncovalent interactions in real space,
Angew. Chem., Int. Ed. 64 (2025), https://doi.org/10.1002/anie.202504895.
[30] S. Grimme, J. Antony, S. Ehrlich, H. Krieg, A consistent and accurate ab initio
parametrization of density functional dispersion correction (DFT-D) for the 94
elements H-Pu, J. Chem. Phys. 132 (2010), https://doi.org/10.1063/1.3382344.
[31] J.-D. Chai, M. Head-Gordon, Long-range corrected hybrid density functionals with
damped atom–atom dispersion corrections, Phys. Chem. Chem. Phys. 10 (2008)
6615, https://doi.org/10.1039/b810189b.
[32] T.H. Dunning, Gaussian basis sets for use in correlated molecular calculations. I.
The atoms boron through neon and hydrogen, J. Chem. Phys. 90 (1989)
1007–1023, https://doi.org/10.1063/1.456153.
[33] H. Mtiraou, A. Ghabi, H. Al-Ghulikah, M.A. Habib, M. Hajji, Structural and
chemical reactivity insights of a benzimidazolidinone-based N-heterocycle: a
multiapproach quantum-chemical study, Chem. Heterocycl. Compd. N. Y 60
(2024) 611–616, https://doi.org/10.1007/s10593-025-03384-w.
[34] M. Hajji, A. Haouas, N. Abad, T. Guerfel, The unconventional noncovalent
interactions control: crystallographic and theoretical analyses of the crystalline
structure of 1,1′-(1-Chloro-4-methoxyphenyl)dibenzene as a case study,
ChemistrySelect 8 (2023), https://doi.org/10.1002/slct.202302624.
[35] S. Ibrahim, A. Ghabi, N. Amiri, H. Mtiraoui, M. Hajji, R. Bel-Hadj-Tahar,
M. Msaddek, Microwave-assisted synthesis of (3,5-disubstituted isoxazole)-linked
benzimidazolone derivatives: DFT calculations and biological activities, Monatsh.
Chem. 152 (2021) 523–535, https://doi.org/10.1007/s00706-021-02764-0.
[36] T. Lu, F. Chen, Multiwfn: a multifunctional wavefunction analyzer, J. Comput.
Chem. 33 (2012) 580–592, https://doi.org/10.1002/jcc.22885.
[37] T. Lu, A comprehensive electron wavefunction analysis toolbox for chemists,
Multiwfn, J. Chem. Phys. 161 (2024), https://doi.org/10.1063/5.0216272.
[38] W. Humphrey, A. Dalke, K. Schulten, VMD: visual molecular dynamics, J. Mol.
Graph. 14 (1996) 33–38, https://doi.org/10.1016/0263-7855(96)00018-5.
[39] T. Williams, C. Kelley, Gnuplot: An Interactive Plotting Program (version 6.0.4),
(2025). http://gnuplot.info/.
[40] Y. Yang, K. Yao, M.P. Repasky, K. Leswing, R. Abel, B.K. Shoichet, S.V. Jerome,
Efficient exploration of chemical space with docking and deep learning, J. Chem.
Theory. Comput. 17 (2021) 7106–7119, https://doi.org/10.1021/acs.
jctc.1c00810.
[41] L. Schrödinger, LigPrep (Version Release 2023-4), Schrödinger, LLC, New York,
NY, 2023.
[42] J.C. Shelley, A. Cholleti, L.L. Frye, J.R. Greenwood, M.R. Timlin, M. Uchimaya,
Epik: a software program for pK(a) prediction and protonation state generation for
drug-like molecules, J. Comput. Aided. Mol. Des. 21 (2007) 681–691, https://doi.
org/10.1007/s10822-007-9133-z.
[43] 2023 Schrödinger Release 2023-3: Protein Preparation Wizard; Epik, Schrödinger,
LLC, New York, NY, Impact, Schrödinger, LLC, New York, NY; Prime, Schrödinger,
LLC, New York, NY, 2023.
[44] K.J. Bowers, E. Chow, H. Xu, R.O. Dror, M.P. Eastwood, B.A. Gregersen, F.
D. Sacerdoti, Scalable algorithms for molecular dynamics simulations on
commodity clusters, in: Paper presented at the Proceedings of the 2006 ACM/IEEE
Conference on Supercomputing 84, 2016, https://doi.org/10.1145/
1188455.1188544.
[45] V.M. Bolanos-Garcia, T.L. Blundell, BUB1 and BUBR1: multifaceted kinases of the
cell cycle, Trends. Biochem. Sci. 36 (2011) 141–150, https://doi.org/10.1016/j.
tibs.2010.08.004.
[46] M. Hajji, A. Haouas, N. Abad, T. Guerfel, The unconventional noncovalent
interactions control: crystallographic and theoretical analyses of the crystalline
structure of 1,1′-(1-Chloro-4-methoxyphenyl)dibenzene as a case study,
ChemistrySelect 8 (2023), https://doi.org/10.1002/slct.202302624.
[47] M.A. Spackman, D. Jayatilaka, Hirshfeld surface analysis, Cryst. Eng. Comm. 11
(2009) 19–32, https://doi.org/10.1039/B818330A.
[48] N. Hajji, N. Abad, M.H. Habib, S.M.H. Elmgirhi, T. Guerfel, Computational
chemistry methods for modelling non-covalent interactions and chemical
reactivity— an overview, J. Indian Chem. Soc. 98 (2021) 100208, https://doi.org/
10.1016/j.jics.2021.100208.
[49] M.J. Turner, J.J. Mckinnon, D. Jayatilaka, M.A. Spackman, Visualisation and
characterisation of voids in crystalline materials, Cryst. Eng. Comm. 13 (2011)
1804–1813, https://doi.org/10.1039/C0CE00683A.
[50] M. Lamsayah, M. Khoutoul, A. Takfaoui, R. Touzani, High liquid–liquid extraction
selectivity of Fe(II) and Pb(II) with TD-DFT theoretical calculations of long chain
acid pyrazole- and triazole-based ligands, Cogent. Chem. 2 (2016) 1230359,
https://doi.org/10.1080/23312009.2016.1230359.
N. Parvizi et al. Journal of Molecular Structure 1374 (2026) 146659
18