Narayana Health Case Study. Presented at Alphawealth Mumbai Summit
Case study covering all parameters tracked during research, how conviction was built, entry triggers and levels, great founder's profile, what was tracked during the holding period and what led to exit at multi year multiplier returns
Narayana Health Case Study. Presented at Alphawealth Mumbai Summit
1.
Have you heardabout
Narayana Health?
What have you heard?
2.
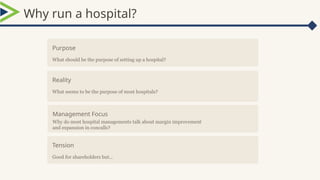
Why run ahospital?
Purpose
What should be the purpose of setting up a hospital?
Reality
What seems to be the purpose of most hospitals?
Tension
Good for shareholders but…
Management Focus
Why do most hospital managements talk about margin improvement
and expansion in concalls?
3.
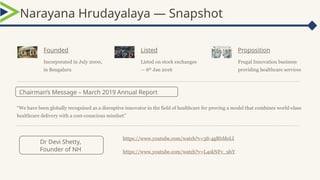
Chairman’s Message –March 2019 Annual Report
Narayana Hrudayalaya — Snapshot
Founded
Incorporated in July 2000,
in Bengaluru
Listed
Listed on stock exchanges
— 6th
Jan 2016
Proposition
Frugal Innovation business
providing healthcare services
“We have been globally recognised as a disruptive innovator in the field of healthcare for proving a model that combines world-class
healthcare delivery with a cost-conscious mindset”
https://www.youtube.com/watch?v=3S-4gRbMeLI
https://www.youtube.com/watch?v=L4skNFv_9hY
Dr Devi Shetty,
Founder of NH
4.
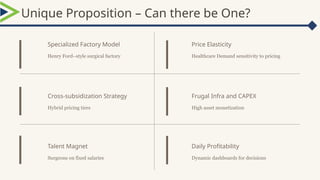
Unique Proposition –Can there be One?
Specialized Factory Model
Henry Ford–style surgical factory
Price Elasticity
Healthcare Demand sensitivity to pricing
Cross-subsidization Strategy
Hybrid pricing tiers
Frugal Infra and CAPEX
High asset monetization
Talent Magnet
Surgeons on fixed salaries
Daily Profitability
Dynamic dashboards for decisions
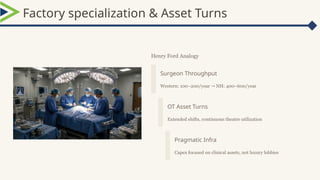
Factory specialization &Asset Turns
Henry Ford Analogy
Surgeon Throughput
Western: 100–200/year NH: 400–600/year
→
OT Asset Turns
Extended shifts, continuous theatre utilization
Pragmatic Infra
Capex focused on clinical assets, not luxury lobbies
7.
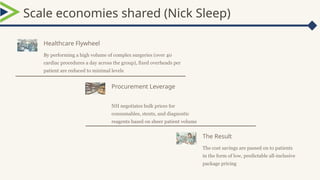
Scale economies shared(Nick Sleep)
Healthcare Flywheel
By performing a high volume of complex surgeries (over 40
cardiac procedures a day across the group), fixed overheads per
patient are reduced to minimal levels
Procurement Leverage
NH negotiates bulk prices for
consumables, stents, and diagnostic
reagents based on sheer patient volume
The Result
The cost savings are passed on to patients
in the form of low, predictable all-inclusive
package pricing
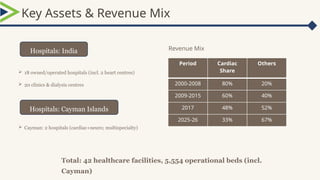
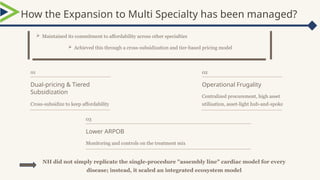
How the Expansionto Multi Specialty has been managed?
01
Dual-pricing & Tiered
Subsidization
Cross-subsidize to keep affordability
02
Operational Frugality
Centralized procurement, high asset
utilisation, asset-light hub-and-spoke
03
Lower ARPOB
Monitoring and controls on the treatment mix
NH did not simply replicate the single-procedure "assembly line" cardiac model for every
disease; instead, it scaled an integrated ecosystem model
Maintained its commitment to affordability across other specialties
Achieved this through a cross-subsidization and tier-based pricing model
12.
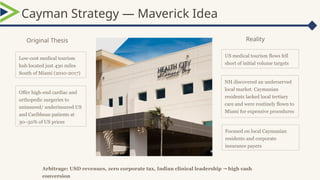
Cayman Strategy —Maverick Idea
US medical tourism flows fell
short of initial volume targets
NH discovered an underserved
local market. Caymanian
residents lacked local tertiary
care and were routinely flown to
Miami for expensive procedures
Original Thesis
Focused on local Caymanian
residents and corporate
insurance payers
Reality
Arbitrage: USD revenues, zero corporate tax, Indian clinical leadership high cash
→
conversion
Low-cost medical tourism
hub located just 430 miles
South of Miami (2010-2017)
Offer high-end cardiac and
orthopedic surgeries to
uninsured/ underinsured US
and Caribbean patients at
30–50% of US prices
13.
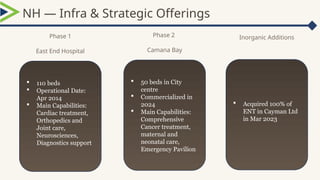
NH — Infra& Strategic Offerings
Phase 1
East End Hospital
Phase 2
Camana Bay
Inorganic Additions
110 beds
Operational Date:
Apr 2014
Main Capabilities:
Cardiac treatment,
Orthopedics and
Joint care,
Neurosciences,
Diagnostics support
50 beds in City
centre
Commercialized in
2024
Main Capabilities:
Comprehensive
Cancer treatment,
maternal and
neonatal care,
Emergency Pavilion
Acquired 100% of
ENT in Cayman Ltd
in Mar 2023
14.
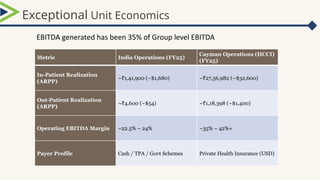
Exceptional Unit Economics
EBITDAgenerated has been 35% of Group level EBITDA
Metric India Operations (FY25)
Cayman Operations (HCCI)
(FY25)
In-Patient Realization
(ARPP)
~ 1,41,900 (~$1,680)
₹ ~ 27,56,982 (~$32,600)
₹
Out-Patient Realization
(ARPP)
~ 4,600 (~$54)
₹ ~ 1,18,398 (~$1,400)
₹
Operating EBITDA Margin ~22.5% – 24% ~35% – 42%+
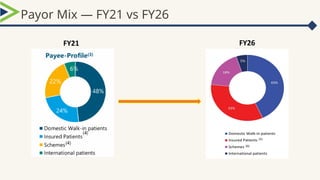
Payer Profile Cash / TPA / Govt Schemes Private Health Insurance (USD)
15.
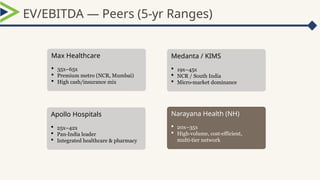
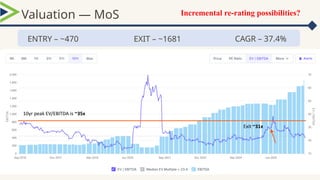
EV/EBITDA — Peers(5‑yr Ranges)
Max Healthcare
35x–65x
Premium metro (NCR, Mumbai)
High cash/insurance mix
Apollo Hospitals
25x–42x
Pan India leader
‑
Integrated healthcare & pharmacy
Medanta / KIMS
19x–45x
NCR / South India
Micro market dominance
‑
Narayana Health (NH)
20x–35x
High volume, cost efficient,
‑ ‑
multi tier network
‑
16.
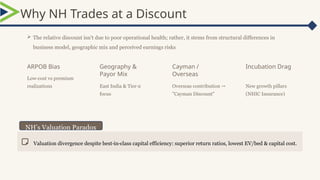
Why NH Tradesat a Discount
Incubation Drag
New growth pillars
(NHIC Insurance)
ARPOB Bias
Low cost vs premium
‑
realizations
Geography &
Payor Mix
East India & Tier 2
‑
focus
Cayman /
Overseas
Overseas contribution →
"Cayman Discount"
Valuation divergence despite best in class capital efficiency: superior return ratios, lowest EV/bed & capital cost.
‑ ‑
The relative discount isn't due to poor operational health; rather, it stems from structural differences in
business model, geographic mix and perceived earnings risks
NH’s Valuation Paradox
17.
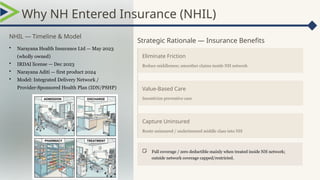
Strategic Rationale —Insurance Benefits
Eliminate Friction
Reduce middlemen; smoother claims inside NH network
Value‑Based Care
Incentivize preventive care
Capture Uninsured
Route uninsured / underinsured middle class into NH
Full coverage / zero deductible mainly when treated inside NH network;
outside network coverage capped/restricted.
NHIL — Timeline & Model
• Narayana Health Insurance Ltd — May 2023
(wholly owned)
• IRDAI license — Dec 2023
• Narayana Aditi — first product 2024
• Model: Integrated Delivery Network /
Provider Sponsored Health Plan (IDN/PSHP)
‑
Why NH Entered Insurance (NHIL)
18.
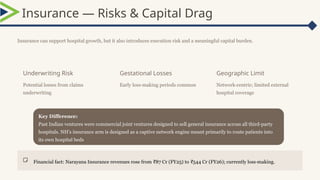
Insurance — Risks& Capital Drag
Insurance can support hospital growth, but it also introduces execution risk and a meaningful capital burden.
Underwriting Risk
Potential losses from claims
underwriting
Gestational Losses
Early loss making periods common
‑
Geographic Limit
Network centric; limited external
‑
hospital coverage
Financial fact: Narayana Insurance revenues rose from 87 Cr (FY25) to 544 Cr (FY26); currently loss making.
₹ ₹ ‑
Key Difference:
Past Indian ventures were commercial joint ventures designed to sell general insurance across all third-party
hospitals. NH's insurance arm is designed as a captive network engine meant primarily to route patients into
its own hospital beds
19.
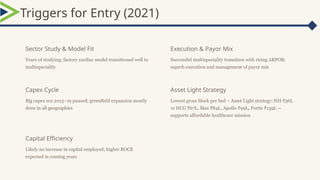
Triggers for Entry(2021)
Sector Study & Model Fit
Years of studying; factory cardiac model transitioned well to
multispeciality
Execution & Payor Mix
Successful multispeciality transition with rising ARPOB;
superb execution and management of payor mix
Capex Cycle
Big capex era 2013–19 paused; greenfield expansion mostly
done in all geographies
Asset Light Strategy
Lowest gross block per bed – Asset Light strategy; NH 36L
₹
vs HCG 67L, Max 84L, Apollo 99L, Fortis 139L —
₹ ₹ ₹ ₹
supports affordable healthcare mission
Capital Efficiency
Likely no increase in capital employed; higher ROCE
expected in coming years
20.
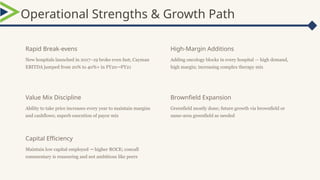
Operational Strengths &Growth Path
Rapid Break-evens
New hospitals launched in 2017–19 broke even fast; Cayman
EBITDA jumped from 20% to 40%+ in FY20 FY21
→
High-Margin Additions
Adding oncology blocks in every hospital — high demand,
high margin; increasing complex therapy mix
Value Mix Discipline
Ability to take price increases every year to maintain margins
and cashflows; superb execution of payor mix
Brownfield Expansion
Greenfield mostly done; future growth via brownfield or
same-area greenfield as needed
Capital Efficiency
Maintain low capital employed higher ROCE; concall
→
commentary is reassuring and not ambitious like peers
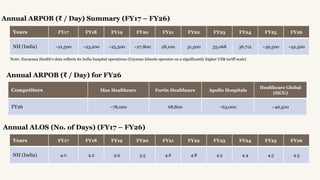
Years FY17 FY18FY19 FY20 FY21 FY22 FY23 FY24 FY25 FY26
NH (India) ~21,500 ~23,200 ~25,500 ~27,800 28,100 31,500 35,068 36,712 ~39,500 ~42,500
Annual ARPOB ( / Day) Summary (FY17 – FY26)
₹
Note: Narayana Health's data reflects its India hospital operations (Cayman Islands operates on a significantly higher US$ tariff scale)
Competitors Max Healthcare Fortis Healthcare Apollo Hospitals
Healthcare Global
(HCG)
FY26 ~78,000 68,800 ~63,000 ~46,500
Annual ARPOB ( / Day) for FY26
₹
Annual ALOS (No. of Days) (FY17 – FY26)
Years FY17 FY18 FY19 FY20 FY21 FY22 FY23 FY24 FY25 FY26
NH (India) 4.0 4.2 3.9 3.5 4.6 4.8 4.5 4.4 4.5 4.3
26.
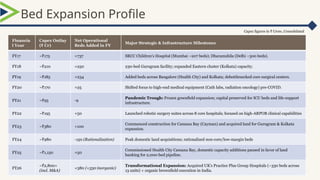
Bed Expansion Profile
Capexfigures in Crore, Consolidated
₹
Financia
l Year
Capex Outlay
( Cr)
₹
Net Operational
Beds Added in FY
Major Strategic & Infrastructure Milestones
FY17 ~ 175
₹ +737 SRCC Children’s Hospital (Mumbai ~207 beds); Dharamshila (Delhi ~300 beds).
FY18 ~ 210
₹ +250 230-bed Gurugram facility; expanded Eastern cluster (Kolkata) capacity.
FY19 ~ 185
₹ +234 Added beds across Bangalore (Health City) and Kolkata; debottlenecked core surgical centers.
FY20 ~ 170
₹ +25 Shifted focus to high-end medical equipment (Cath labs, radiation oncology) pre-COVID.
FY21 ~ 95
₹ -9
Pandemic Trough: Frozen greenfield expansion; capital preserved for ICU beds and life-support
infrastructure.
FY22 ~ 195
₹ +50 Launched robotic surgery suites across 8 core hospitals; focused on high-ARPOB clinical capabilities
FY23 ~ 380
₹ +100
Commenced construction for Camana Bay (Cayman) and acquired land for Gurugram & Kolkata
expansion.
FY24 ~ 980
₹ -150 (Rationalization) Peak domestic land acquisitions; rationalized non-core/low-margin beds
FY25 ~ 1,150
₹ +50
Commissioned Health City Camana Bay, domestic capacity additions paused in favor of land
banking for 2,000-bed pipeline.
FY26
~ 2,800+
₹
(incl. M&A)
+380 (+330 inorganic)
Transformational Expansion: Acquired UK's Practice Plus Group Hospitals (~330 beds across
13 units) + organic brownfield execution in India.
27.
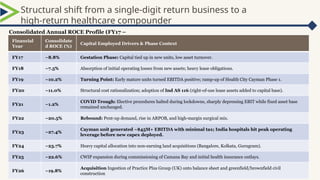
Structural shift froma single-digit return business to a
high-return healthcare compounder
Consolidated Annual ROCE Profile (FY17 –
FY26)
Financial
Year
Consolidate
d ROCE (%)
Capital Employed Drivers & Phase Context
FY17 ~8.8% Gestation Phase: Capital tied up in new units, low asset turnover.
FY18 ~7.5% Absorption of initial operating losses from new assets; heavy lease obligations.
FY19 ~10.2% Turning Point: Early mature units turned EBITDA positive; ramp-up of Health City Cayman Phase 1.
FY20 ~11.0% Structural cost rationalization; adoption of Ind AS 116 (right-of-use lease assets added to capital base).
FY21 ~1.2%
COVID Trough: Elective procedures halted during lockdowns, sharply depressing EBIT while fixed asset base
remained unchanged.
FY22 ~20.5% Rebound: Pent-up demand, rise in ARPOB, and high-margin surgical mix.
FY23 ~27.4%
Cayman unit generated ~$45M+ EBITDA with minimal tax; India hospitals hit peak operating
leverage before new capex deployed.
FY24 ~23.7% Heavy capital allocation into non-earning land acquisitions (Bangalore, Kolkata, Gurugram).
FY25 ~22.6% CWIP expansion during commissioning of Camana Bay and initial health insurance outlays.
FY26 ~19.8%
Acquisition Ingestion of Practice Plus Group (UK) onto balance sheet and greenfield/brownfield civil
construction
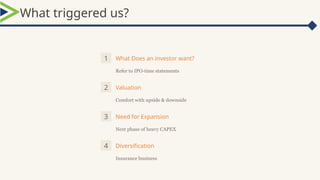
1 What Doesan investor want?
Refer to IPO-time statements
2 Valuation
Comfort with upside & downside
3 Need for Expansion
Next phase of heavy CAPEX
4 Diversification
Insurance business
What triggered us?
30.
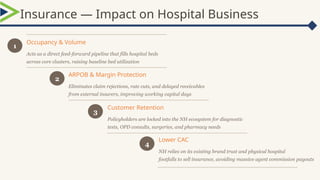
Insurance — Impacton Hospital Business
Occupancy & Volume
Acts as a direct feed-forward pipeline that fills hospital beds
across core clusters, raising baseline bed utilization
ARPOB & Margin Protection
Eliminates claim rejections, rate cuts, and delayed receivables
from external insurers, improving working capital days
Customer Retention
Policyholders are locked into the NH ecosystem for diagnostic
tests, OPD consults, surgeries, and pharmacy needs
Lower CAC
NH relies on its existing brand trust and physical hospital
footfalls to sell insurance, avoiding massive agent commission payouts
1
2
3
4
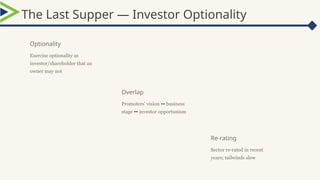
The Last Supper— Investor Optionality
Overlap
Promoters' vision ↔ business
stage ↔ investor opportunism
Re-rating
Sector re-rated in recent
years; tailwinds slow
Optionality
Exercise optionality as
investor/shareholder that an
owner may not
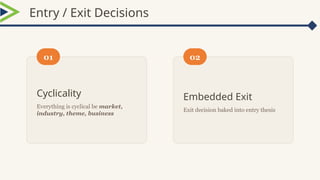
33.
Cyclicality
Everything is cyclicalbe market,
industry, theme, business
Embedded Exit
Exit decision baked into entry thesis
Entry / Exit Decisions
01 02

 Most read

 Most read