MODEL IDENTIFICATION
• Wehave learned a large class of linear
parametric models for stationary time series
processes.
• Now, the question is how we can find out the
best suitable model for a given observed
series. How to choose the appropriate model
(on order of p and q).
2
3.
MODEL IDENTIFICATION
• ACFand PACF show specific properties for
specific models. Hence, we can use them as a
criteria to identify the suitable model.
• Using the patterns of sample ACF and sample
PACF, we can identify the model.
3
4.
MODEL SELECTION THROUGHCRITERIA
• Besides sACF and sPACF plots, we have also other
tools for model identification.
• With messy real data, sACF and sPACF plots
become complicated and harder to interpret.
• Don’t forget to choose the best model with as few
parameters as possible.
• It will be seen that many different models can fit
to the same data so that we should choose the
most appropriate (with less parameters) one and
the information criteria will help us to decide this.
4
5.
MODEL SELECTION THROUGHCRITERIA
• The three well-known information criteria are
– Akaike’s information criterion (AIC) (Akaike, 1974)
– Schwarz’s Bayesian Criterion (SBC) (Schwarz, 1978).
Also known as Bayesian Information Criterion (BIC)
– Hannan-Quinn Criteria (HQIC) (Hannan&Quinn,
1979)
5
6.
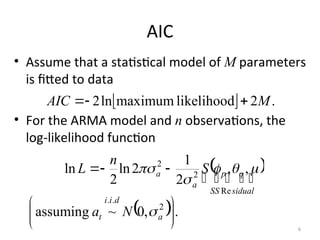
AIC
• Assume thata statistical model of M parameters
is fitted to data
• For the ARMA model and n observations, the
log-likelihood function
.
2
likelihood
maximum
ln
2 M
AIC
sidual
SS
q
p
a
a S
n
L
Re
2
2
,
,
2
1
2
ln
2
ln
.
,
0
~
assuming 2
.
.
a
d
i
i
t N
a
6
7.
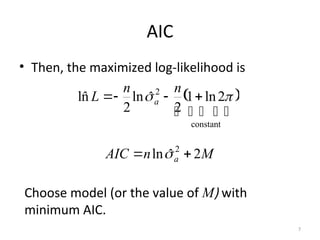
AIC
• Then, themaximized log-likelihood is
constant
2
2
ln
1
2
ˆ
ln
2
n̂
l
n
n
L a
M
n
AIC a 2
ˆ
ln 2
Choose model (or the value of M) with
minimum AIC.
7
8.
SBC
• The Bayesianinformation criterion (BIC) or
Schwarz Criterion (also SBC, SBIC) is a criterion
for model selection among a class of
parametric models with different numbers of
parameters.
• When estimating model parameters using
maximum likelihood estimation, it is possible
to increase the likelihood by adding additional
parameters, which may result in overfitting.
The BIC resolves this problem by introducing a
penalty term for the number of parameters in
the model.
8
9.
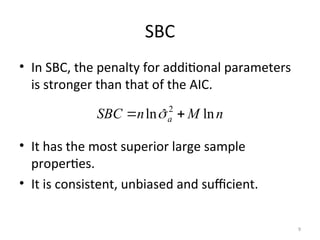
SBC
• In SBC,the penalty for additional parameters
is stronger than that of the AIC.
• It has the most superior large sample
properties.
• It is consistent, unbiased and sufficient.
n
M
n
SBC a ln
ˆ
ln 2
9
10.
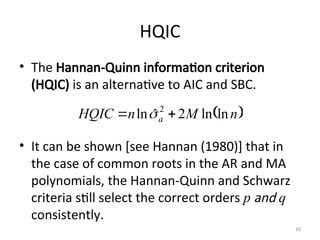
HQIC
• The Hannan-Quinninformation criterion
(HQIC) is an alternative to AIC and SBC.
• It can be shown [see Hannan (1980)] that in
the case of common roots in the AR and MA
polynomials, the Hannan-Quinn and Schwarz
criteria still select the correct orders p and q
consistently.
n
M
n
HQIC a ln
ln
2
ˆ
ln 2
10
11.
THE INVERSE AUTOCORRELATION
FUNCTION
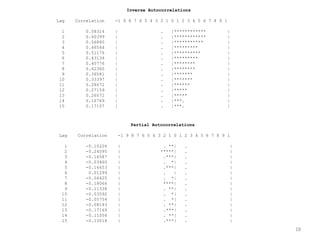
•The sample inverse autocorrelation function
(SIACF) plays much the same role in ARIMA
modeling as the sample partial
autocorrelation function (SPACF), but it
generally indicates subset and seasonal
autoregressive models better than the SPACF.
11
12.
THE INVERSE AUTOCORRELATION
FUNCTION
•Additionally, the SIACF can be useful for detecting
over-differencing. If the data come from a
nonstationary or nearly nonstationary model, the
SIACF has the characteristics of a noninvertible
moving-average. Likewise, if the data come from a
model with a noninvertible moving average, then
the SIACF has nonstationary characteristics and
therefore decays slowly. In particular, if the data
have been over-differenced, the SIACF looks like a
SACF from a nonstationary process
12
13.
THE INVERSE AUTOCORRELATION
FUNCTION
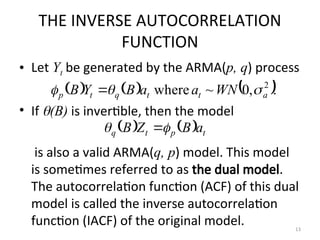
•Let Yt be generated by the ARMA(p, q) process
• If (B) is invertible, then the model
is also a valid ARMA(q, p) model. This model
is sometimes referred to as the dual model.
The autocorrelation function (ACF) of this dual
model is called the inverse autocorrelation
function (IACF) of the original model.
.
,
0
~
where 2
a
t
t
q
t
p WN
a
a
B
Y
B
t
p
t
q a
B
Z
B
13
14.
THE INVERSE AUTOCORRELATION
FUNCTION
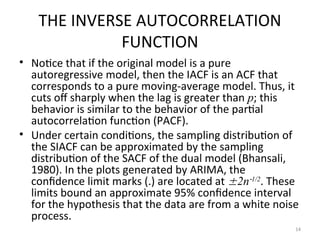
•Notice that if the original model is a pure
autoregressive model, then the IACF is an ACF that
corresponds to a pure moving-average model. Thus, it
cuts off sharply when the lag is greater than p; this
behavior is similar to the behavior of the partial
autocorrelation function (PACF).
• Under certain conditions, the sampling distribution of
the SIACF can be approximated by the sampling
distribution of the SACF of the dual model (Bhansali,
1980). In the plots generated by ARIMA, the
confidence limit marks (.) are located at 2n1/2
. These
limits bound an approximate 95% confidence interval
for the hypothesis that the data are from a white noise
process.
14
THE EXTENDED SAMPLE
AUTOCORRELATIONFUNCTION_ESACF
• The extended sample autocorrelation function
(ESACF) method can tentatively identify the
orders of a stationary or nonstationary ARMA
process based on iterated least squares
estimates of the autoregressive parameters.
Tsay and Tiao (1984) proposed the technique.
19
20.
ESACF
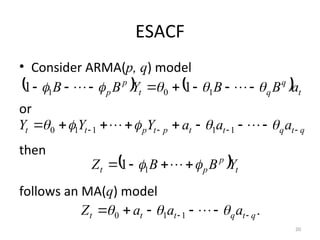
• Consider ARMA(p,q) model
or
then
follows an MA(q) model
20
t
q
q
t
p
p a
B
B
Y
B
B
1
0
1 1
1
q
t
q
t
t
p
t
p
t
t a
a
a
Y
Y
Y
1
1
1
1
0
t
p
p
t Y
B
B
Z
1
1
.
1
1
0 q
t
q
t
t
t a
a
a
Z
21.
ESACF
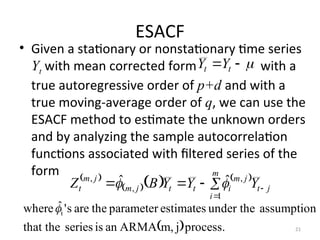
• Given astationary or nonstationary time series
Yt with mean corrected form with a
true autoregressive order of p+d and with a
true moving-average order of q, we can use the
ESACF method to estimate the unknown orders
and by analyzing the sample autocorrelation
functions associated with filtered series of the
form
21
t
t Y
Y
m
i
j
t
j
m
i
t
t
j
m
j
m
t Y
Y
Y
B
Z
1
,
,
, ˆ
ˆ
process.
j
m,
ARMA
an
is
series
that the
assumption
under the
estimates
parameter
the
are
s
'
ˆ
where i
22.
ESACF
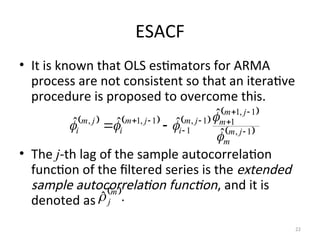
• It isknown that OLS estimators for ARMA
process are not consistent so that an iterative
procedure is proposed to overcome this.
• The j-th lag of the sample autocorrelation
function of the filtered series is the extended
sample autocorrelation function, and it is
denoted as
22
1
,
1
,
1
1
1
,
1
1
,
1
,
ˆ
ˆ
ˆ
ˆ
ˆ
j
m
m
j
m
m
j
m
i
j
m
i
j
m
i
.
ˆ m
j
ESACF
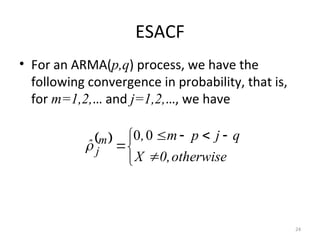
• For anARMA(p,q) process, we have the
following convergence in probability, that is,
for m=1,2,… and j=1,2,…, we have
24
otherwise
0,
X
q
j
p
m
,
ˆ m
j
0
0
25.
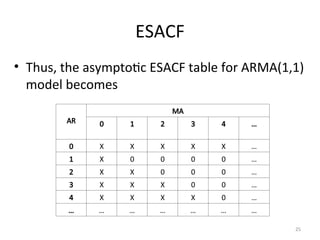
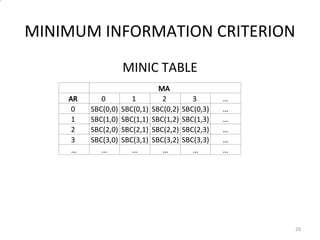
ESACF
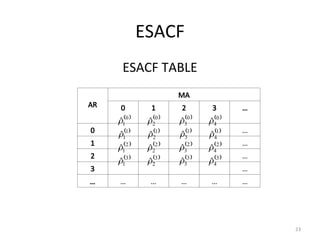
• Thus, theasymptotic ESACF table for ARMA(1,1)
model becomes
25
AR
MA
0 1 2 3 4 …
0 X X X X X …
1 X 0 0 0 0 …
2 X X 0 0 0 …
3 X X X 0 0 …
4 X X X X 0 …
… … … … … … …
26.
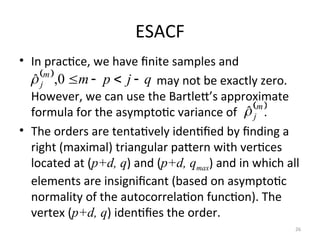
ESACF
• In practice,we have finite samples and
may not be exactly zero.
However, we can use the Bartlett’s approximate
formula for the asymptotic variance of .
• The orders are tentatively identified by finding a
right (maximal) triangular pattern with vertices
located at (p+d, q) and (p+d, qmax) and in which all
elements are insignificant (based on asymptotic
normality of the autocorrelation function). The
vertex (p+d, q) identifies the order.
26
q
j
p
m
m
j
0
,
̂
m
j
̂
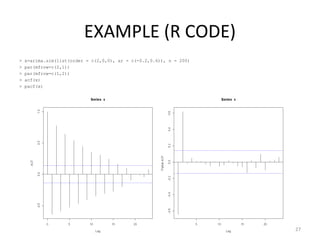
27.
EXAMPLE (R CODE)
>x=arima.sim(list(order = c(2,0,0), ar = c(-0.2,0.6)), n = 200)
> par(mfrow=c(2,1))
> par(mfrow=c(1,2))
> acf(x)
> pacf(x)
27
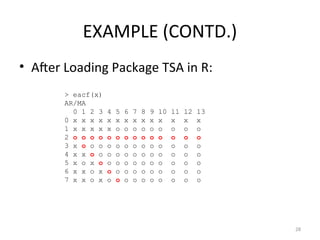
28.
EXAMPLE (CONTD.)
• AfterLoading Package TSA in R:
28
> eacf(x)
AR/MA
0 1 2 3 4 5 6 7 8 9 10 11 12 13
0 x x x x x x x x x x x x x x
1 x x x x x o o o o o o o o o
2 o o o o o o o o o o o o o o
3 x o o o o o o o o o o o o o
4 x x o o o o o o o o o o o o
5 x o x o o o o o o o o o o o
6 x x o x o o o o o o o o o o
7 x x o x o o o o o o o o o o
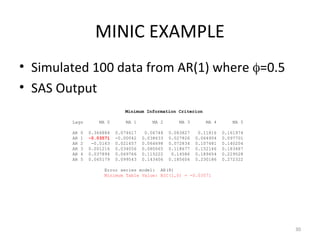
MINIC EXAMPLE
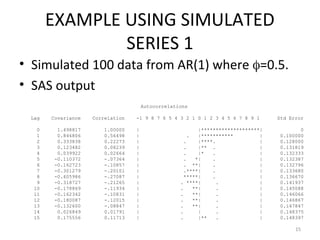
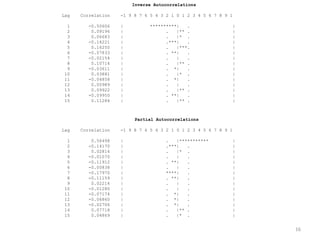
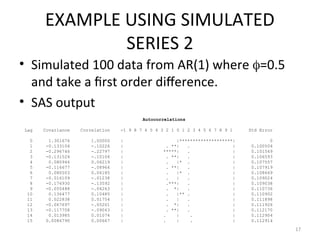
• Simulated100 data from AR(1) where =0.5
• SAS Output
30
Minimum Information Criterion
Lags MA 0 MA 1 MA 2 MA 3 MA 4 MA 5
AR 0 0.366884 0.074617 0.06748 0.083827 0.11816 0.161974
AR 1 -0.03571 -0.00042 0.038633 0.027826 0.064904 0.097701
AR 2 -0.0163 0.021657 0.064698 0.072834 0.107481 0.140204
AR 3 0.001216 0.034056 0.080065 0.118677 0.152146 0.183487
AR 4 0.037894 0.069766 0.115222 0.14586 0.189454 0.229528
AR 5 0.065179 0.099543 0.143406 0.185604 0.230186 0.272322
Error series model: AR(8)
Minimum Table Value: BIC(1,0) = -0.03571
NON-STATIONARY TIME SERIES
MODELS
•Inspection of the ACF serves as a rough
indicator of whether a trend is present in a
series. A slow decay in ACF is indicative of a
large characteristic root; a true unit root
process, or a trend stationary process.
• Formal tests can help to determine whether a
system contains a trend and whether the
trend is deterministic or stochastic.
32
DETERMINISTIC TREND
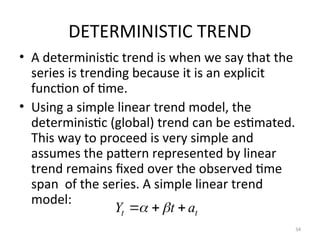
• Adeterministic trend is when we say that the
series is trending because it is an explicit
function of time.
• Using a simple linear trend model, the
deterministic (global) trend can be estimated.
This way to proceed is very simple and
assumes the pattern represented by linear
trend remains fixed over the observed time
span of the series. A simple linear trend
model:
34
t
t a
t
Y
35.
DETERMINISTIC TREND
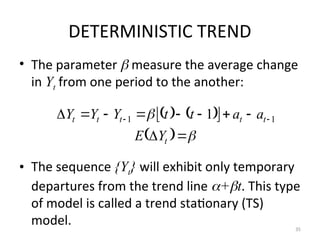
• Theparameter measure the average change
in Yt from one period to the another:
• The sequence {Yt} will exhibit only temporary
departures from the trend line +t. This type
of model is called a trend stationary (TS)
model. 35
t
t
t
t
t
t
Y
E
a
a
t
t
Y
Y
Y 1
1 1
TREND STATIONARY
• Ifa series has a deterministic time trend, then
we simply regress Yt on an intercept and a
time trend (t=1,2,…,n) and save the residuals.
The residuals are detrended series. If Yt is
stochastic, we do not necessarily get
stationary series.
37
38.
DETERMINISTIC TREND
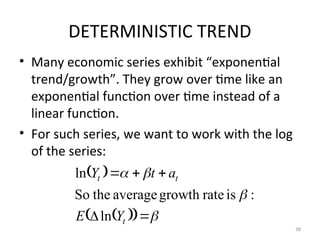
• Manyeconomic series exhibit “exponential
trend/growth”. They grow over time like an
exponential function over time instead of a
linear function.
• For such series, we want to work with the log
of the series:
38
t
t
t
Y
E
a
t
Y
ln
:
is
rate
growth
average
the
So
ln
39.
DETERMINISTIC TREND
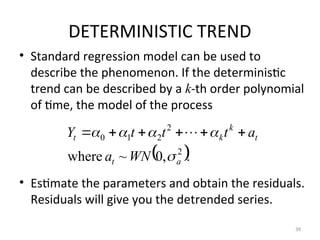
• Standardregression model can be used to
describe the phenomenon. If the deterministic
trend can be described by a k-th order polynomial
of time, the model of the process
• Estimate the parameters and obtain the residuals.
Residuals will give you the detrended series.
39
.
,
0
~
where 2
2
2
1
0
a
t
t
k
k
t
WN
a
a
t
t
t
Y
40.
DETERMINISTIC TREND
• Thismodel has a short memory.
• If a shock hits a series, it goes back to
trend level in short time. Hence, the best
forecasts are not affected.
• Rarely model like this is useful in practice.
A more realistic model involves stochastic
(local) trend.
40
41.
STOCHASTIC TREND
• Amore modern approach is to consider
trends in time series as a variable. A variable
trend exists when a trend changes in an
unpredictable way. Therefore, it is considered
as stochastic.
41
42.
STOCHASTIC TREND
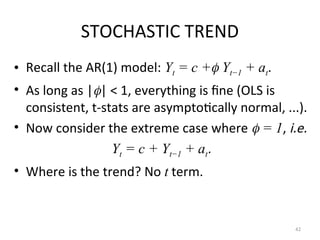
• Recallthe AR(1) model: Yt = c + Yt−1 + at.
• As long as || < 1, everything is fine (OLS is
consistent, t-stats are asymptotically normal, ...).
• Now consider the extreme case where = 1, i.e.
Yt = c + Yt−1 + at.
• Where is the trend? No t term.
42
43.
STOCHASTIC TREND
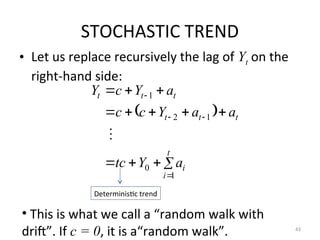
• Letus replace recursively the lag of Yt on the
right-hand side:
43
t
i
i
t
t
t
t
t
t
a
Y
tc
a
a
Y
c
c
a
Y
c
Y
1
0
1
2
1
Deterministic trend
• This is what we call a “random walk with
drift”. If c = 0, it is a“random walk”.
44.
STOCHASTIC TREND
• Eachai shock represents shift in the intercept.
Since all values of {ai} have a coefficient of unity,
the effect of each shock on the intercept term is
permanent.
• In the time series literature, such a sequence is
said to have a stochastic trend since each ai
shock imparts a permanent and random change
in the conditional mean of the series. To be able
to define this situation, we use Autoregressive
Integrated Moving Average (ARIMA) models.
44
45.
DETERMINISTIC VS STOCHASTICTREND
• They might appear similar since they both lead to
growth over time but they are quite different.
• To see why, suppose that through any policies,
you got a bigger Yt because the noise at is big.
What will happen next period?
– With a deterministic trend, Yt+1 = c +(t+1)+at+1.
The noise at is not affecting Yt+1. Your policy had a
one period impact.
– With a stochastic trend, Yt+1 = c + Yt + at+1 = c +
(c + Yt−1 + at) + at+1. The noise at is affecting Yt+1.
In fact, the policy will have a permanent impact.
45
46.
DETERMINISTIC VS STOCHASTICTREND
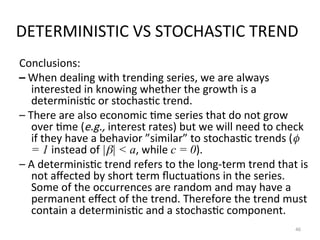
Conclusions:
– When dealing with trending series, we are always
interested in knowing whether the growth is a
deterministic or stochastic trend.
– There are also economic time series that do not grow
over time (e.g., interest rates) but we will need to check
if they have a behavior ”similar” to stochastic trends (
= 1 instead of || < a, while c = 0).
– A deterministic trend refers to the long-term trend that is
not affected by short term fluctuations in the series.
Some of the occurrences are random and may have a
permanent effect of the trend. Therefore the trend must
contain a deterministic and a stochastic component.
46
47.
DETERMINISTIC TREND EXAMPLE
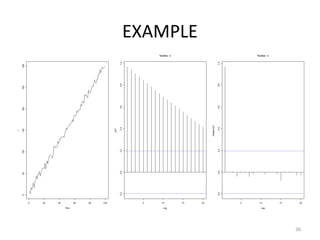
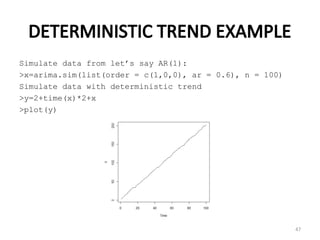
Simulatedata from let’s say AR(1):
>x=arima.sim(list(order = c(1,0,0), ar = 0.6), n = 100)
Simulate data with deterministic trend
>y=2+time(x)*2+x
>plot(y)
47
48.
DETERMINISTIC TREND EXAMPLE
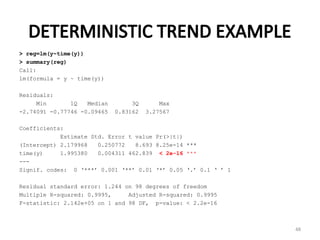
>reg=lm(y~time(y))
> summary(reg)
Call:
lm(formula = y ~ time(y))
Residuals:
Min 1Q Median 3Q Max
-2.74091 -0.77746 -0.09465 0.83162 3.27567
Coefficients:
Estimate Std. Error t value Pr(>|t|)
(Intercept) 2.179968 0.250772 8.693 8.25e-14 ***
time(y) 1.995380 0.004311 462.839 < 2e-16 ***
---
Signif. codes: 0 ‘***’ 0.001 ‘**’ 0.01 ‘*’ 0.05 ‘.’ 0.1 ‘ ’ 1
Residual standard error: 1.244 on 98 degrees of freedom
Multiple R-squared: 0.9995, Adjusted R-squared: 0.9995
F-statistic: 2.142e+05 on 1 and 98 DF, p-value: < 2.2e-16
48
49.
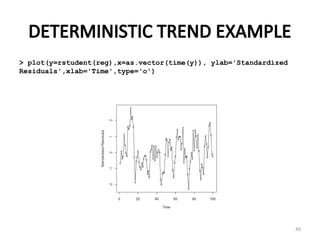
DETERMINISTIC TREND EXAMPLE
>plot(y=rstudent(reg),x=as.vector(time(y)), ylab='Standardized
Residuals',xlab='Time',type='o')
49
STOCHASTIC TREND EXAMPLE
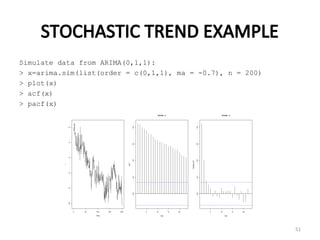
Simulatedata from ARIMA(0,1,1):
> x=arima.sim(list(order = c(0,1,1), ma = -0.7), n = 200)
> plot(x)
> acf(x)
> pacf(x)
51
52.
AUTOREGRESSIVE INTEGRATED
MOVING AVERAGE(ARIMA) PROCESSES
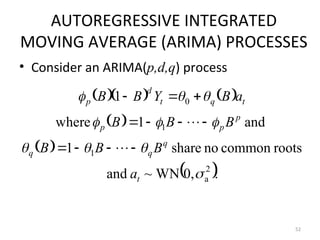
• Consider an ARIMA(p,d,q) process
52
.
0,
WN
~
and
roots
common
no
share
1
and
1
where
1
2
a
1
1
0
t
q
q
q
p
p
p
t
q
t
d
p
a
B
B
B
B
B
B
a
B
Y
B
B
53.
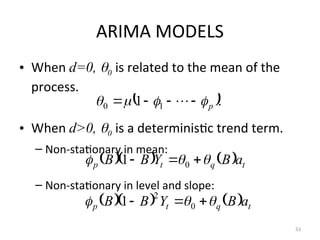
ARIMA MODELS
• Whend=0, 0 is related to the mean of the
process.
• When d>0, 0 is a deterministic trend term.
– Non-stationary in mean:
– Non-stationary in level and slope:
53
.
1 1
0 p
t
q
t
p a
B
Y
B
B
0
1
t
q
t
p a
B
Y
B
B
0
2
1
54.
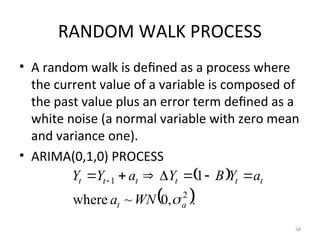
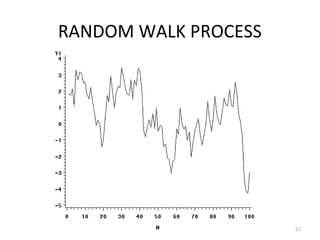
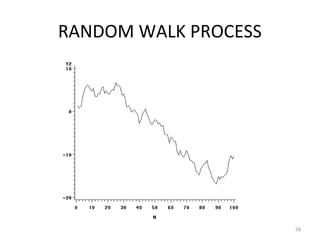
RANDOM WALK PROCESS
•A random walk is defined as a process where
the current value of a variable is composed of
the past value plus an error term defined as a
white noise (a normal variable with zero mean
and variance one).
• ARIMA(0,1,0) PROCESS
54
.
,
0
~
where
1
2
1
a
t
t
t
t
t
t
t
WN
a
a
Y
B
Y
a
Y
Y
55.
RANDOM WALK PROCESS
•Behavior of stock market.
• Brownian motion.
• Movement of a drunken men.
• It is a limiting process of AR(1).
55
56.
RANDOM WALK PROCESS
•The implication of a process of this type is that the
best prediction of Y for next period is the current
value, or in other words the process does not allow to
predict the change (YtYt-1). That is, the change of Y is
absolutely random.
• It can be shown that the mean of a random walk
process is constant but its variance is not. Therefore a
random walk process is nonstationary, and its variance
increases with t.
• In practice, the presence of a random walk process
makes the forecast process very simple since all the
future values of Yt+s for s > 0, is simply Yt.
56
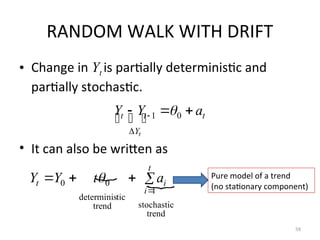
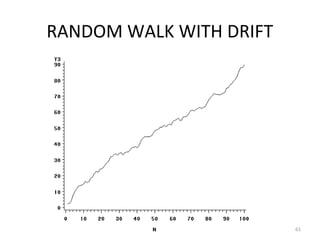
RANDOM WALK WITHDRIFT
• Change in Yt is partially deterministic and
partially stochastic.
• It can also be written as
59
t
Y
t
t a
Y
Y
t
0
1
trend
stochastic
1
trend
tic
determinis
0
0
t
i
i
t a
t
Y
Y Pure model of a trend
(no stationary component)
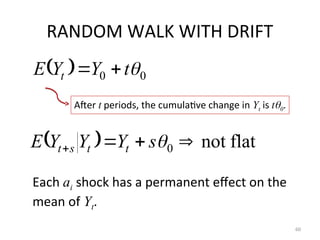
60.
RANDOM WALK WITHDRIFT
60
0
0
t
Y
Y
E t
After t periods, the cumulative change in Yt is t0.
flat
not
0
s
Y
Y
Y
E t
t
s
t
Each ai shock has a permanent effect on the
mean of Yt.
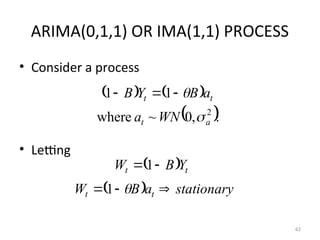
ARIMA(0,1,1) OR IMA(1,1)PROCESS
• Consider a process
• Letting
62
.
,
0
~
where
1
1
2
a
t
t
t
WN
a
a
B
Y
B
t
t Y
B
W
1
stationary
a
B
W t
t
1
63.
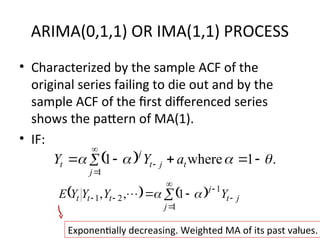
ARIMA(0,1,1) OR IMA(1,1)PROCESS
• Characterized by the sample ACF of the
original series failing to die out and by the
sample ACF of the first differenced series
shows the pattern of MA(1).
• IF:
63
.
1
where
1
1
t
j
j
t
j
t a
Y
Y
1
1
2
1 1
,
,
j
j
t
j
t
t
t Y
Y
Y
Y
E
Exponentially decreasing. Weighted MA of its past values.
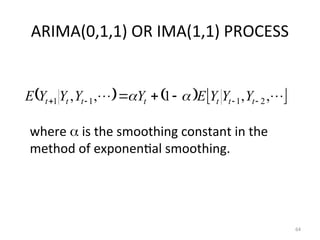
64.
ARIMA(0,1,1) OR IMA(1,1)PROCESS
64
,
,
1
,
, 2
1
1
1
t
t
t
t
t
t
t Y
Y
Y
E
Y
Y
Y
Y
E
where is the smoothing constant in the
method of exponential smoothing.
65.
REMOVING THE TREND
•Shocks to a stationary time series are
temporary over time. The series revert to its
long-run mean.
• A series containing a trend will not revert to a
long-run mean. The usual methods for
eliminating the trend are detrending and
differencing.
65
66.
DETRENDING
• Detrending isused to remove deterministic
trend.
• Regress Yt on time and save the residuals.
• Then, check whether residuals are stationary.
66
67.
DIFFERENCING
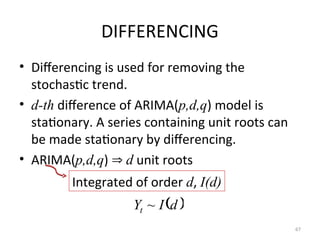
• Differencing isused for removing the
stochastic trend.
• d-th difference of ARIMA(p,d,q) model is
stationary. A series containing unit roots can
be made stationary by differencing.
• ARIMA(p,d,q) d unit roots
67
Integrated of order d, I(d)
d
I
Yt ~
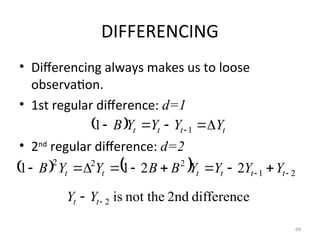
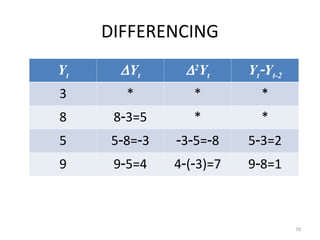
DIFFERENCING
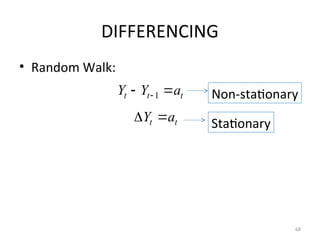
• Differencing alwaysmakes us to loose
observation.
• 1st regular difference: d=1
• 2nd
regular difference: d=2
69
t
t
t
t Y
Y
Y
Y
B
1
1
2
1
2
2
2
2
2
1
1
t
t
t
t
t
t Y
Y
Y
Y
B
B
Y
Y
B
difference
2nd
not the
is
2
t
t Y
Y
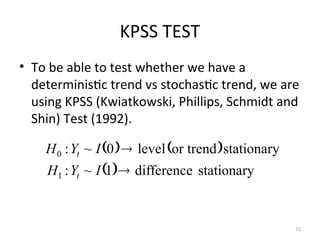
KPSS TEST
• Tobe able to test whether we have a
deterministic trend vs stochastic trend, we are
using KPSS (Kwiatkowski, Phillips, Schmidt and
Shin) Test (1992).
71
stationary
difference
1
~
:
stationary
or trend
level
0
~
:
1
0
I
Y
H
I
Y
H
t
t
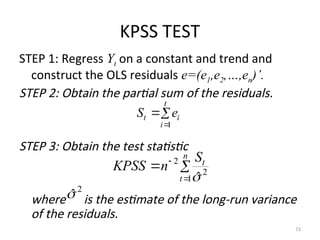
72.
KPSS TEST
STEP 1:Regress Yt on a constant and trend and
construct the OLS residuals e=(e1,e2,…,en)’.
STEP 2: Obtain the partial sum of the residuals.
STEP 3: Obtain the test statistic
where is the estimate of the long-run variance
of the residuals.
72
t
i
i
t e
S
1
n
t
t
S
n
KPSS
1
2
2
ˆ
2
ˆ
73.
KPSS TEST
• STEP4: Reject H0 when KPSS is large, because
that is the evidence that the series wander
from its mean.
• Asymptotic distribution of the test statistic
uses the standard Brownian bridge.
• It is the most powerful unit root test but if
there is a volatility shift it cannot catch this
type non-stationarity.
73
74.
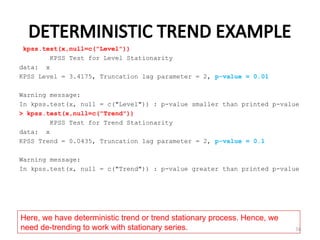
DETERMINISTIC TREND EXAMPLE
kpss.test(x,null=c("Level"))
KPSSTest for Level Stationarity
data: x
KPSS Level = 3.4175, Truncation lag parameter = 2, p-value = 0.01
Warning message:
In kpss.test(x, null = c("Level")) : p-value smaller than printed p-value
> kpss.test(x,null=c("Trend"))
KPSS Test for Trend Stationarity
data: x
KPSS Trend = 0.0435, Truncation lag parameter = 2, p-value = 0.1
Warning message:
In kpss.test(x, null = c("Trend")) : p-value greater than printed p-value
74
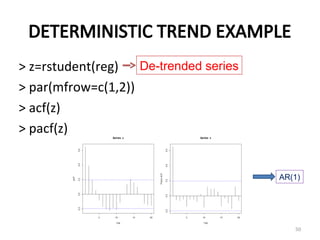
Here, we have deterministic trend or trend stationary process. Hence, we
need de-trending to work with stationary series.
75.
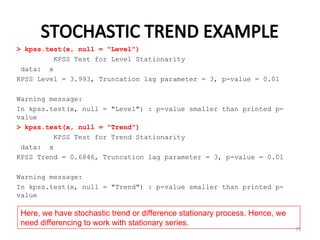
STOCHASTIC TREND EXAMPLE
>kpss.test(x, null = "Level")
KPSS Test for Level Stationarity
data: x
KPSS Level = 3.993, Truncation lag parameter = 3, p-value = 0.01
Warning message:
In kpss.test(x, null = "Level") : p-value smaller than printed p-
value
> kpss.test(x, null = "Trend")
KPSS Test for Trend Stationarity
data: x
KPSS Trend = 0.6846, Truncation lag parameter = 3, p-value = 0.01
Warning message:
In kpss.test(x, null = "Trend") : p-value smaller than printed p-
value
75
Here, we have stochastic trend or difference stationary process. Hence, we
need differencing to work with stationary series.
76.
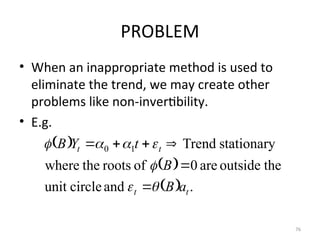
PROBLEM
• When aninappropriate method is used to
eliminate the trend, we may create other
problems like non-invertibility.
• E.g.
76
.
and
circle
unit
the
outside
are
0
of
roots
the
where
stationary
Trend
1
0
t
t
t
t
a
B
B
t
Y
B
77.
PROBLEM
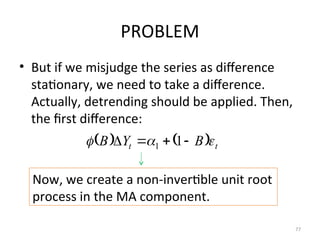
• But ifwe misjudge the series as difference
stationary, we need to take a difference.
Actually, detrending should be applied. Then,
the first difference:
77
t
t B
Y
B
1
1
Now, we create a non-invertible unit root
process in the MA component.
78.
PROBLEM
• To overcomethis, look at the inverse sample
autocorrelation function. If it has the same
ACF pattern of non-stationary process (that is,
slow decaying behavior), this means that we
over-differenced the series.
• Go back and de-trend the series instead of
differencing.
• There are also smoothing filters to eliminate
the trend (Decomposition Methods).
78
79.
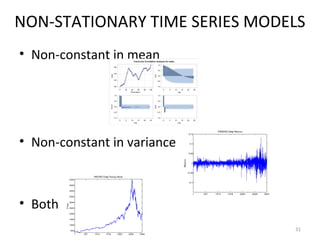
NON-STATIONARITY IN VARIANCE
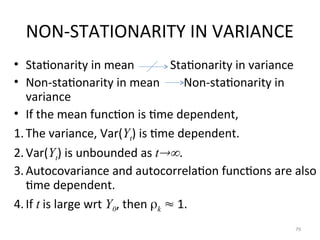
•Stationarity in mean Stationarity in variance
• Non-stationarity in mean Non-stationarity in
variance
• If the mean function is time dependent,
1.The variance, Var(Yt) is time dependent.
2.Var(Yt) is unbounded as t.
3.Autocovariance and autocorrelation functions are also
time dependent.
4.If t is large wrt Y0, then k 1.
79
80.
VARIANCE STABILIZING
TRANSFORMATION
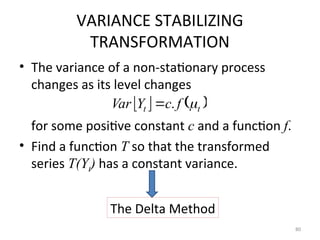
• Thevariance of a non-stationary process
changes as its level changes
for some positive constant c and a function f.
• Find a function T so that the transformed
series T(Yt) has a constant variance.
80
t
t f
c
Y
Var
.
The Delta Method
81.
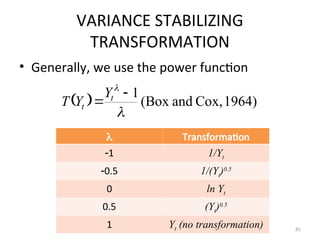
VARIANCE STABILIZING
TRANSFORMATION
• Generally,we use the power function
81
1964)
Cox,
and
(Box
1
t
t
Y
Y
T
Transformation
1 1/Yt
0.5 1/(Yt)0.5
0 ln Yt
0.5 (Yt)0.5
1 Yt (no transformation)
82.
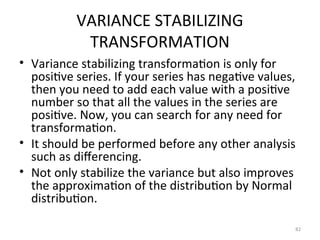
VARIANCE STABILIZING
TRANSFORMATION
• Variancestabilizing transformation is only for
positive series. If your series has negative values,
then you need to add each value with a positive
number so that all the values in the series are
positive. Now, you can search for any need for
transformation.
• It should be performed before any other analysis
such as differencing.
• Not only stabilize the variance but also improves
the approximation of the distribution by Normal
distribution.
82