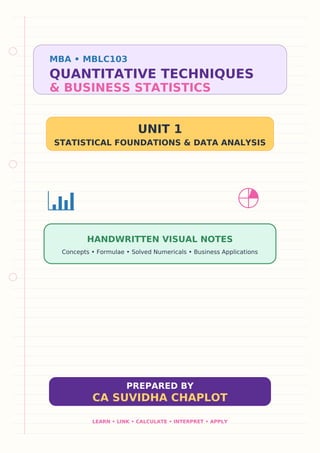

MBA • MBLC103
QUANTITATIVE TECHNIQUES
& BUSINESS STATISTICS
UNIT 1
STATISTICAL FOUNDATIONS & DATA ANALYSIS
HANDWRITTEN VISUAL NOTES
Concepts • Formulae • Solved Numericals • Business Applications
PREPARED BY
CA SUVIDHA CHAPLOT
LEARN • LINK • CALCULATE • INTERPRET • APPLY
UNIT 1 | INFOGRAPHIC 02
UNIT 1 ROADMAP
Complete syllabus coverage at one glance
1 Nature, Scope &
Importance
Concept + formula + example +
decision use
2 Data Collection &
Quality
Concept + formula + example +
decision use
3 Classification &
Presentation
Concept + formula + example +
decision use
4 Mean, Median & Mode
Concept + formula + example +
decision use
5 Range, QD, MD, SD &
CV
Concept + formula + example +
decision use
6 Karl Pearson
Correlation
Concept + formula + example +
decision use
7 Spearman Rank
Correlation
Concept + formula + example +
decision use
8 Simple Linear
Regression
Concept + formula + example +
decision use
9 Business Applications
Concept + formula + example +
decision use
EXAM READY: DEFINITIONS + WORKING STEPS + INTERPRETATION
CA SUVIDHA CHAPLOT MBLC103 • PAGE 2
UNIT 1 | INFOGRAPHIC 03
STATISTICS: THE BUSINESS COMPASS
Meaning • nature • scope • importance
What is Statistics?
In the plural sense: numerical facts. In the
singular sense: the science of collecting,
classifying, presenting, analysing and
interpreting data for decisions.
Why managers need it
It converts raw facts into information, compares
performance, measures risk, forecasts demand
and supports evidence-based decisions.
Key features
Aggregate of facts • numerically expressed •
affected by many causes • collected
systematically • for a predetermined purpose •
comparable and related.
Remember!
Statistics does not replace managerial
judgment; it sharpens judgment. A result is
useful only when the data and method are
appropriate.
QUICK RECALL → WRITE FORMULA → SHOW WORKING → INTERPRET
CA SUVIDHA CHAPLOT MBLC103 • PAGE 3
UNIT 1 | INFOGRAPHIC 04
NATURE, SCOPE & LIMITATIONS
See both the power and boundaries of statistics
Nature
Both a science (systematic principles) and an
art (skillful application). It studies groups, not
isolated cases, and usually works with
quantitative data.
Scope
Planning • marketing • finance • HR •
production • economics • government •
research • quality control • banking and
insurance.
Limitations
Studies aggregates; qualitative facts require
measurement; results are approximate;
association is not always causation; can be
misused; needs homogeneous data.
Golden rule
Define the objective first. Then choose the
population, variables, units, time period,
sources and suitable statistical tools.
QUICK RECALL → WRITE FORMULA → SHOW WORKING → INTERPRET
CA SUVIDHA CHAPLOT MBLC103 • PAGE 4
UNIT 1 | INFOGRAPHIC 05
THE STATISTICAL INVESTIGATION CYCLE
From a business question to action
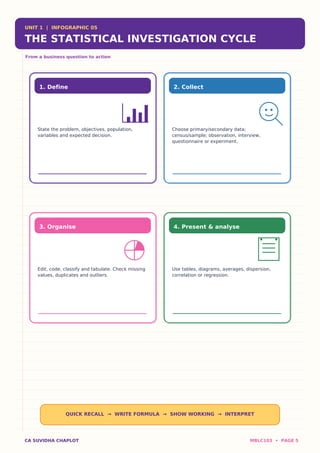
1. Define
State the problem, objectives, population,
variables and expected decision.
2. Collect
Choose primary/secondary data;
census/sample; observation, interview,
questionnaire or experiment.
3. Organise
Edit, code, classify and tabulate. Check missing
values, duplicates and outliers.
4. Present & analyse
Use tables, diagrams, averages, dispersion,
correlation or regression.
QUICK RECALL → WRITE FORMULA → SHOW WORKING → INTERPRET
CA SUVIDHA CHAPLOT MBLC103 • PAGE 5
UNIT 1 | INFOGRAPHIC 06
DATA: TYPES & SOURCES
Build the right foundation before calculation
Primary data
Collected first-hand for the current objective:
survey, interview, observation, schedule,
experiment. Specific but costly and
time-consuming.
Secondary data
Already collected: company records,
government reports, journals, websites and
databases. Quick and economical; verify
suitability and reliability.
Classification
Qualitative/quantitative • discrete/continuous •
cross-sectional/time-series •
nominal/ordinal/interval/ratio.
Quality checklist
Relevance • accuracy • adequacy • timeliness •
consistency • unbiased source • clearly defined
units.
QUICK RECALL → WRITE FORMULA → SHOW WORKING → INTERPRET
CA SUVIDHA CHAPLOT MBLC103 • PAGE 6
UNIT 1 | INFOGRAPHIC 07
COLLECTION OF DATA
Census, sample and questionnaire design
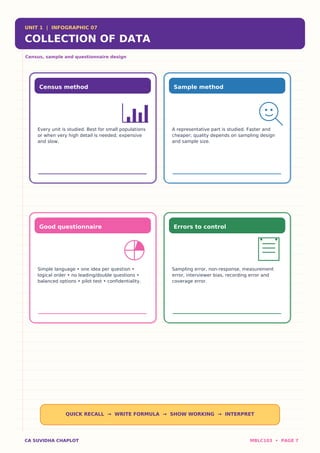
Census method
Every unit is studied. Best for small populations
or when very high detail is needed; expensive
and slow.
Sample method
A representative part is studied. Faster and
cheaper; quality depends on sampling design
and sample size.
Good questionnaire
Simple language • one idea per question •
logical order • no leading/double questions •
balanced options • pilot test • confidentiality.
Errors to control
Sampling error, non-response, measurement
error, interviewer bias, recording error and
coverage error.
QUICK RECALL → WRITE FORMULA → SHOW WORKING → INTERPRET
CA SUVIDHA CHAPLOT MBLC103 • PAGE 7
UNIT 1 | INFOGRAPHIC 08
CLASSIFICATION & PRESENTATION
Turn raw observations into a readable story
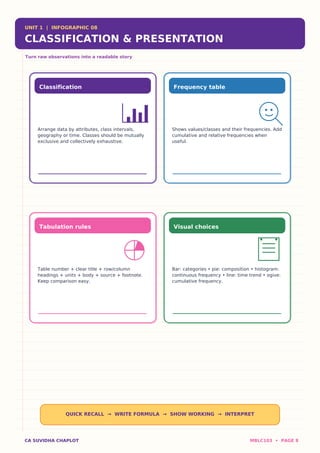
Classification
Arrange data by attributes, class intervals,
geography or time. Classes should be mutually
exclusive and collectively exhaustive.
Frequency table
Shows values/classes and their frequencies. Add
cumulative and relative frequencies when
useful.
Tabulation rules
Table number + clear title + row/column
headings + units + body + source + footnote.
Keep comparison easy.
Visual choices
Bar: categories • pie: composition • histogram:
continuous frequency • line: time trend • ogive:
cumulative frequency.
QUICK RECALL → WRITE FORMULA → SHOW WORKING → INTERPRET
CA SUVIDHA CHAPLOT MBLC103 • PAGE 8
UNIT 1 | INFOGRAPHIC 09
MEASURES OF CENTRAL TENDENCY
One value that represents the dataset
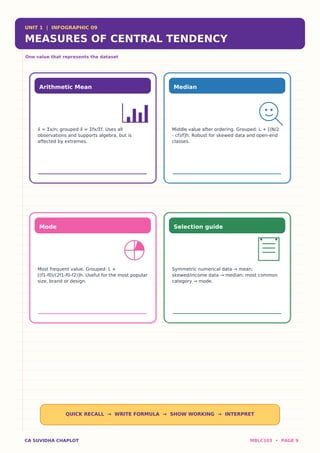
Arithmetic Mean
x̄ = Σx/n; grouped x̄ = Σfx/Σf. Uses all
observations and supports algebra, but is
affected by extremes.
Median
Middle value after ordering. Grouped: L + [(N/2
- cf)/f]h. Robust for skewed data and open-end
classes.
Mode
Most frequent value. Grouped: L +
[(f1-f0)/(2f1-f0-f2)]h. Useful for the most popular
size, brand or design.
Selection guide
Symmetric numerical data → mean;
skewed/income data → median; most common
category → mode.
QUICK RECALL → WRITE FORMULA → SHOW WORKING → INTERPRET
CA SUVIDHA CHAPLOT MBLC103 • PAGE 9
UNIT 1 | INFOGRAPHIC 10
MEAN: METHODS & SOLVED EXAMPLE
Direct, assumed mean and weighted mean
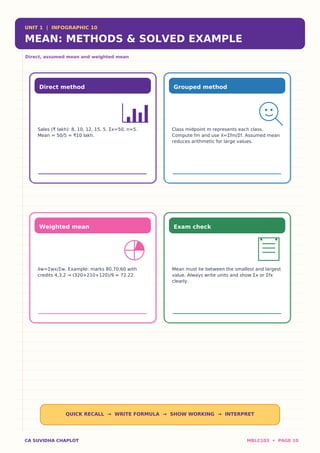
Direct method
Sales (₹ lakh): 8, 10, 12, 15, 5. Σx=50, n=5.
Mean = 50/5 = ₹10 lakh.
Grouped method
Class midpoint m represents each class.
Compute fm and use x̄=Σfm/Σf. Assumed mean
reduces arithmetic for large values.
Weighted mean
x̄w=Σwx/Σw. Example: marks 80,70,60 with
credits 4,3,2 → (320+210+120)/9 = 72.22.
Exam check
Mean must lie between the smallest and largest
value. Always write units and show Σx or Σfx
clearly.
QUICK RECALL → WRITE FORMULA → SHOW WORKING → INTERPRET
CA SUVIDHA CHAPLOT MBLC103 • PAGE 10
UNIT 1 | INFOGRAPHIC 11
MEDIAN & MODE: SOLVED EXAMPLES
Position and popularity
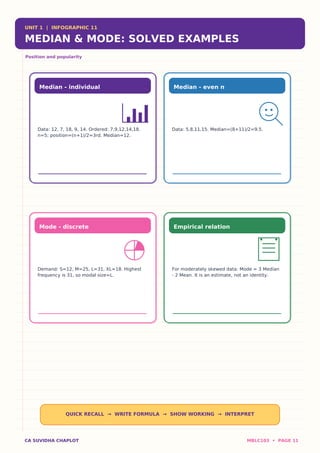
Median - individual
Data: 12, 7, 18, 9, 14. Ordered: 7,9,12,14,18.
n=5; position=(n+1)/2=3rd. Median=12.
Median - even n
Data: 5,8,11,15. Median=(8+11)/2=9.5.
Mode - discrete
Demand: S=12, M=25, L=31, XL=18. Highest
frequency is 31, so modal size=L.
Empirical relation
For moderately skewed data: Mode ≈ 3 Median
- 2 Mean. It is an estimate, not an identity.
QUICK RECALL → WRITE FORMULA → SHOW WORKING → INTERPRET
CA SUVIDHA CHAPLOT MBLC103 • PAGE 11
UNIT 1 | INFOGRAPHIC 12
MEASURES OF DISPERSION
Average alone never tells the whole story
Meaning
Dispersion shows how far observations spread
around a central value. Lower dispersion usually
means greater consistency.
Absolute measures
Range, quartile deviation, mean deviation and
standard deviation are expressed in the original
unit.
Relative measures
Coefficients and coefficient of variation are
unit-free; useful for comparing series with
different averages.
Business value
Compare risk, consistency, wage inequality,
demand fluctuation, delivery reliability and
quality variation.
QUICK RECALL → WRITE FORMULA → SHOW WORKING → INTERPRET
CA SUVIDHA CHAPLOT MBLC103 • PAGE 12
UNIT 1 | INFOGRAPHIC 13
RANGE & QUARTILE DEVIATION
Quick spread and middle-50% spread
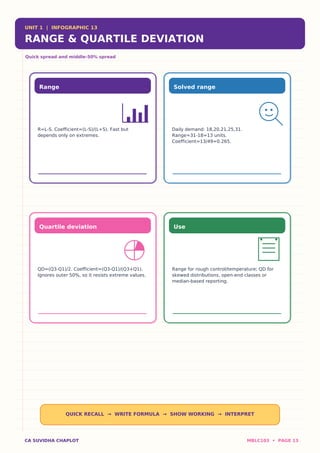
Range
R=L-S. Coefficient=(L-S)/(L+S). Fast but
depends only on extremes.
Solved range
Daily demand: 18,20,21,25,31.
Range=31-18=13 units.
Coefficient=13/49=0.265.
Quartile deviation
QD=(Q3-Q1)/2. Coefficient=(Q3-Q1)/(Q3+Q1).
Ignores outer 50%, so it resists extreme values.
Use
Range for rough control/temperature; QD for
skewed distributions, open-end classes or
median-based reporting.
QUICK RECALL → WRITE FORMULA → SHOW WORKING → INTERPRET
CA SUVIDHA CHAPLOT MBLC103 • PAGE 13
UNIT 1 | INFOGRAPHIC 14
MEAN DEVIATION & STANDARD DEVIATION
Measure typical distance from the centre
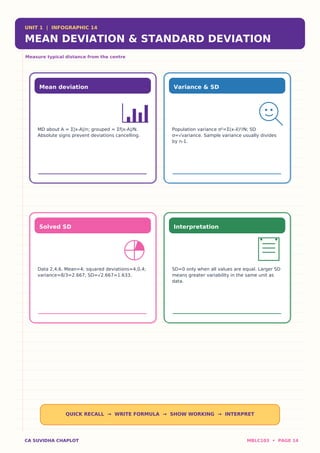
Mean deviation
MD about A = Σ|x-A|/n; grouped = Σf|x-A|/N.
Absolute signs prevent deviations cancelling.
Variance & SD
Population variance σ²=Σ(x-x̄)²/N; SD
σ=√variance. Sample variance usually divides
by n-1.
Solved SD
Data 2,4,6. Mean=4; squared deviations=4,0,4;
variance=8/3=2.667; SD=√2.667=1.633.
Interpretation
SD=0 only when all values are equal. Larger SD
means greater variability in the same unit as
data.
QUICK RECALL → WRITE FORMULA → SHOW WORKING → INTERPRET
CA SUVIDHA CHAPLOT MBLC103 • PAGE 14
UNIT 1 | INFOGRAPHIC 15
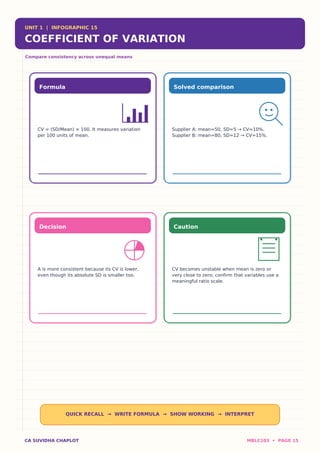
COEFFICIENT OF VARIATION
Compare consistency across unequal means
Formula
CV = (SD/Mean) × 100. It measures variation
per 100 units of mean.
Solved comparison
Supplier A: mean=50, SD=5 → CV=10%.
Supplier B: mean=80, SD=12 → CV=15%.
Decision
A is more consistent because its CV is lower,
even though its absolute SD is smaller too.
Caution
CV becomes unstable when mean is zero or
very close to zero; confirm that variables use a
meaningful ratio scale.
QUICK RECALL → WRITE FORMULA → SHOW WORKING → INTERPRET
CA SUVIDHA CHAPLOT MBLC103 • PAGE 15
UNIT 1 | INFOGRAPHIC 16
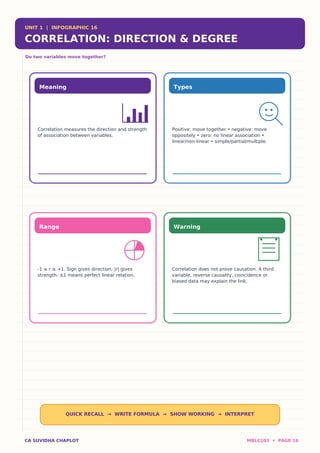
CORRELATION: DIRECTION & DEGREE
Do two variables move together?
Meaning
Correlation measures the direction and strength
of association between variables.
Types
Positive: move together • negative: move
oppositely • zero: no linear association •
linear/non-linear • simple/partial/multiple.
Range
-1 ≤ r ≤ +1. Sign gives direction; |r| gives
strength. ±1 means perfect linear relation.
Warning
Correlation does not prove causation. A third
variable, reverse causality, coincidence or
biased data may explain the link.
QUICK RECALL → WRITE FORMULA → SHOW WORKING → INTERPRET
CA SUVIDHA CHAPLOT MBLC103 • PAGE 16
UNIT 1 | INFOGRAPHIC 17
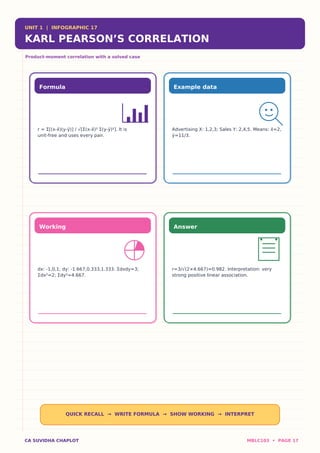
KARL PEARSON’S CORRELATION
Product-moment correlation with a solved case
Formula
r = Σ[(x-x̄)(y-ȳ)] / √[Σ(x-x̄)² Σ(y-ȳ)²]. It is
unit-free and uses every pair.
Example data
Advertising X: 1,2,3; Sales Y: 2,4,5. Means: x̄=2,
ȳ=11/3.
Working
dx: -1,0,1; dy: -1.667,0.333,1.333. Σdxdy=3;
Σdx²=2; Σdy²=4.667.
Answer
r=3/√(2×4.667)=0.982. Interpretation: very
strong positive linear association.
QUICK RECALL → WRITE FORMULA → SHOW WORKING → INTERPRET
CA SUVIDHA CHAPLOT MBLC103 • PAGE 17
UNIT 1 | INFOGRAPHIC 18
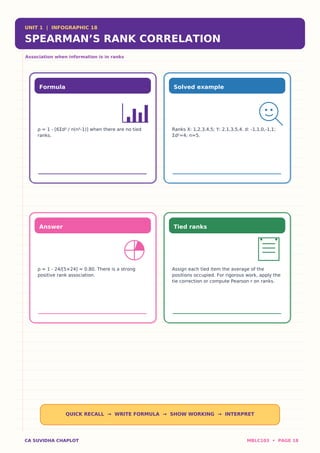
SPEARMAN’S RANK CORRELATION
Association when information is in ranks
Formula
ρ = 1 - [6Σd² / n(n²-1)] when there are no tied
ranks.
Solved example
Ranks X: 1,2,3,4,5; Y: 2,1,3,5,4. d: -1,1,0,-1,1;
Σd²=4; n=5.
Answer
ρ = 1 - 24/[5×24] = 0.80. There is a strong
positive rank association.
Tied ranks
Assign each tied item the average of the
positions occupied. For rigorous work, apply the
tie correction or compute Pearson r on ranks.
QUICK RECALL → WRITE FORMULA → SHOW WORKING → INTERPRET
CA SUVIDHA CHAPLOT MBLC103 • PAGE 18
UNIT 1 | INFOGRAPHIC 19
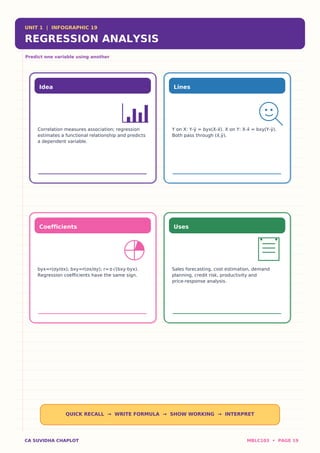
REGRESSION ANALYSIS
Predict one variable using another
Idea
Correlation measures association; regression
estimates a functional relationship and predicts
a dependent variable.
Lines
Y on X: Y-ȳ = byx(X-x̄). X on Y: X-x̄ = bxy(Y-ȳ).
Both pass through (x̄,ȳ).
Coefficients
byx=r(σy/σx); bxy=r(σx/σy); r=±√(bxy·byx).
Regression coefficients have the same sign.
Uses
Sales forecasting, cost estimation, demand
planning, credit risk, productivity and
price-response analysis.
QUICK RECALL → WRITE FORMULA → SHOW WORKING → INTERPRET
CA SUVIDHA CHAPLOT MBLC103 • PAGE 19
UNIT 1 | INFOGRAPHIC 20
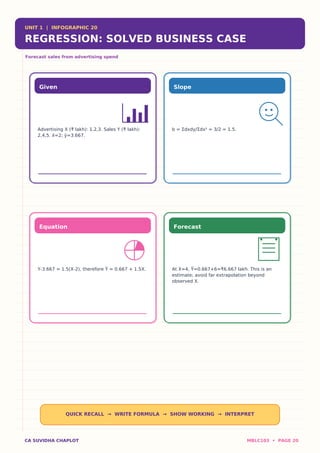
REGRESSION: SOLVED BUSINESS CASE
Forecast sales from advertising spend
Given
Advertising X (₹ lakh): 1,2,3. Sales Y (₹ lakh):
2,4,5. x̄=2; ȳ=3.667.
Slope
b = Σdxdy/Σdx² = 3/2 = 1.5.
Equation
Y-3.667 = 1.5(X-2), therefore Ŷ = 0.667 + 1.5X.
Forecast
At X=4, Ŷ=0.667+6=₹6.667 lakh. This is an
estimate; avoid far extrapolation beyond
observed X.
QUICK RECALL → WRITE FORMULA → SHOW WORKING → INTERPRET
CA SUVIDHA CHAPLOT MBLC103 • PAGE 20
UNIT 1 | INFOGRAPHIC 21
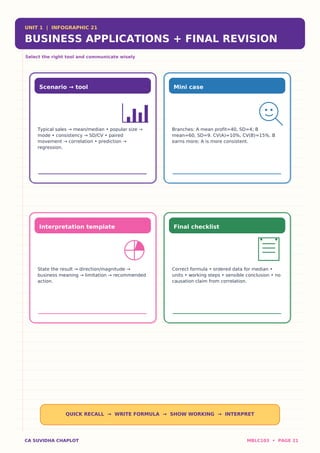
BUSINESS APPLICATIONS + FINAL REVISION
Select the right tool and communicate wisely
Scenario → tool
Typical sales → mean/median • popular size →
mode • consistency → SD/CV • paired
movement → correlation • prediction →
regression.
Mini case
Branches: A mean profit=40, SD=4; B
mean=60, SD=9. CV(A)=10%, CV(B)=15%. B
earns more; A is more consistent.
Interpretation template
State the result → direction/magnitude →
business meaning → limitation → recommended
action.
Final checklist
Correct formula • ordered data for median •
units • working steps • sensible conclusion • no
causation claim from correlation.
QUICK RECALL → WRITE FORMULA → SHOW WORKING → INTERPRET
CA SUVIDHA CHAPLOT MBLC103 • PAGE 21