How Red Hat Uses gNMI,
Telegraf and InfluxDB to
Gain Network Visibility
Martin Moucka - Principal Network Engineer
Red Hat
© 2021  InfluxData Inc. All Rights Reserved.
Agenda
• Introduction
• Scope
• Why InfluxDB?
• Architecture
• Visualizations
• Flux
© 2021  InfluxData Inc. All Rights Reserved.
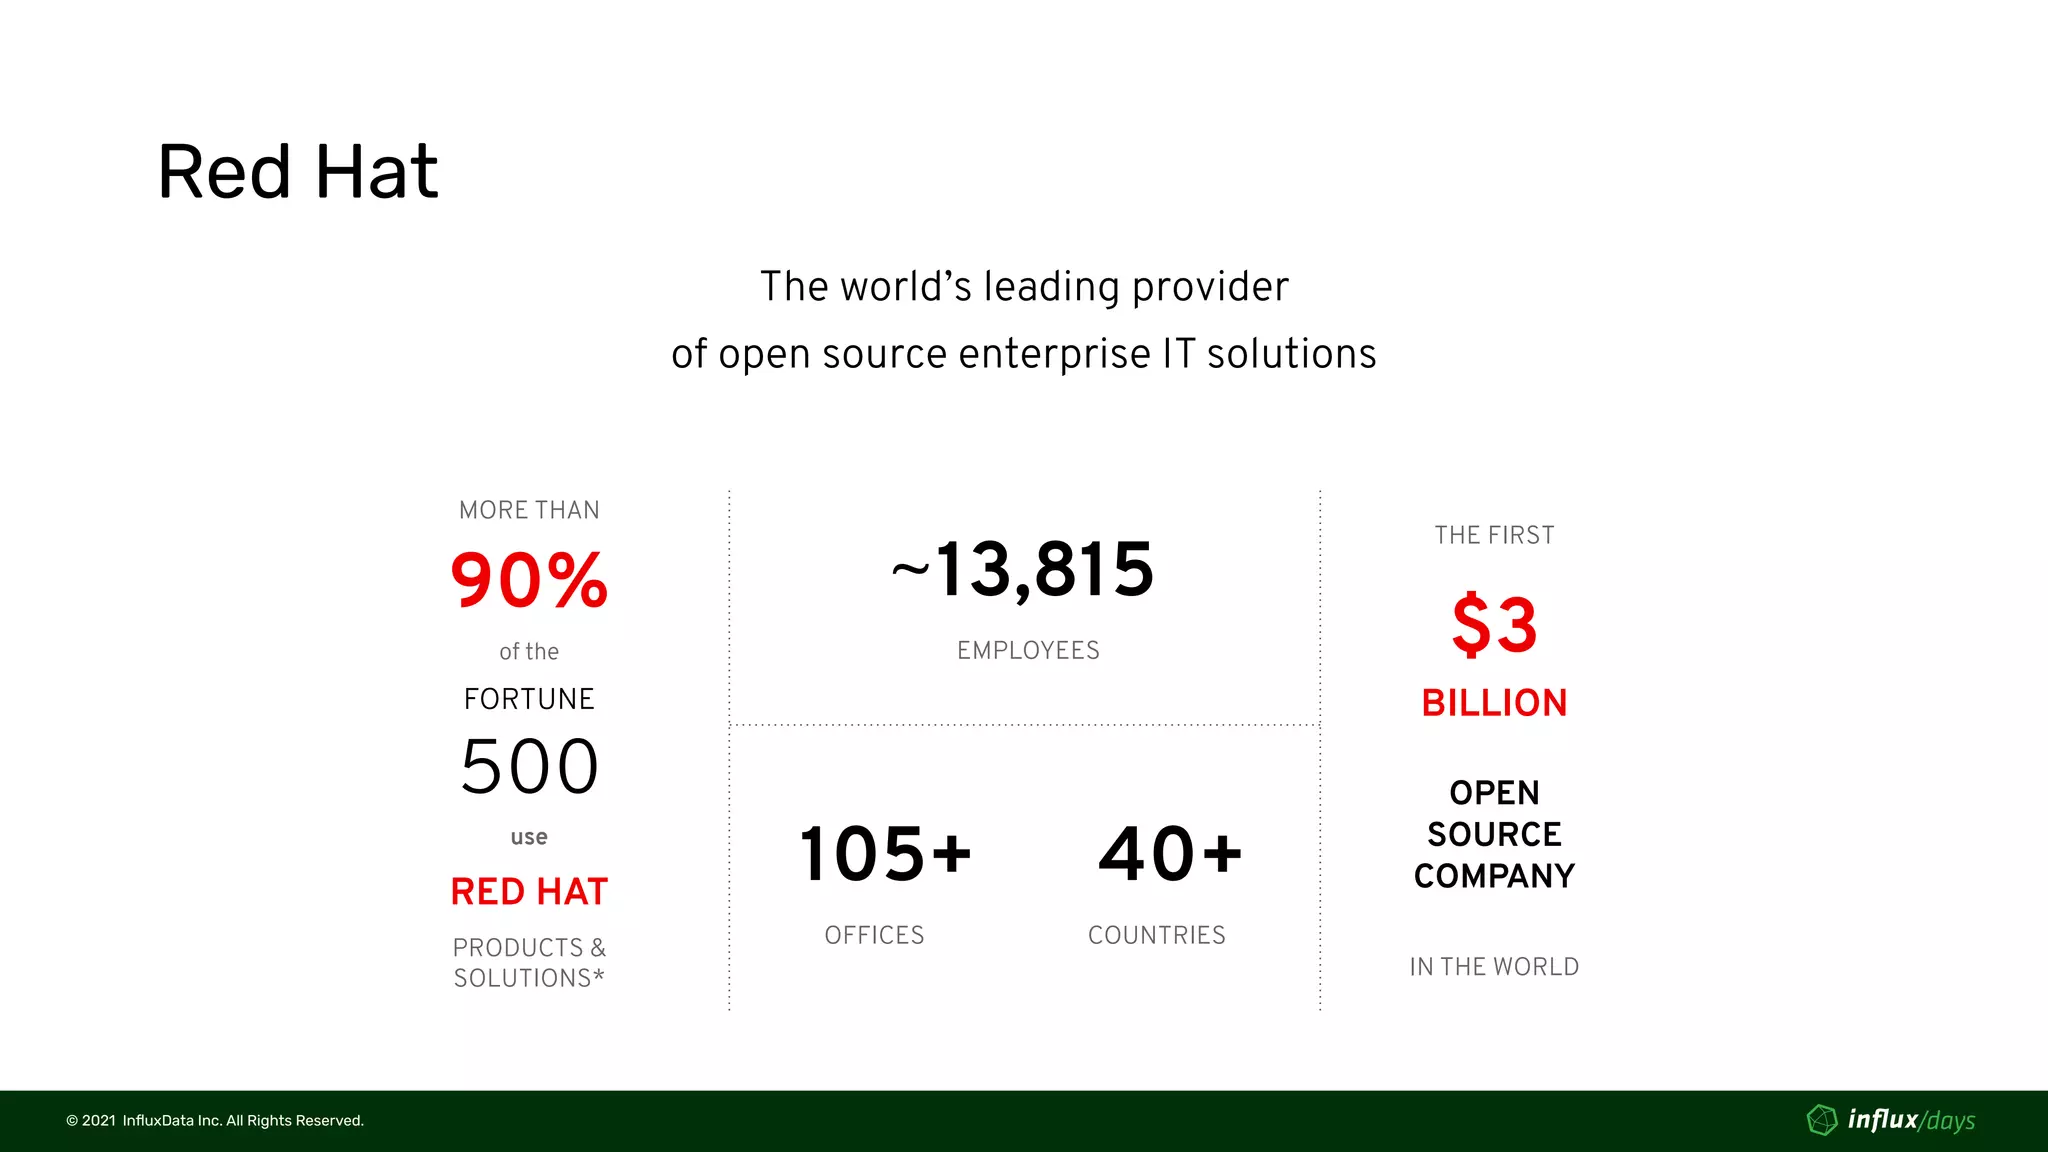
Red Hat
The world’s leading provider
of open source enterprise IT solutions
MORE THAN
90%
of the
FORTUNE
500
RED HAT
use
PRODUCTS &
SOLUTIONS*
~13,815
EMPLOYEES
105+
OFFICES
40+
COUNTRIES
THE FIRST
$3
OPEN
SOURCE
COMPANY
IN THE WORLD
BILLION
© 2021  InfluxData Inc. All Rights Reserved.
Martin Moucka
Principal Network Engineer, Red Hat
● With company for more than 7 years
● Built a network automation around Ansible, utilizing single source of truth
● Started transition to modern monitoring connected to the network automation
● Tech lead of Network Automation & Tools team
E-mail: mmoucka@redhat.com
© 2021  InfluxData Inc. All Rights Reserved.
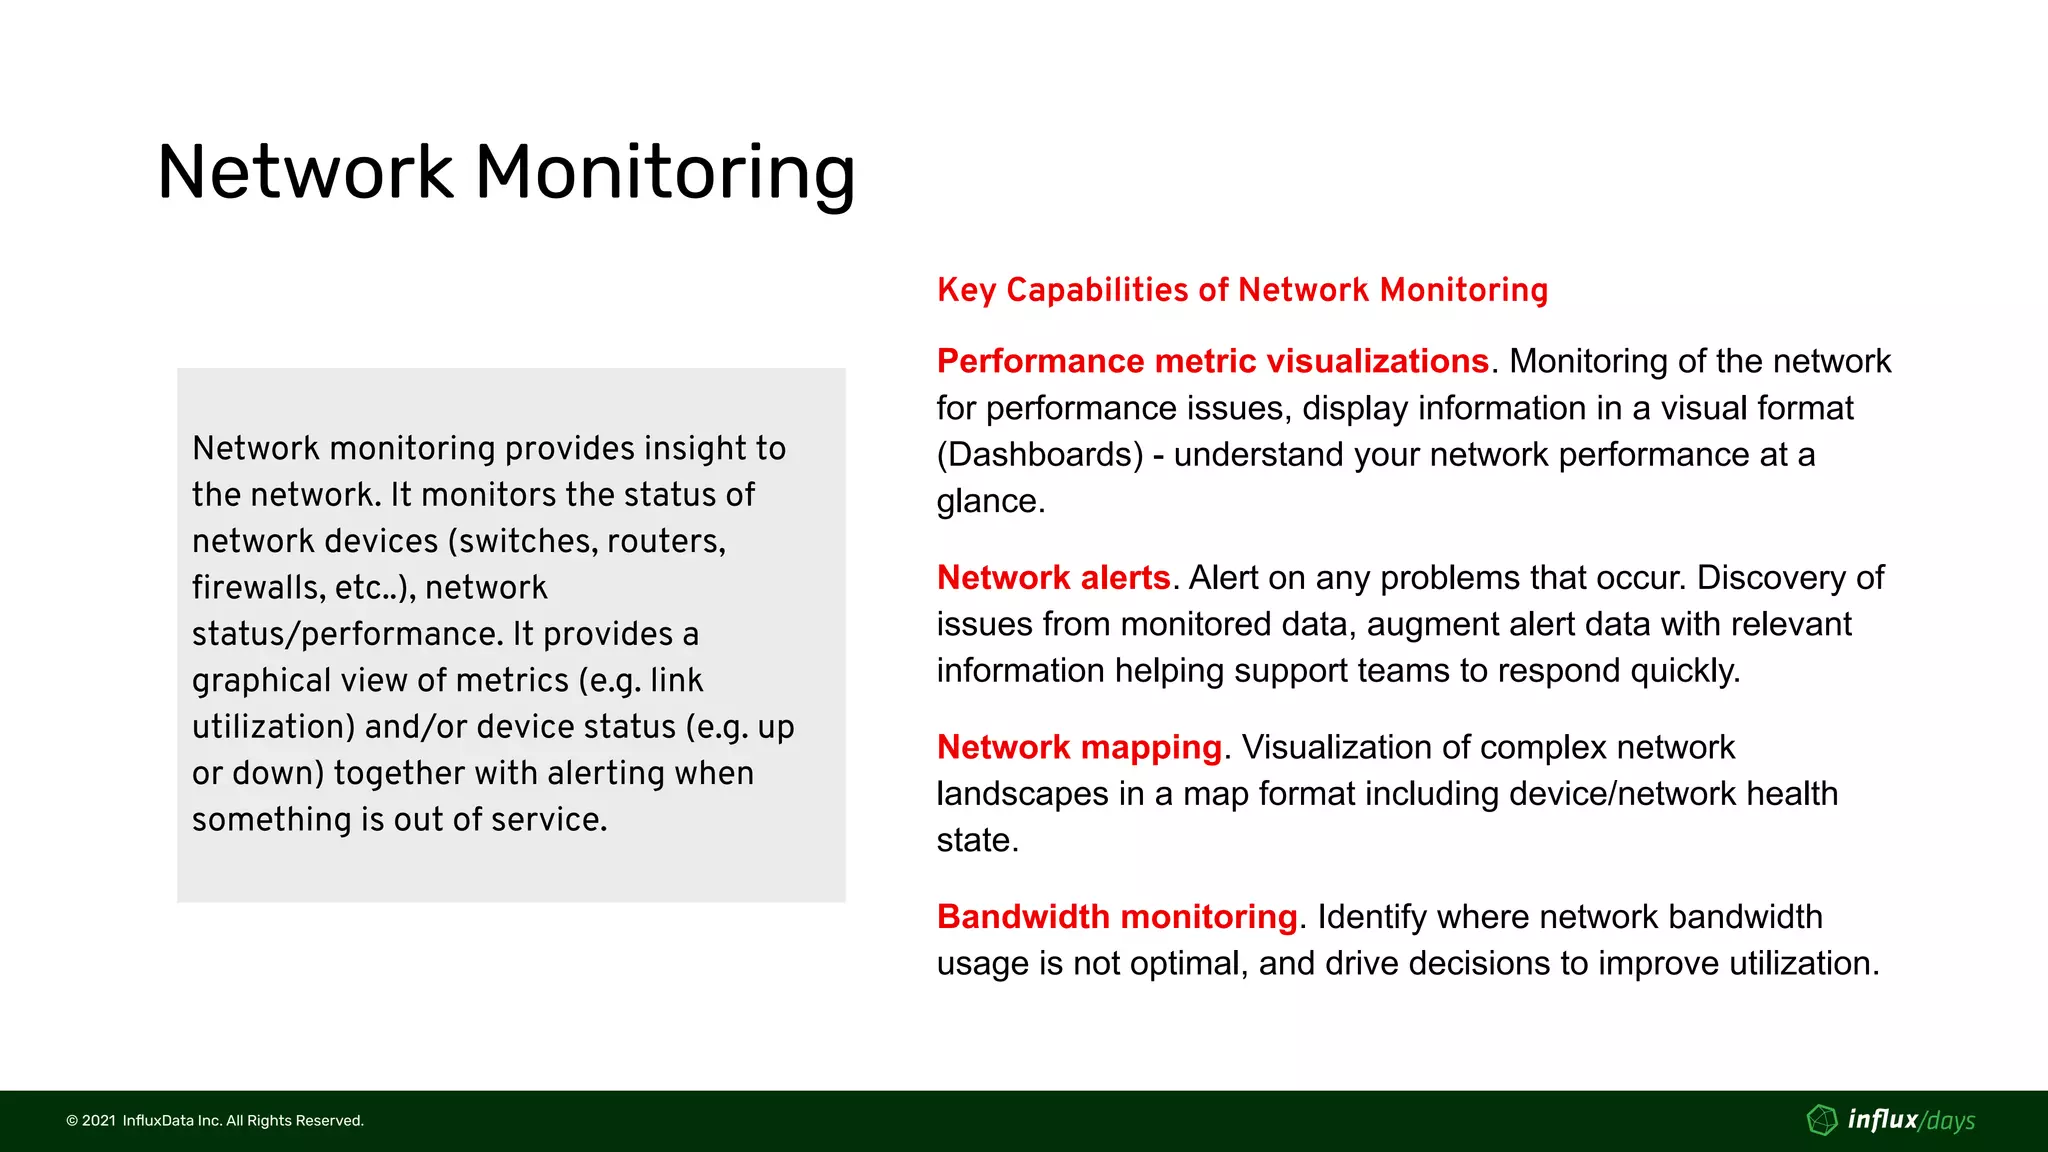
Network Monitoring
Network monitoring provides insight to
the network. It monitors the status of
network devices (switches, routers,
firewalls, etc..), network
status/performance. It provides a
graphical view of metrics (e.g. link
utilization) and/or device status (e.g. up
or down) together with alerting when
something is out of service.
Key Capabilities of Network Monitoring
Performance metric visualizations. Monitoring of the network
for performance issues, display information in a visual format
(Dashboards) - understand your network performance at a
glance.
Network alerts. Alert on any problems that occur. Discovery of
issues from monitored data, augment alert data with relevant
information helping support teams to respond quickly.
Network mapping. Visualization of complex network
landscapes in a map format including device/network health
state.
Bandwidth monitoring. Identify where network bandwidth
usage is not optimal, and drive decisions to improve utilization.
© 2021  InfluxData Inc. All Rights Reserved.
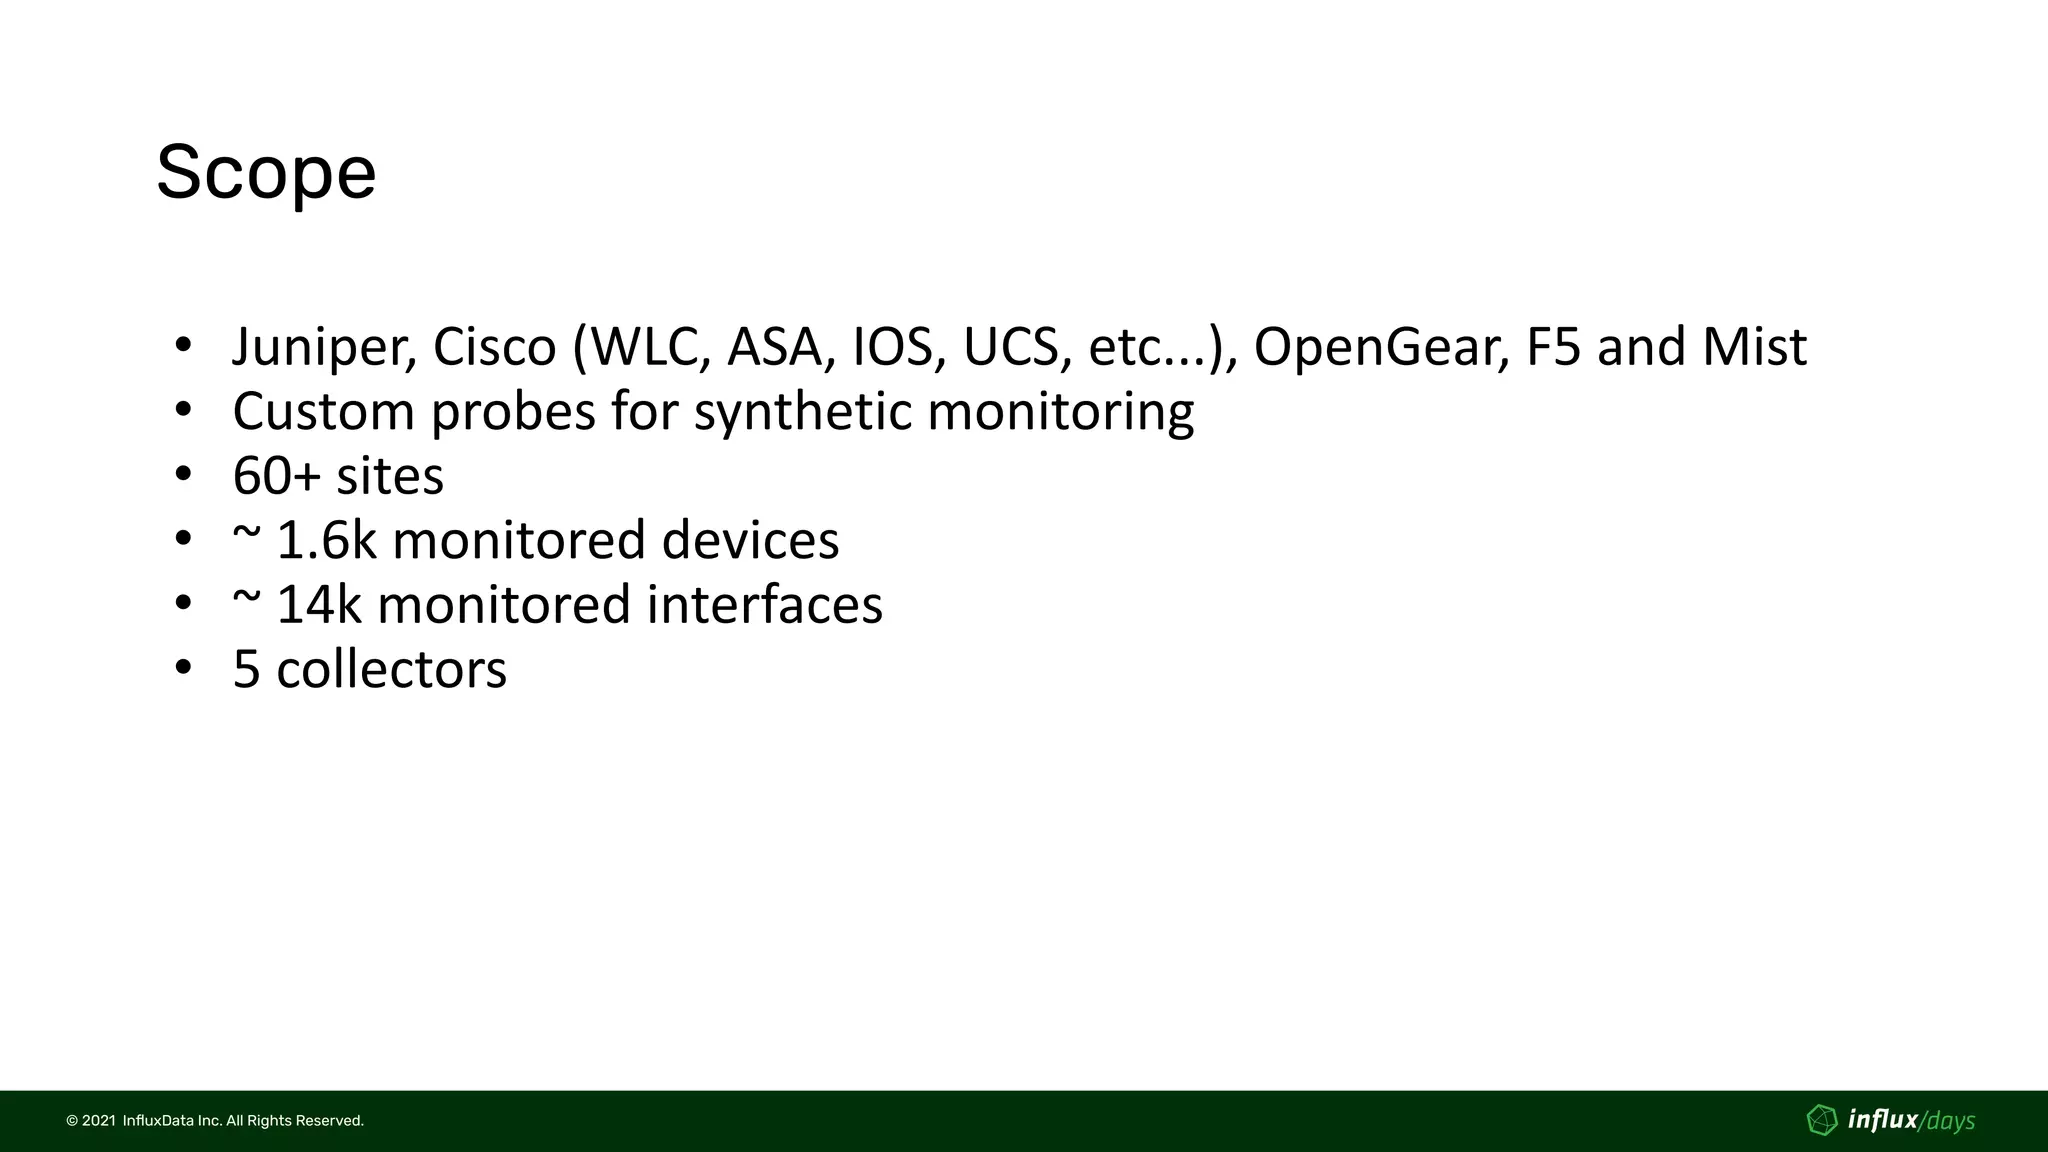
Scope
• Juniper, Cisco (WLC, ASA, IOS, UCS, etc...), OpenGear, F5 and Mist
• Custom probes for synthetic monitoring
• 60+ sites
• ~ 1.6k monitored devices
• ~ 14k monitored interfaces
• 5 collectors
© 2021  InfluxData Inc. All Rights Reserved.
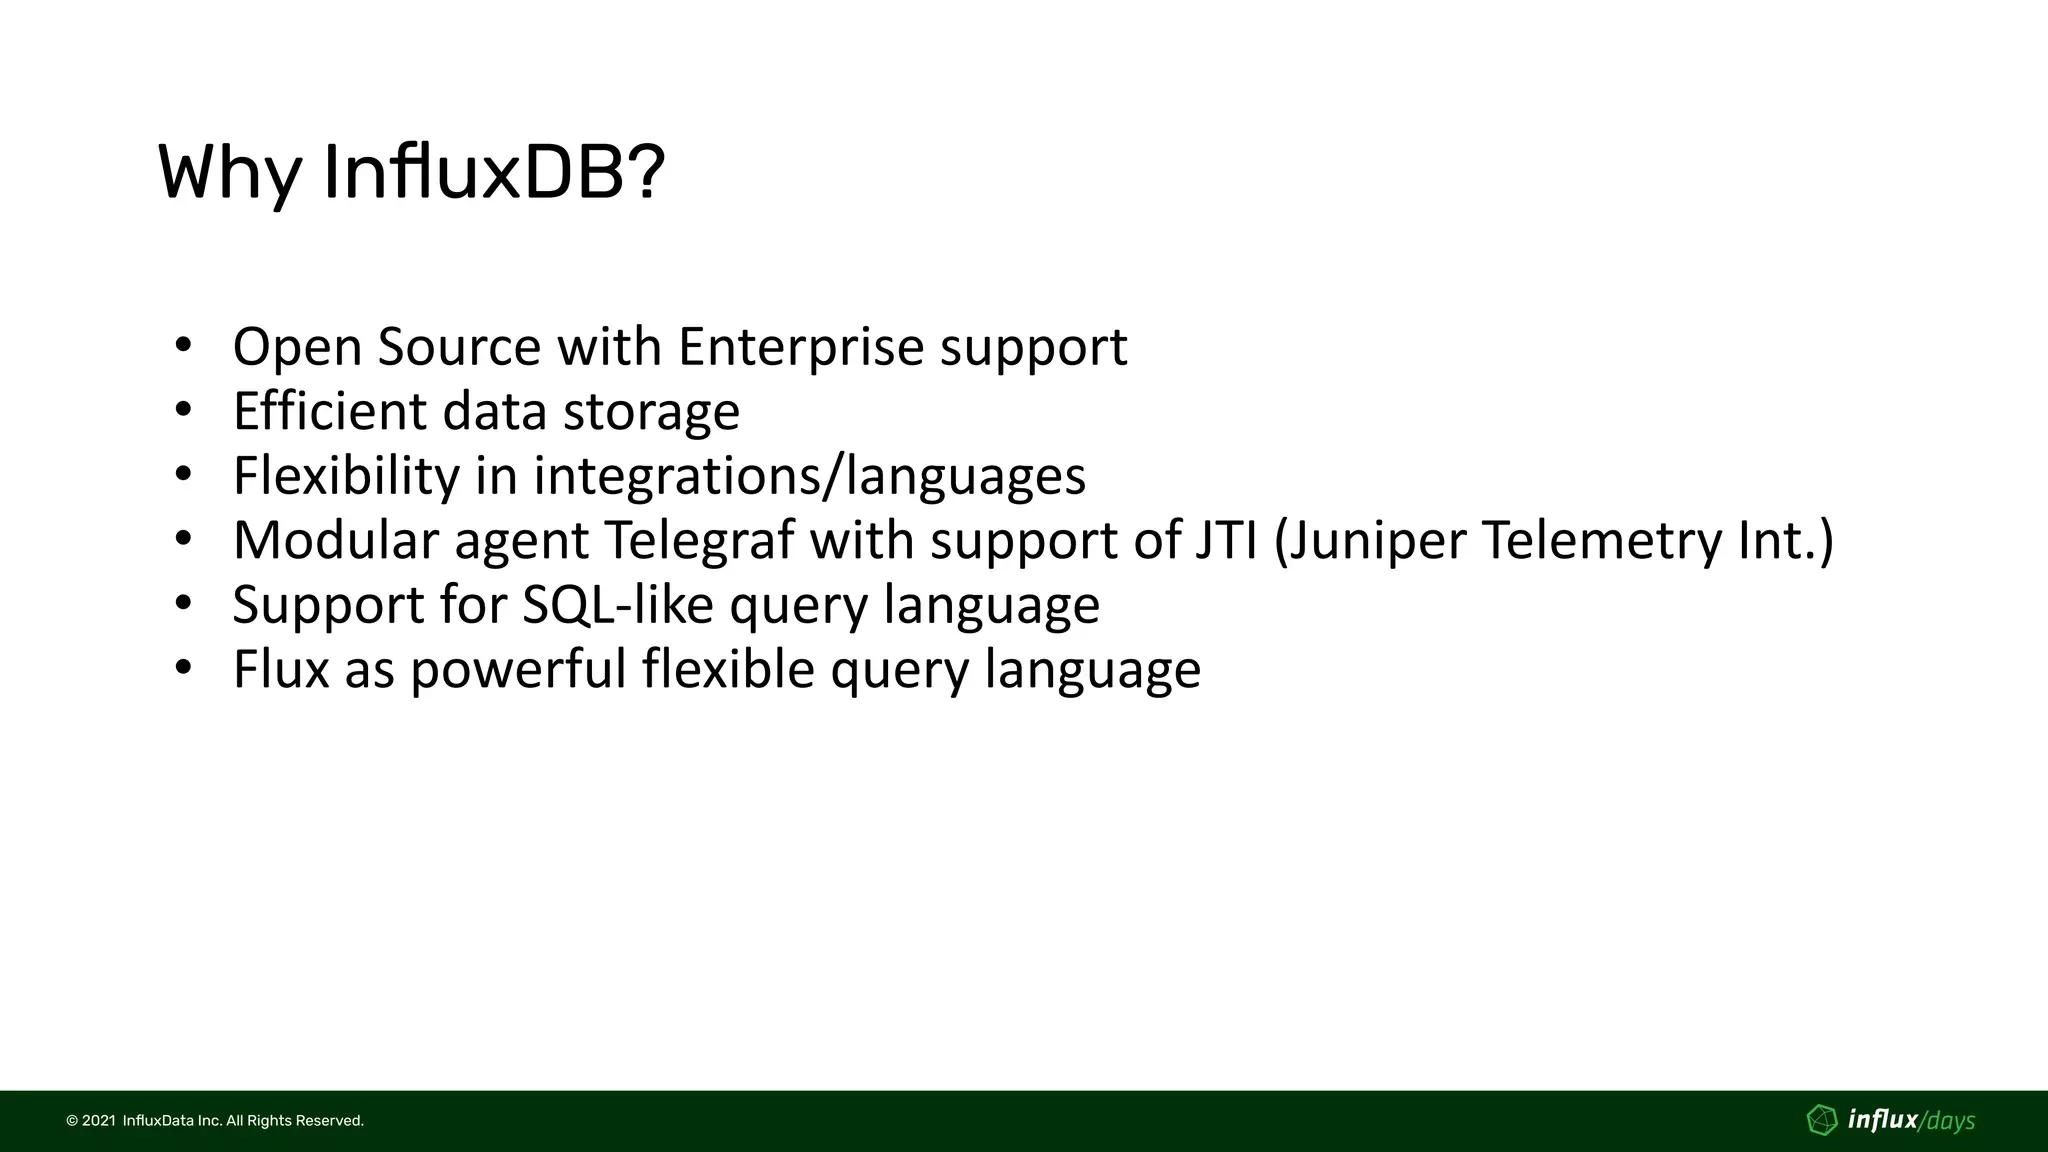
Why InfluxDB?
• Open Source with Enterprise support
• Efficient data storage
• Flexibility in integrations/languages
• Modular agent Telegraf with support of JTI (Juniper Telemetry Int.)
• Support for SQL-like query language
• Flux as powerful flexible query language
© 2021  InfluxData Inc. All Rights Reserved.
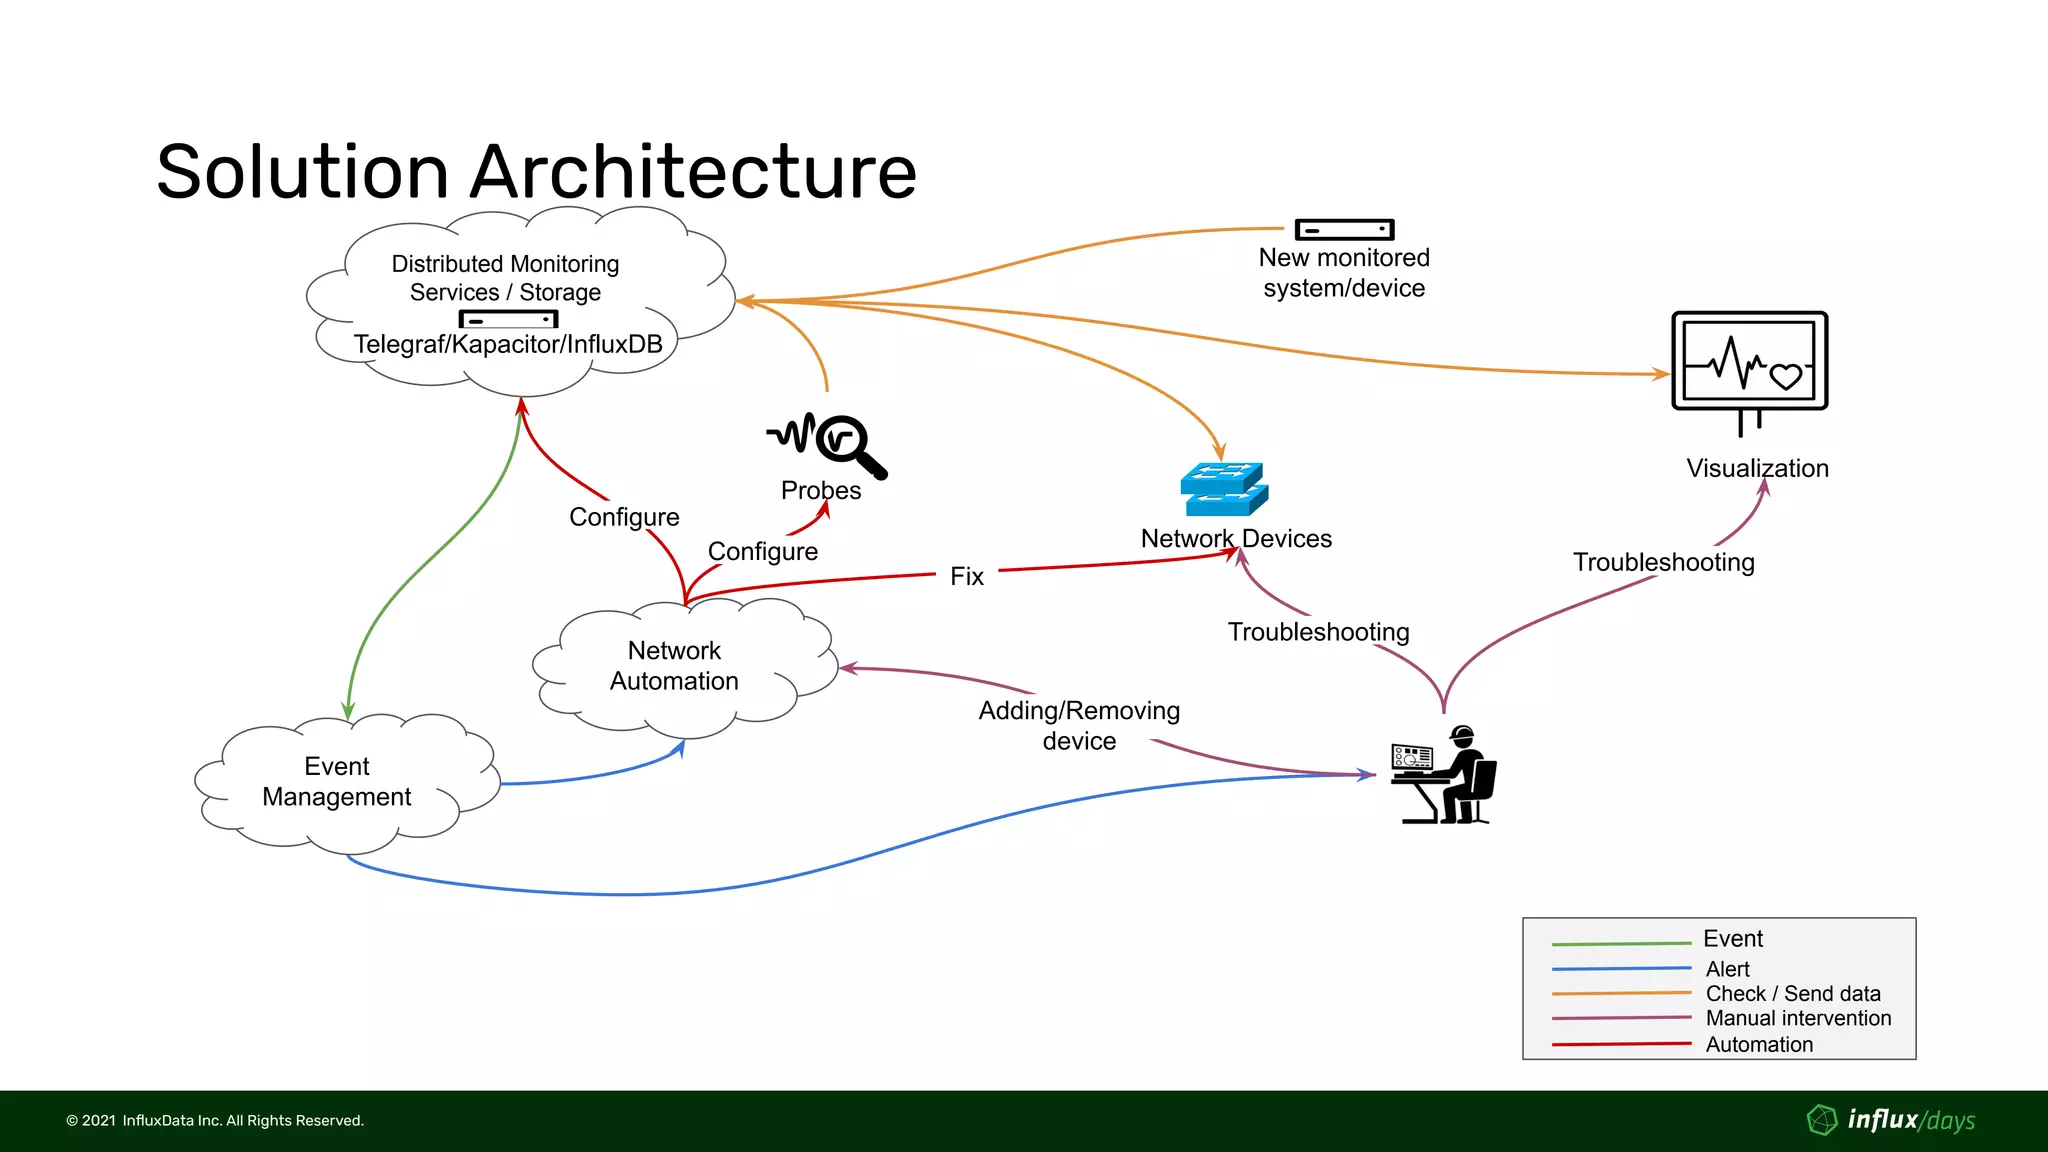
Solution Architecture
Distributed Monitoring
Services / Storage
Network Devices
Telegraf/Kapacitor/InfluxDB
Troubleshooting
Network
Automation
Adding/Removing
device
Event
Management
Visualization
Probes
Alert
Check / Send data
Manual intervention
Event
Automation
Troubleshooting
Fix
Configure
Configure
New monitored
system/device
© 2021  InfluxData Inc. All Rights Reserved.
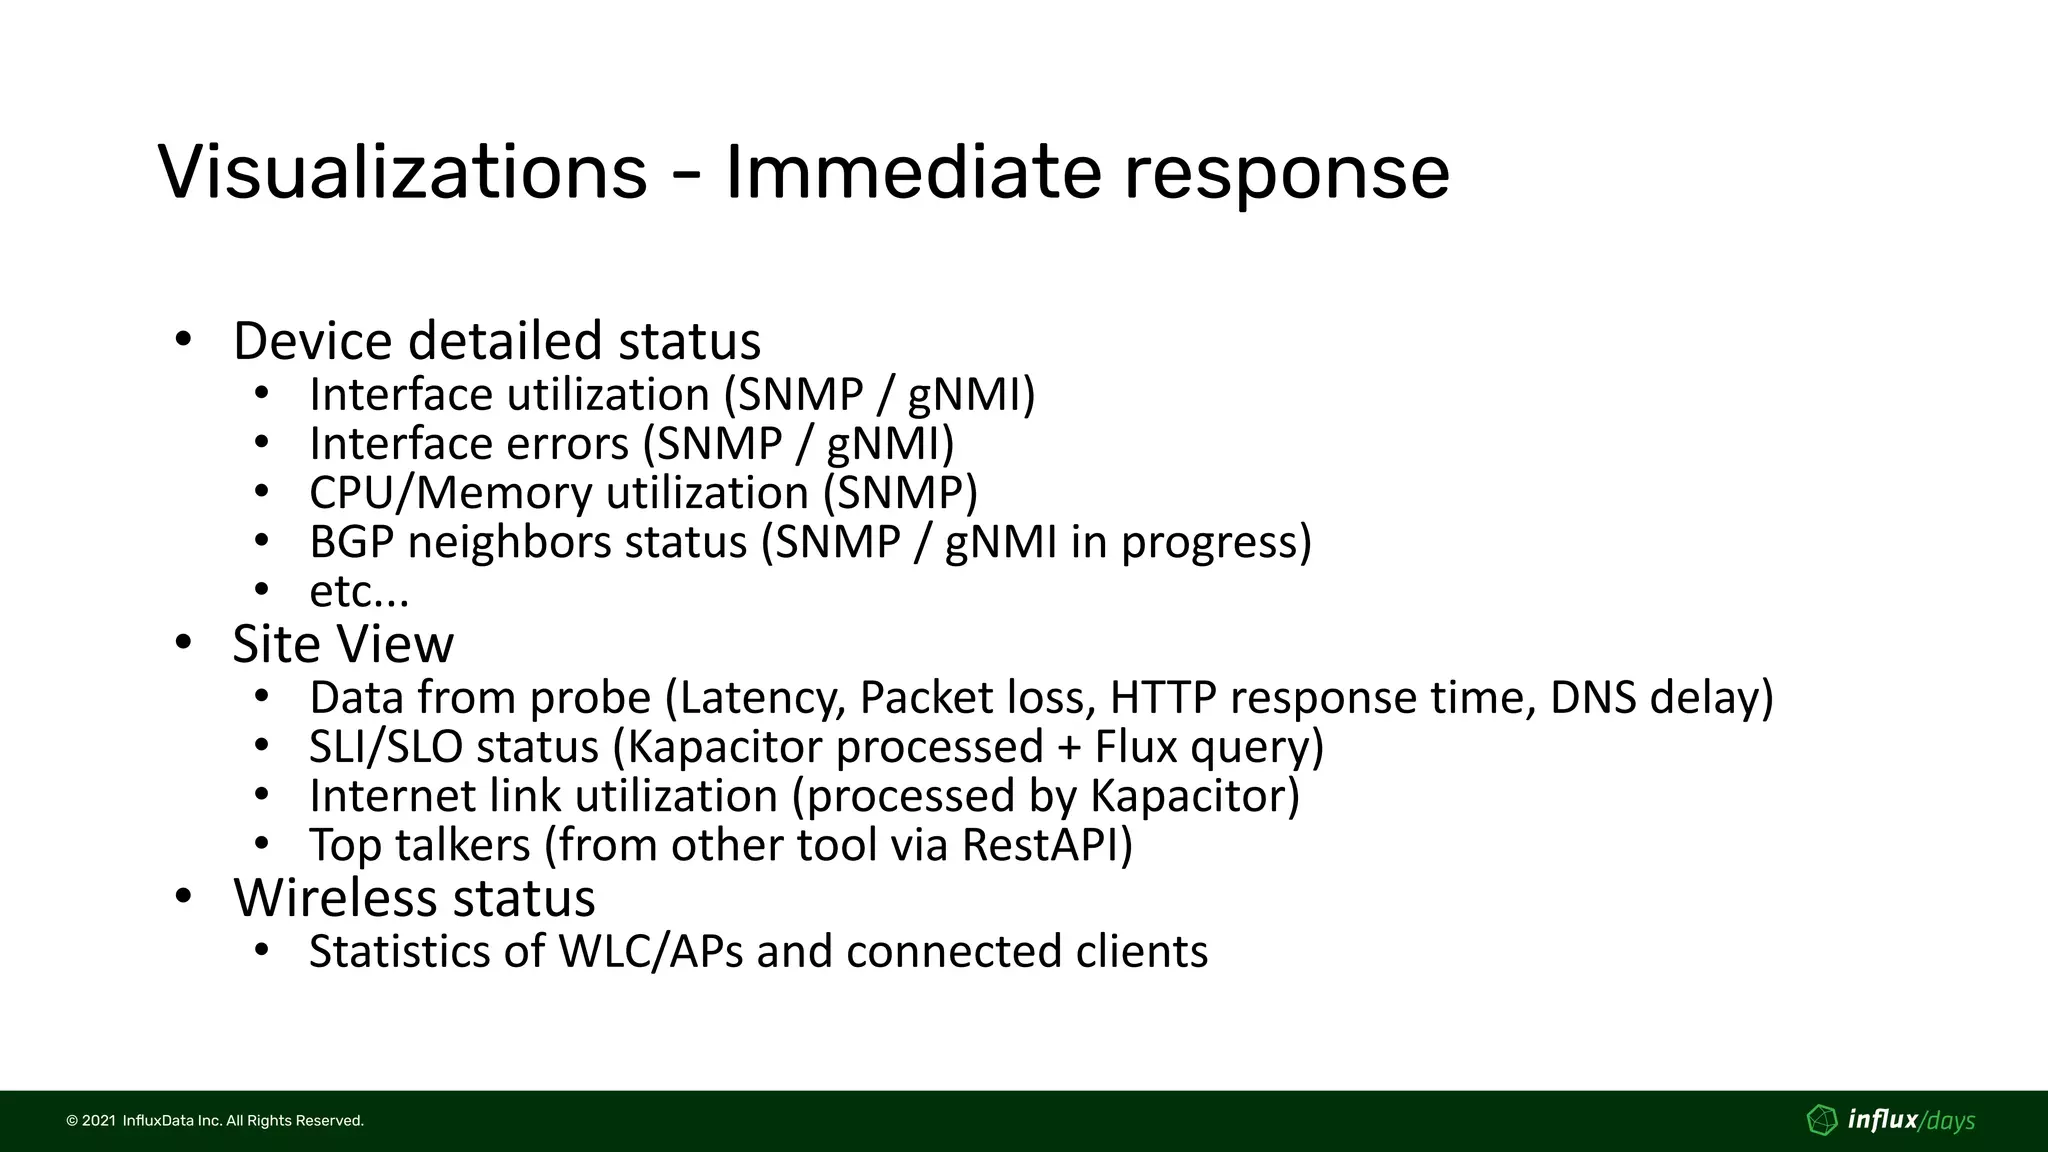
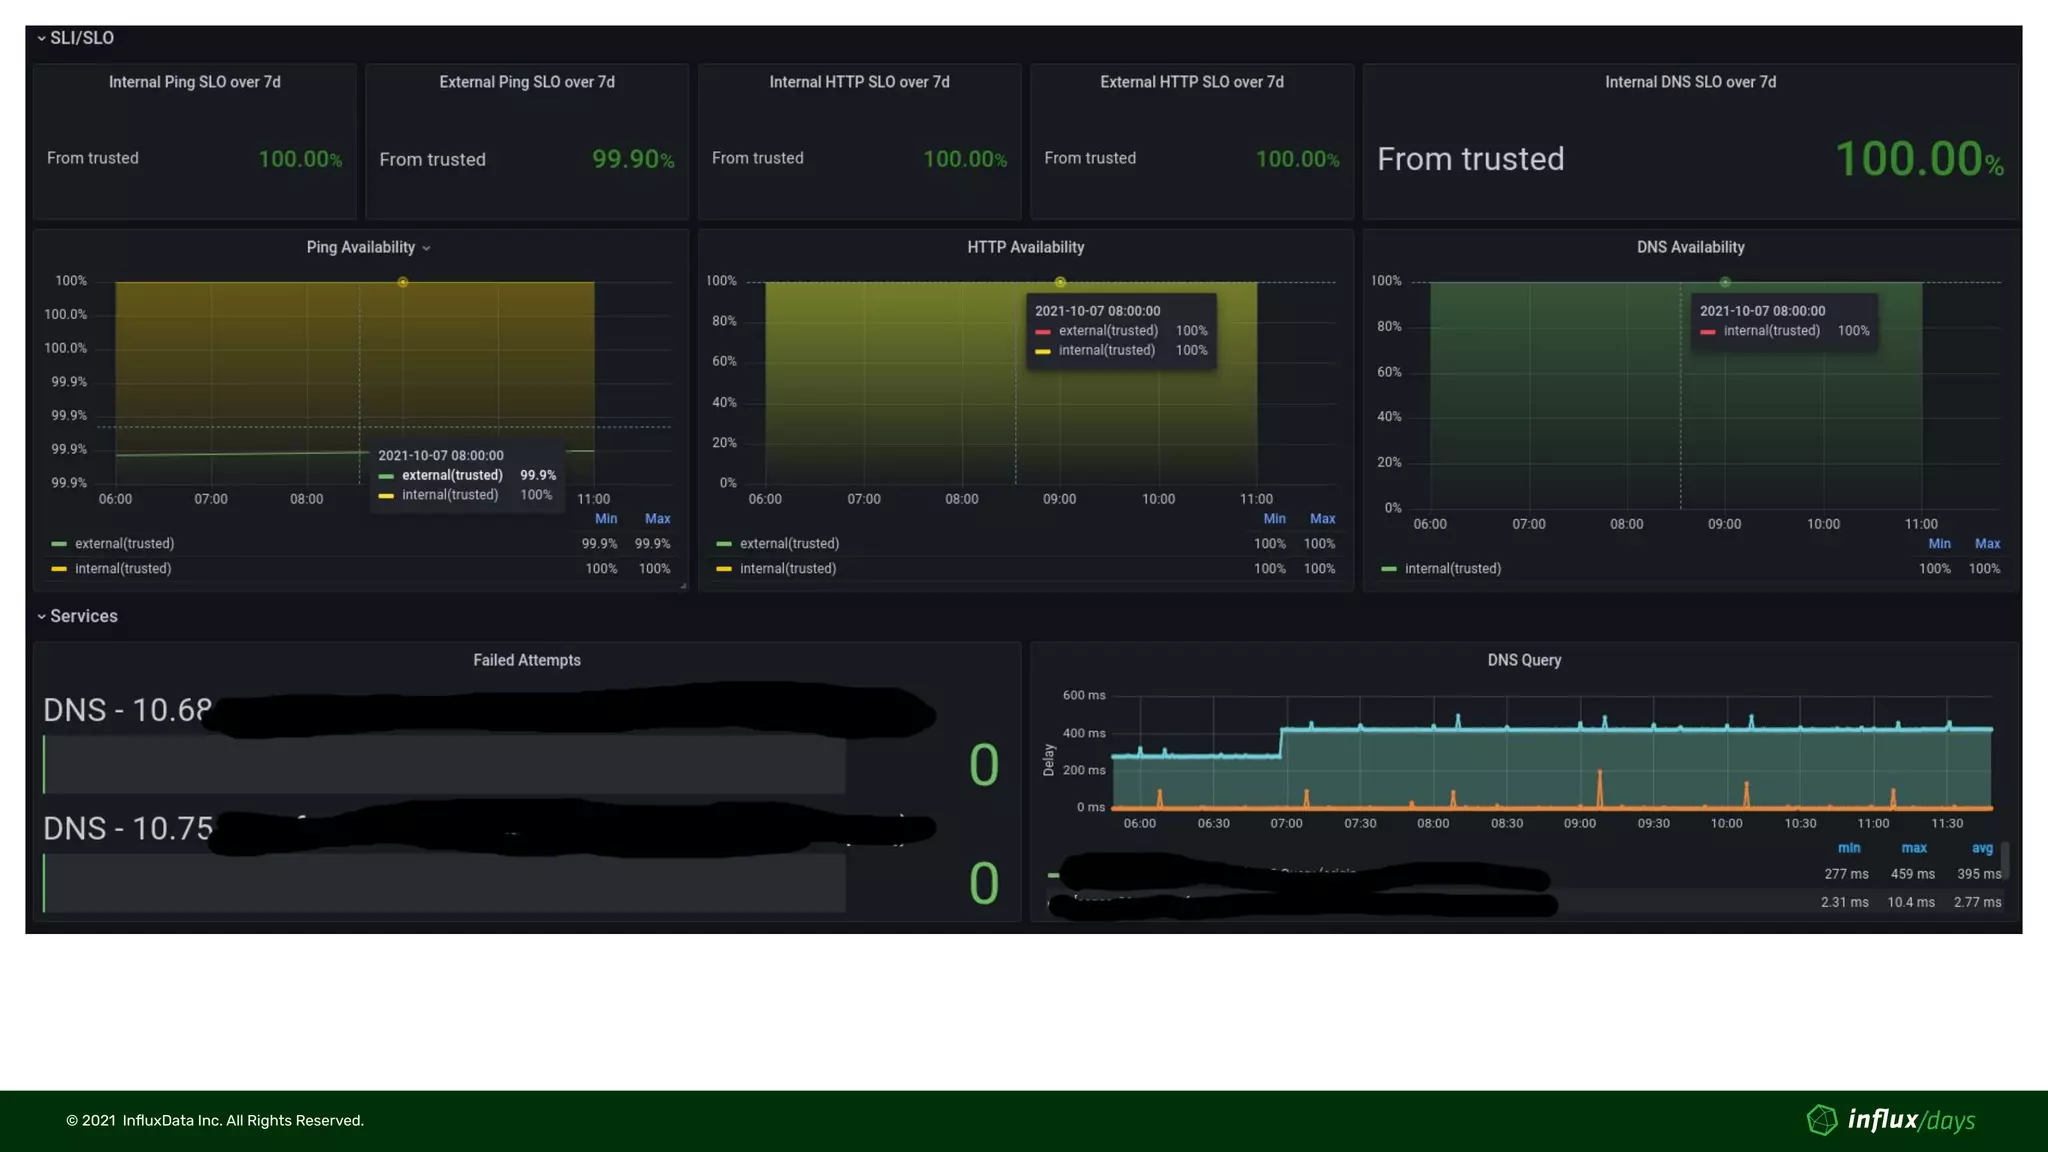
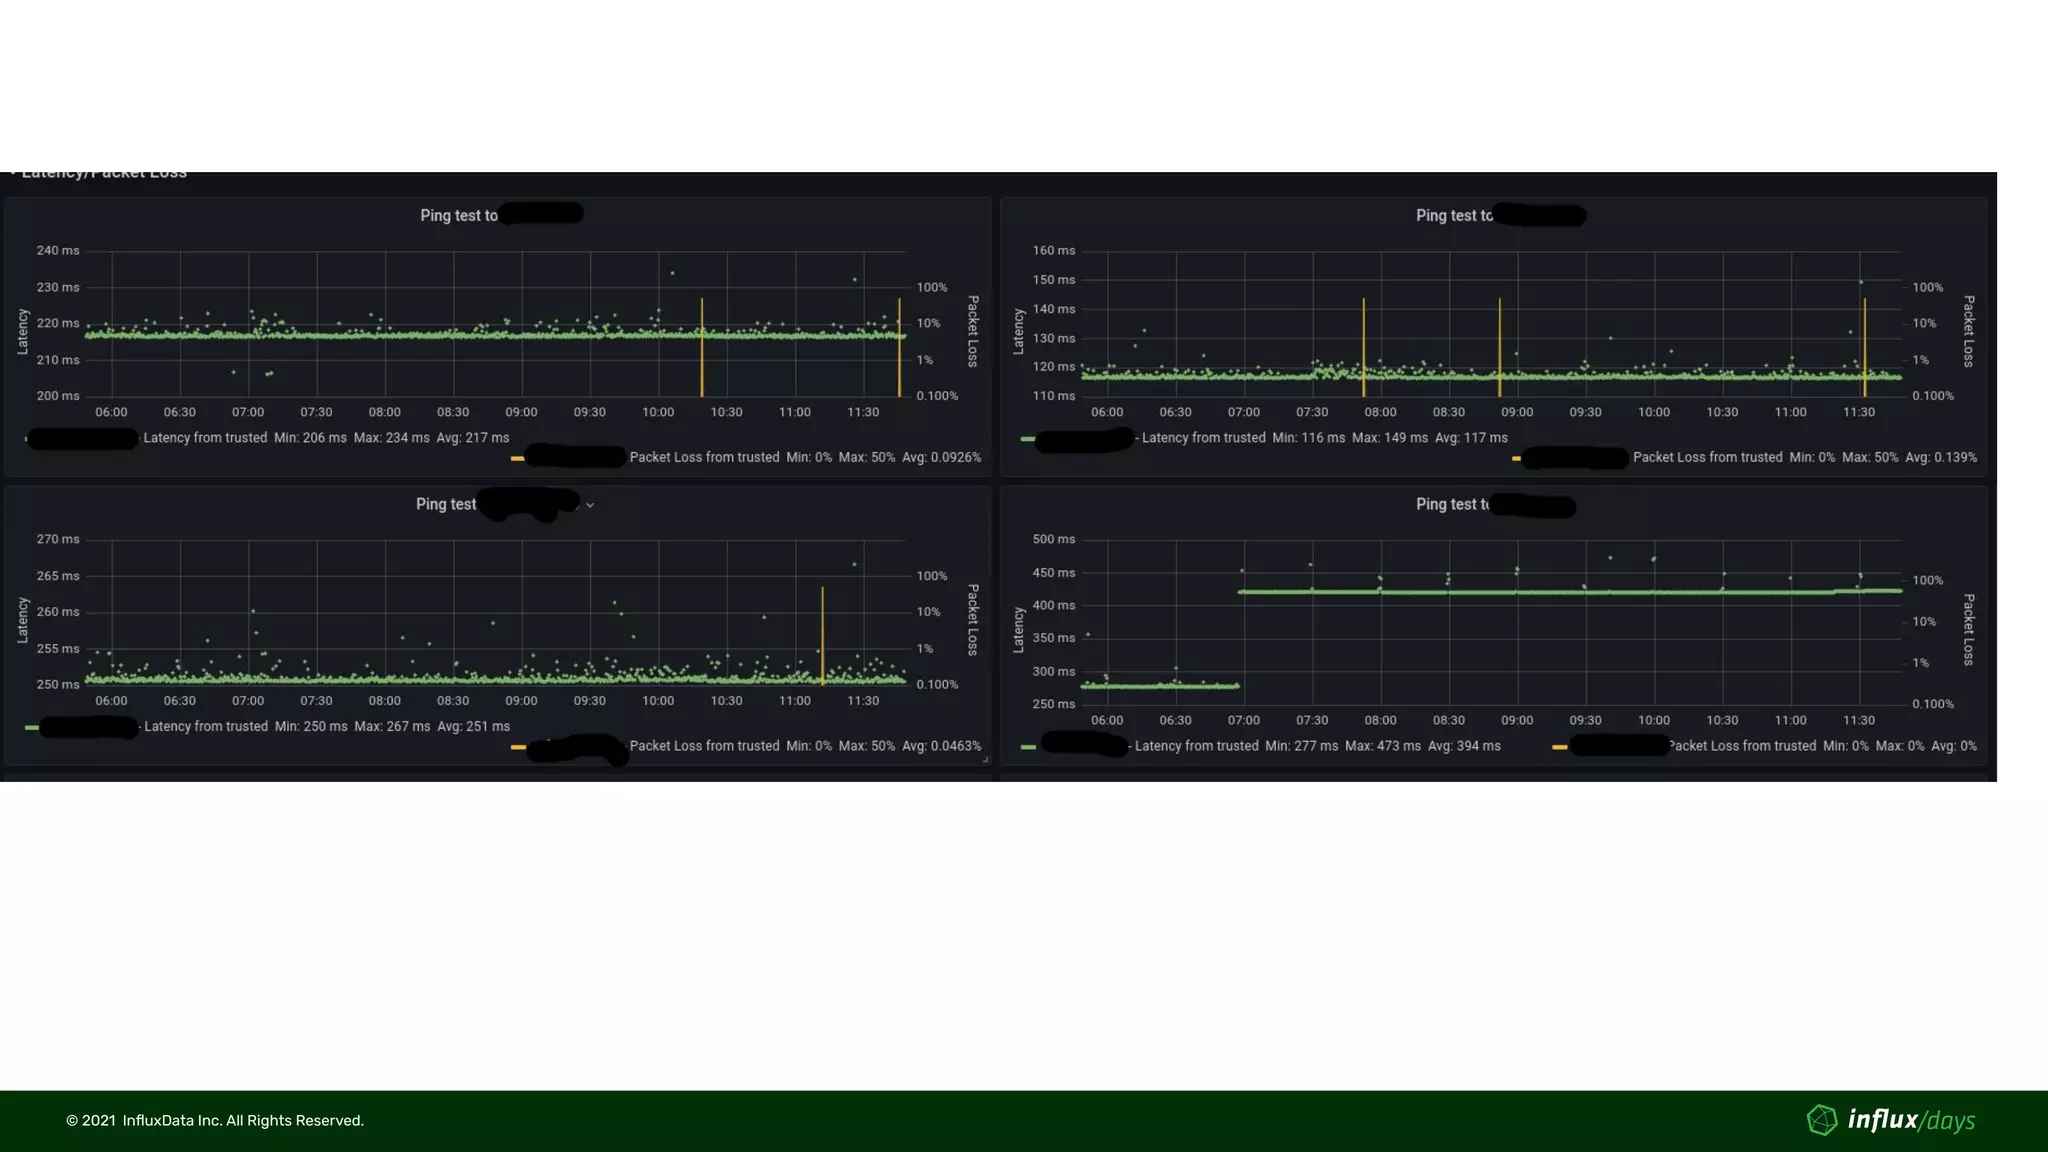
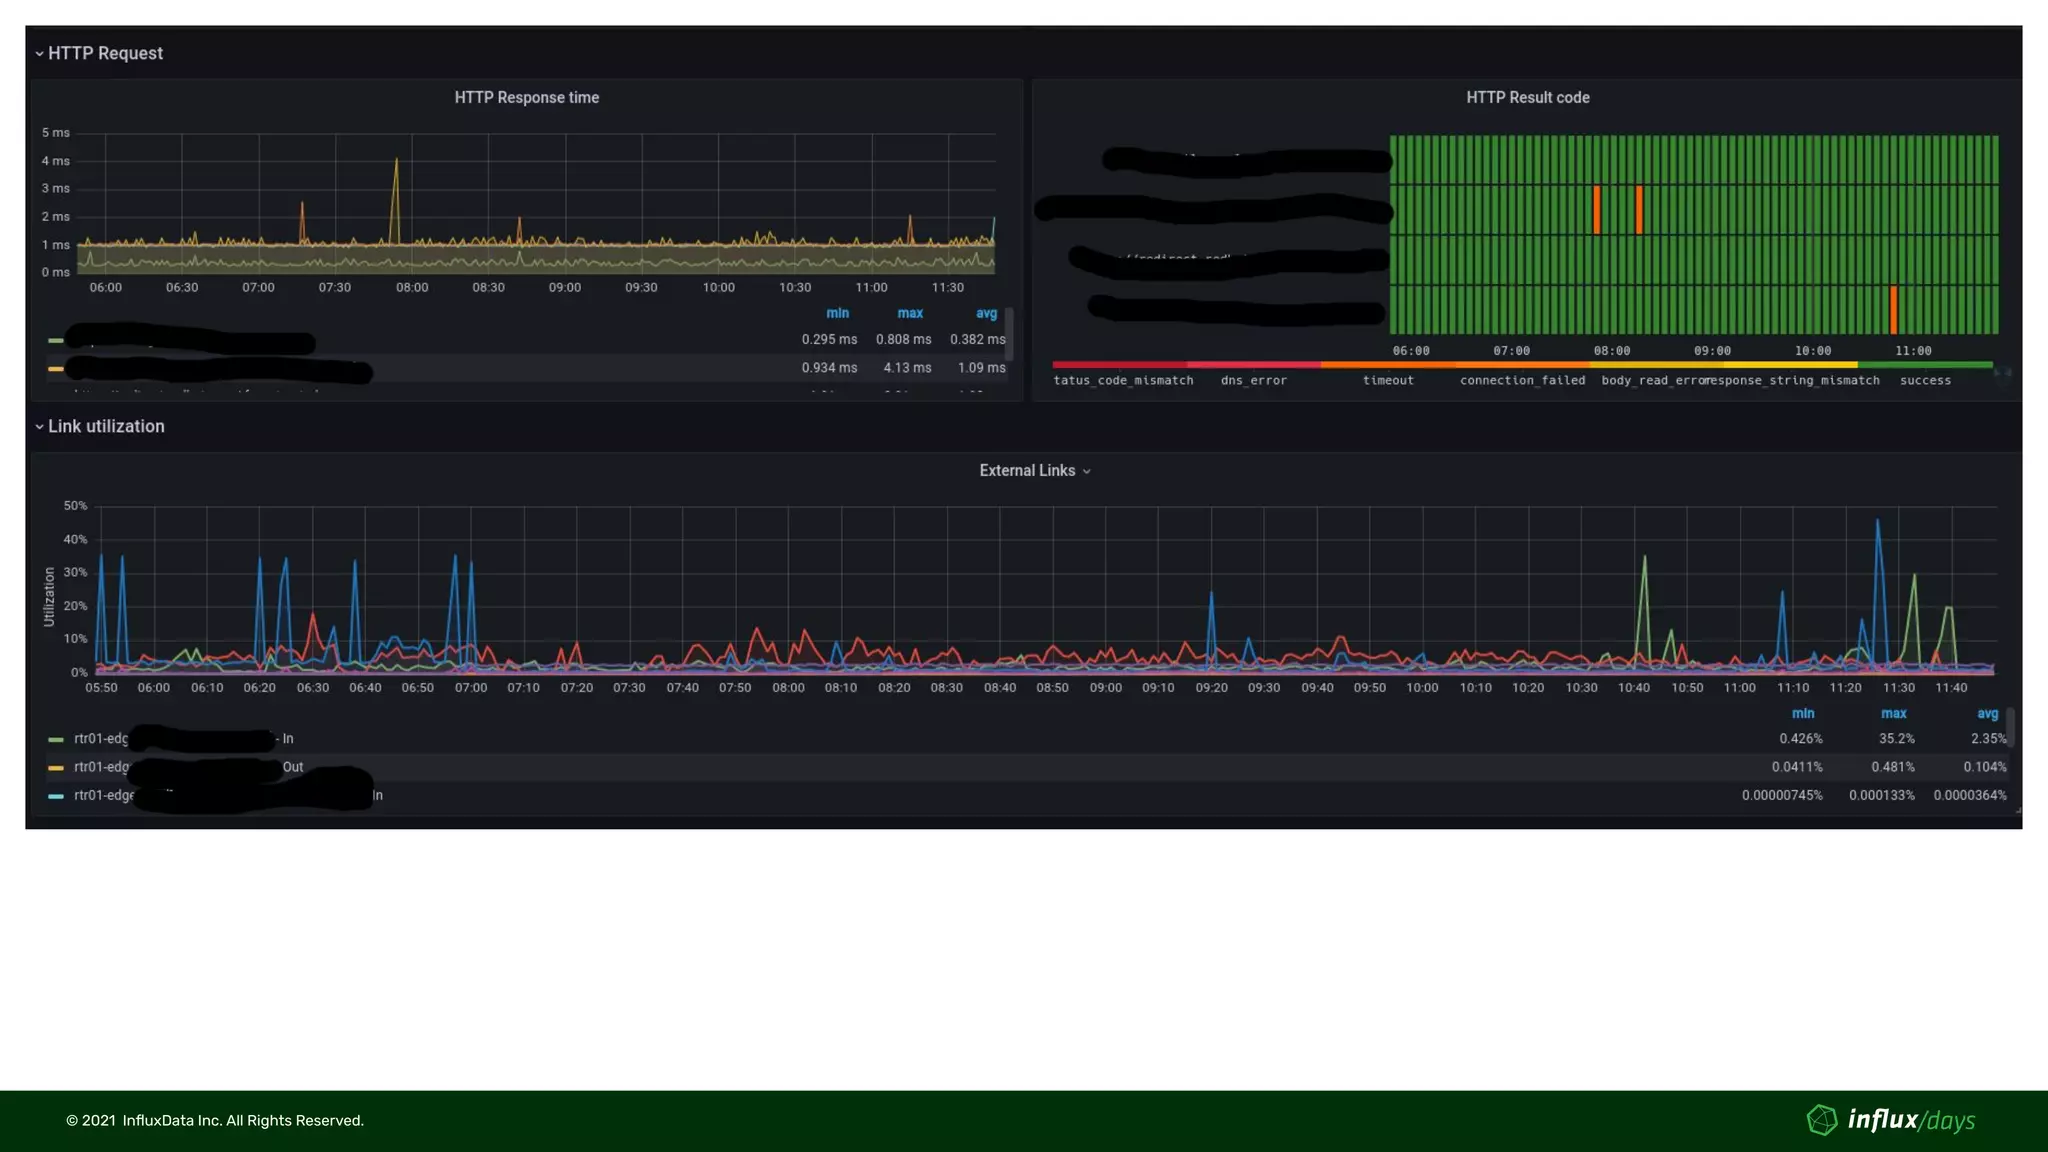
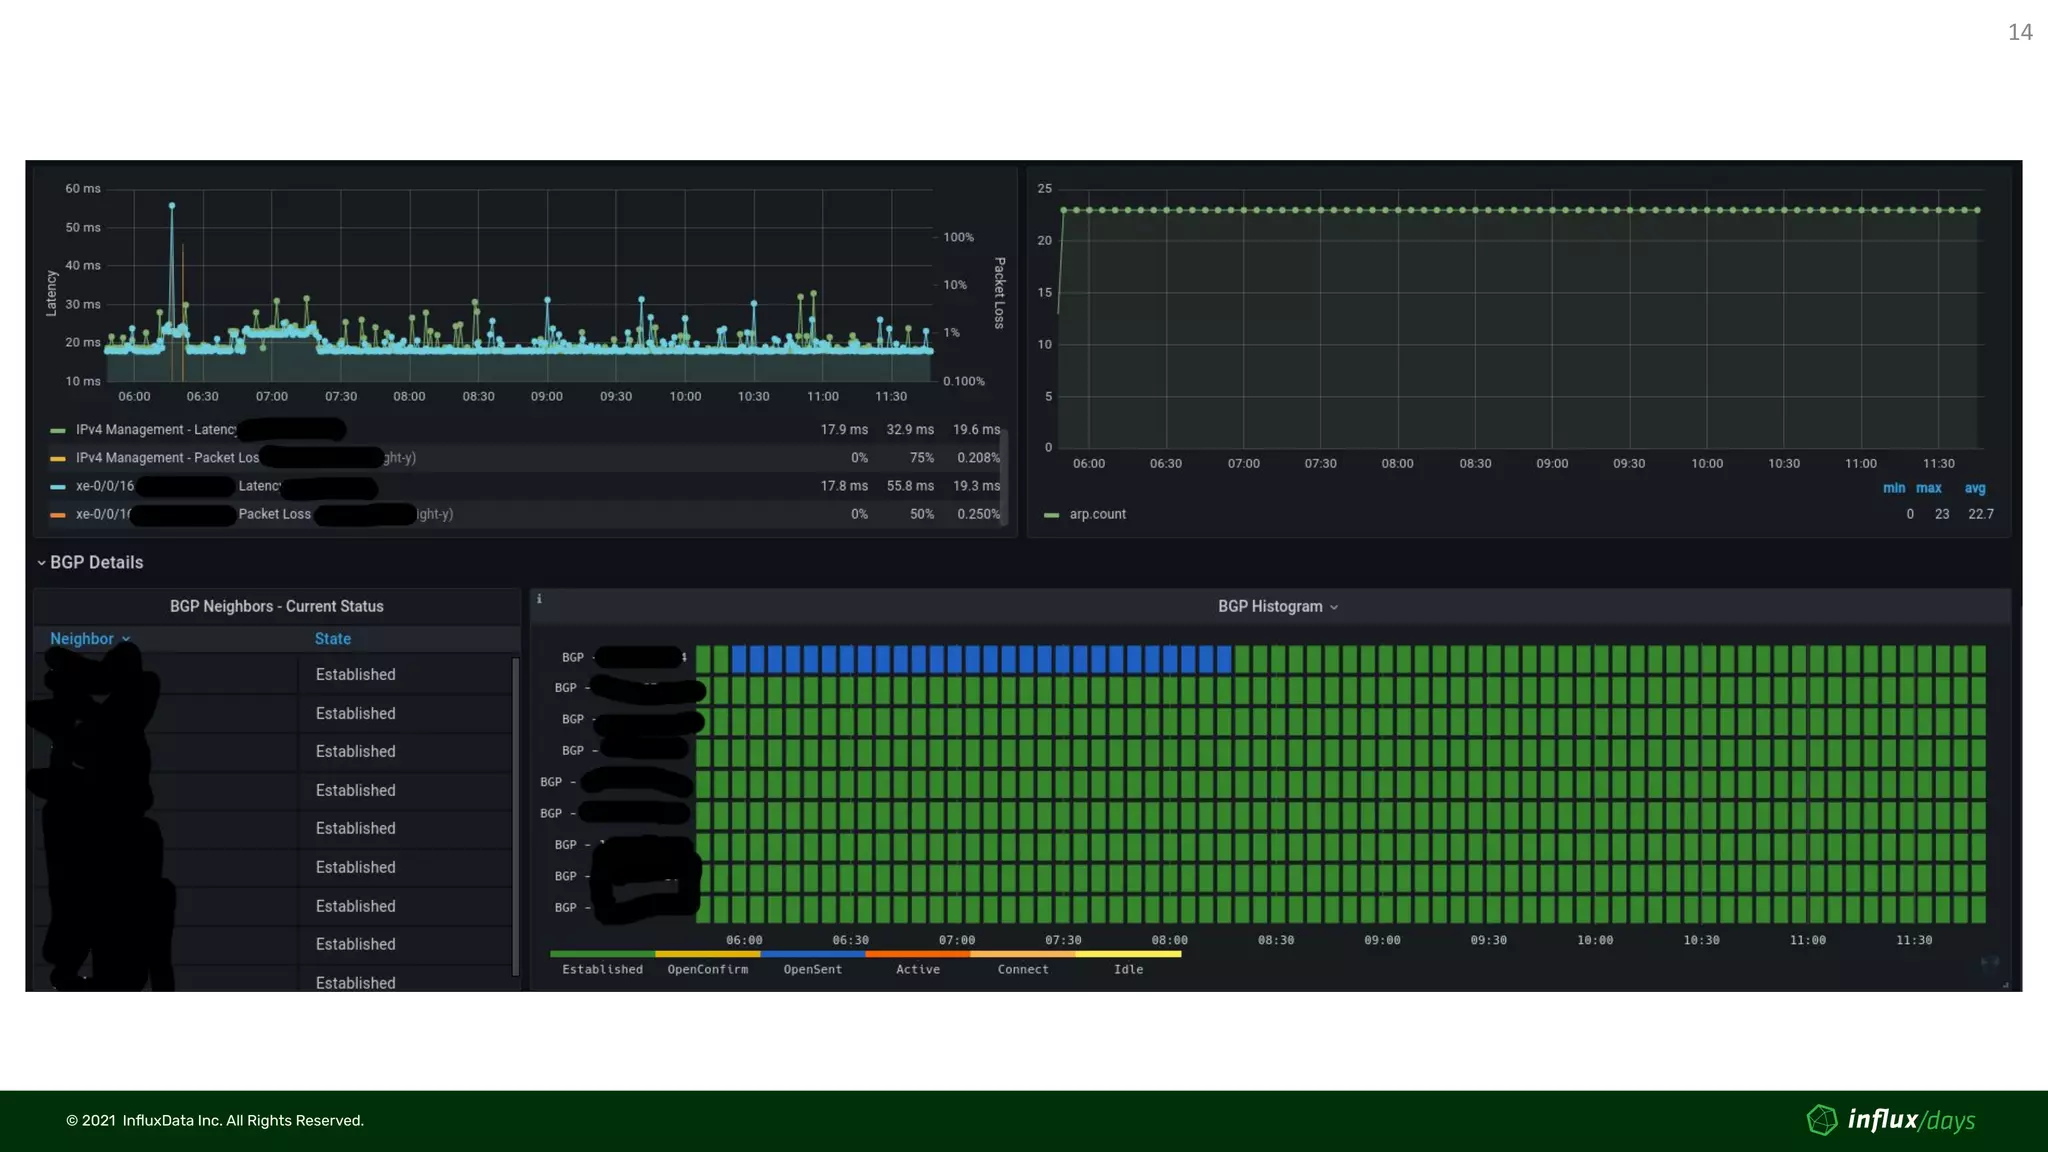
Visualizations - Immediate response
• Device detailed status
• Interface utilization (SNMP / gNMI)
• Interface errors (SNMP / gNMI)
• CPU/Memory utilization (SNMP)
• BGP neighbors status (SNMP / gNMI in progress)
• etc...
• Site View
• Data from probe (Latency, Packet loss, HTTP response time, DNS delay)
• SLI/SLO status (Kapacitor processed + Flux query)
• Internet link utilization (processed by Kapacitor)
• Top talkers (from other tool via RestAPI)
• Wireless status
• Statistics of WLC/APs and connected clients
© 2021  InfluxData Inc. All Rights Reserved.
14
© 2021  InfluxData Inc. All Rights Reserved.
Visualizations - Long-term planning
• Link capacity utilization
• Status page based on SLI/SLO
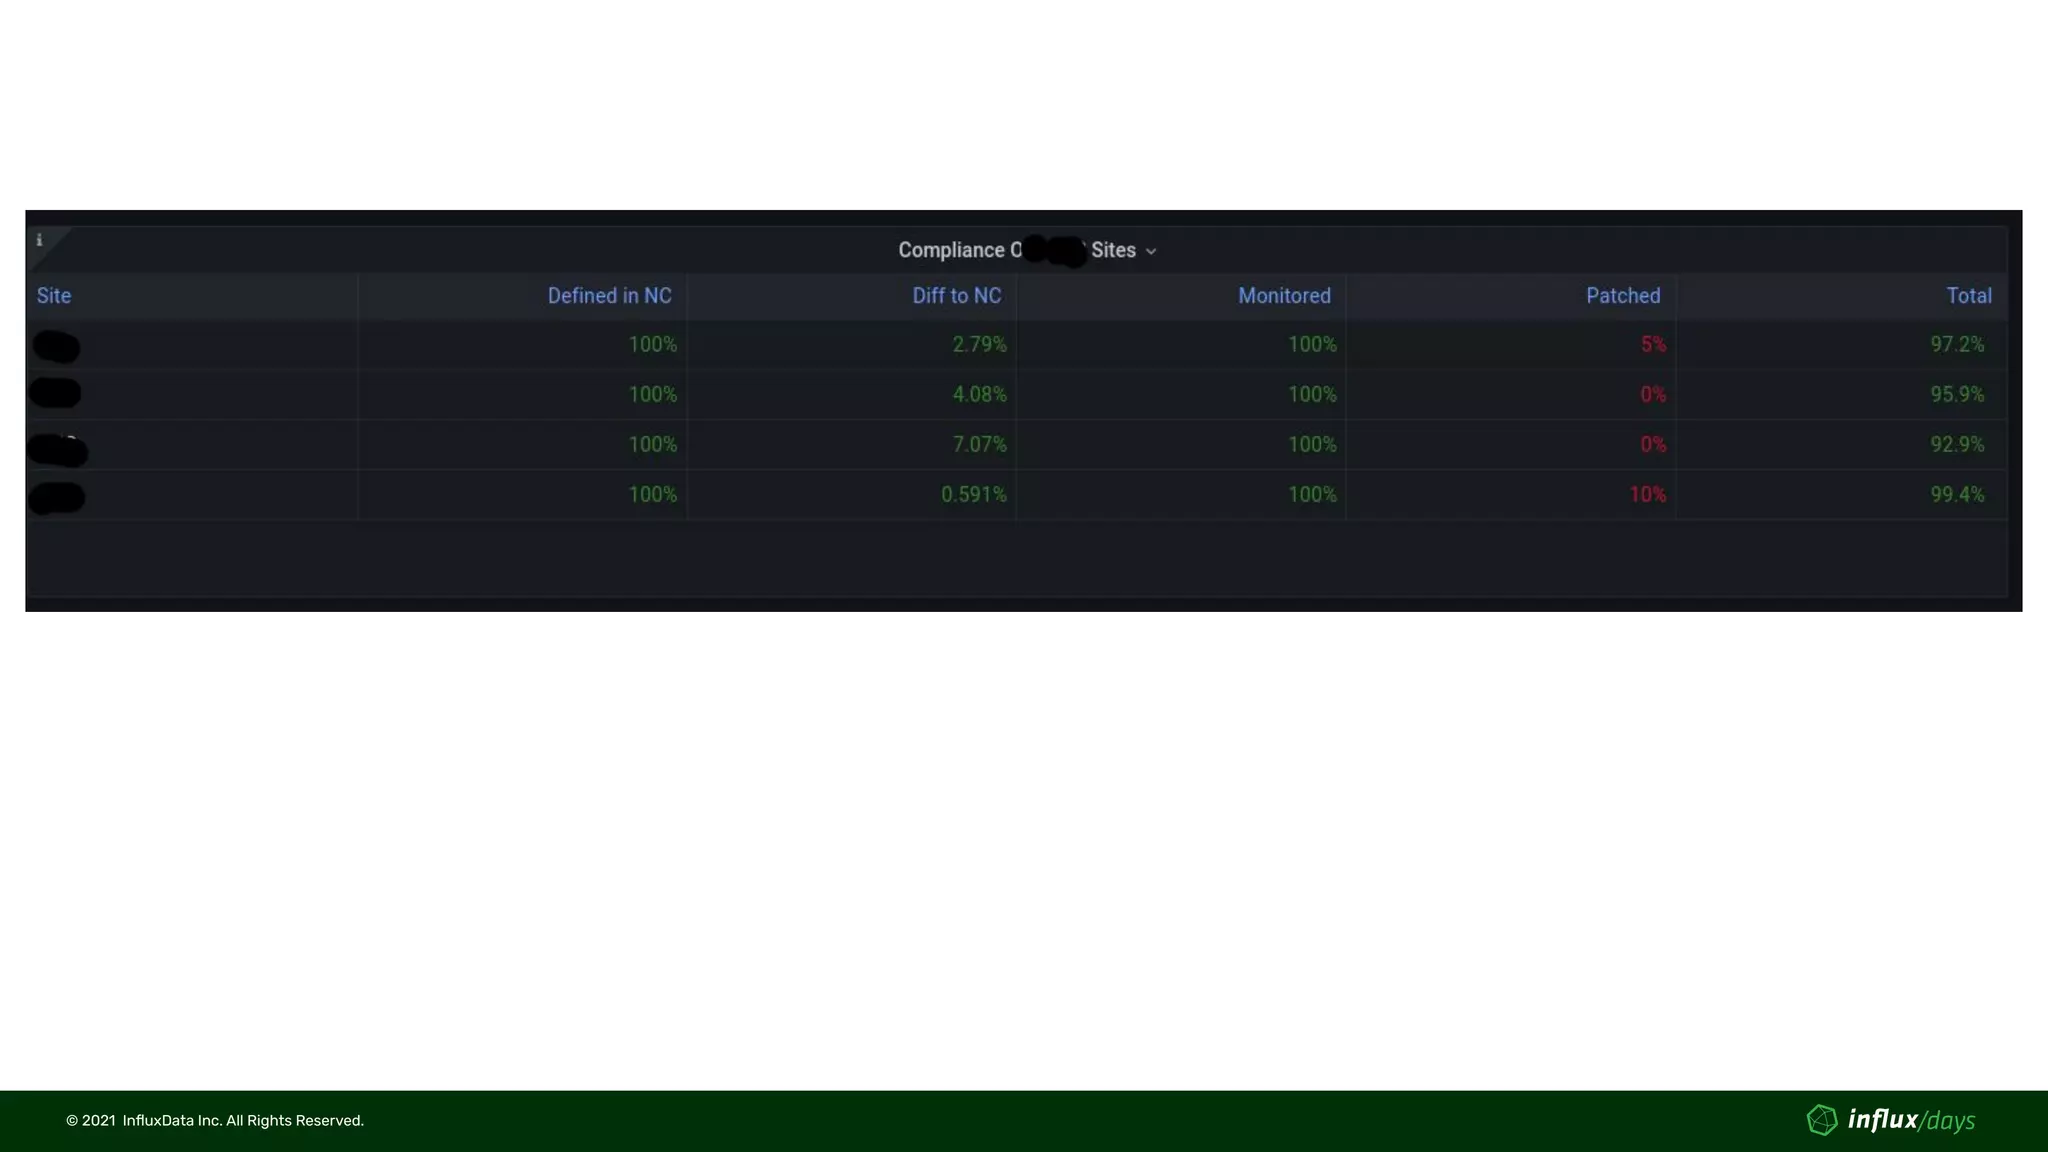
• Wireless AP (Cisco WLC) anomaly detection - Flux
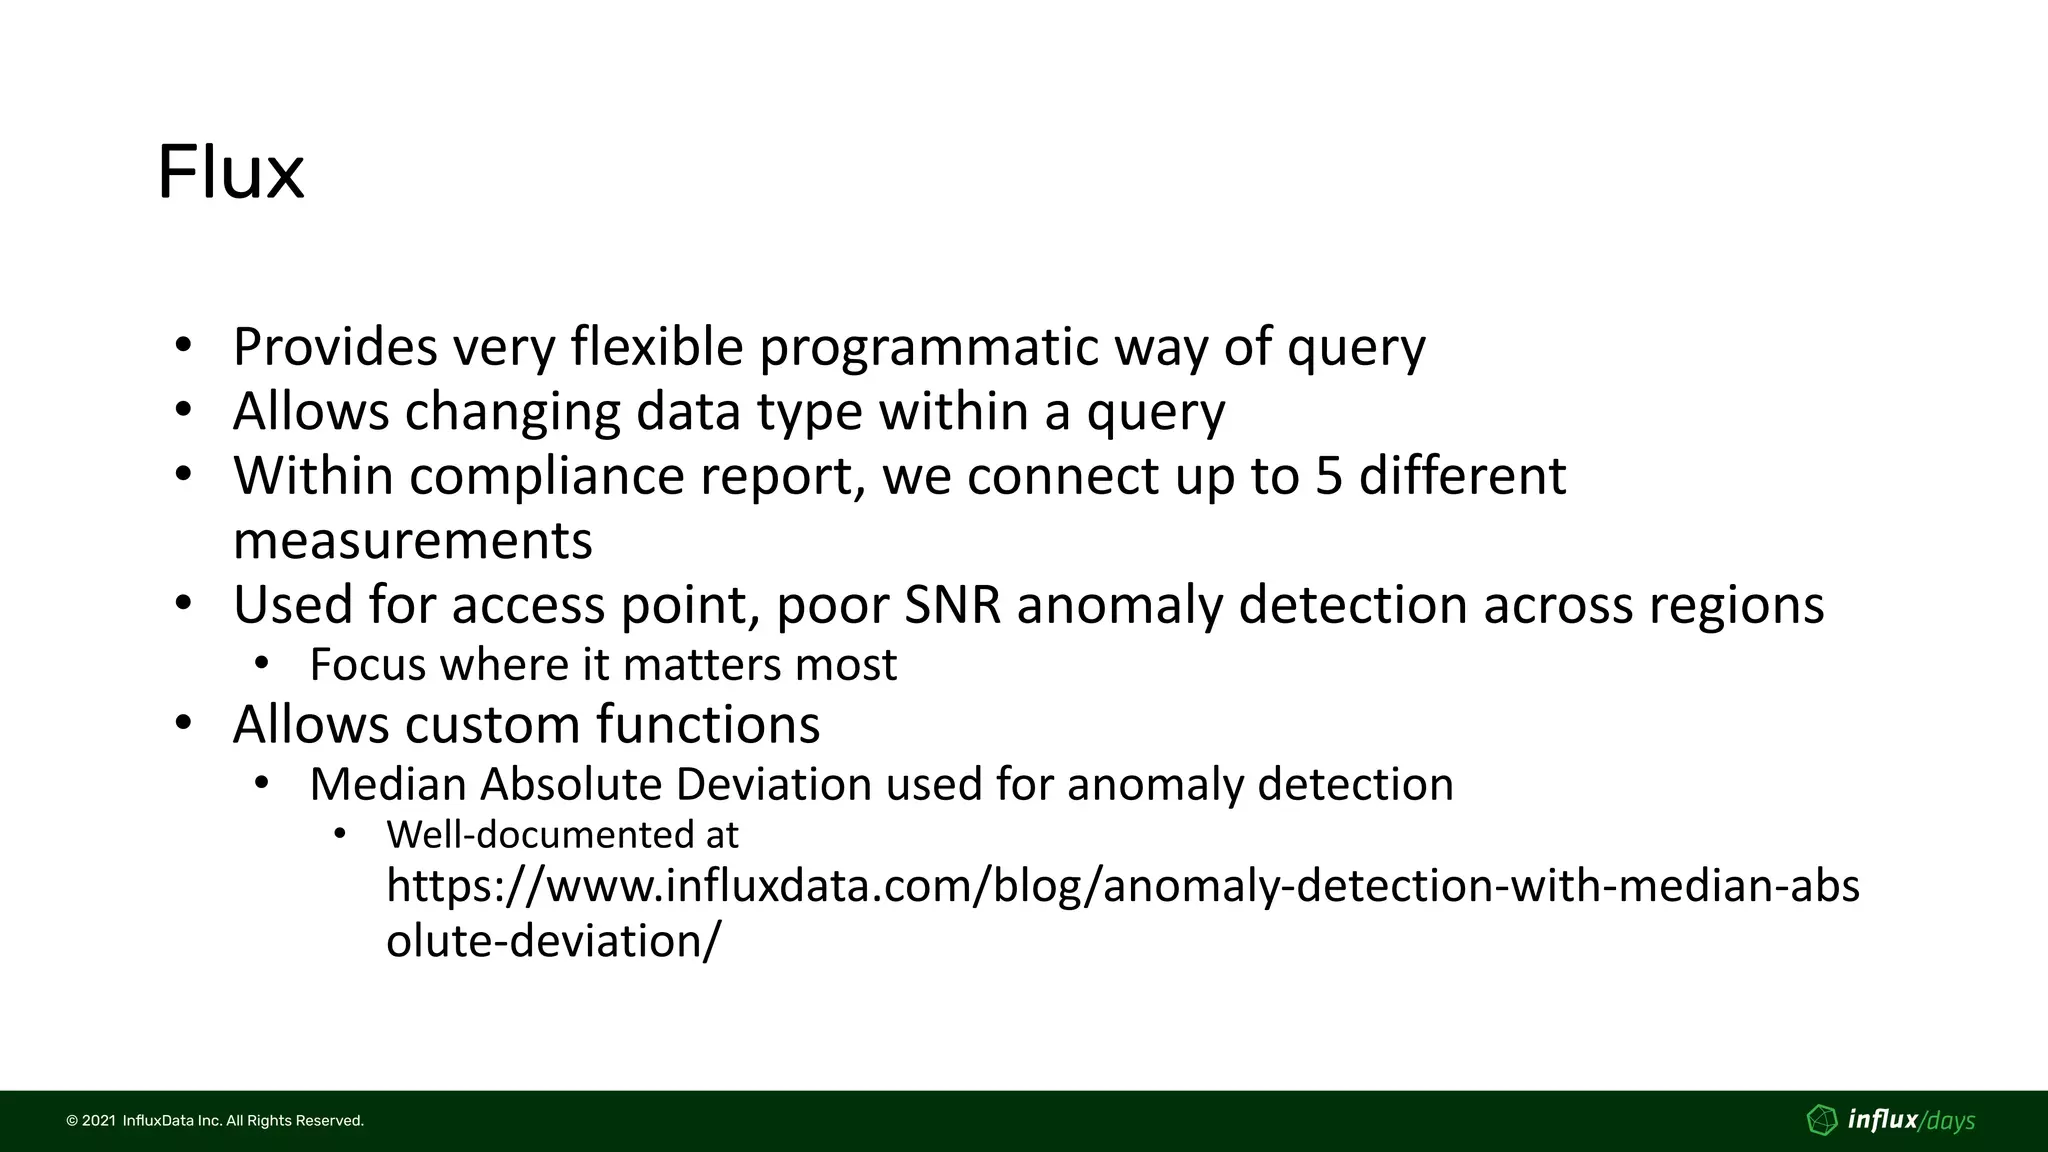
• Compliance reporting
© 2021  InfluxData Inc. All Rights Reserved.
Flux
• Provides very flexible programmatic way of query
• Allows changing data type within a query
• Within compliance report, we connect up to 5 different
measurements
• Used for access point, poor SNR anomaly detection across regions
• Focus where it matters most
• Allows custom functions
• Median Absolute Deviation used for anomaly detection
• Well-documented at
https://www.influxdata.com/blog/anomaly-detection-with-median-abs
olute-deviation/
© 2021  InfluxData Inc. All Rights Reserved.
Median Absolute Deviation - Function
import "math"
import "experimental"
mad = (table=<-, threshold=3.0) => {
data = table |> group(columns: ["_time"], mode:"by")
med = data |> median(column: "_value")
diff = join(tables: {data: data, med: med}, on: ["_time"], method: "inner")
|> map(fn: (r) => ({ r with _value: math.abs(x: r._value_data - r._value_med) }))
|> drop(columns: ["_start", "_stop", "_value_med", "_value_data"])
k = 1.4826
diff_med =
diff
|> median(column: "_value")
|> map(fn: (r) => ({ r with MAD: k * r._value}))
|> filter(fn: (r) => r.MAD > 0.0)
output = join(tables: {diff: diff, diff_med: diff_med}, on: ["_time"], method: "inner")
|> map(fn: (r) => ({ r with _value: r._value_diff/r._value_diff_med}))
|> map(fn: (r) => ({ r with
level:
if r._value >= threshold then "anomaly"
else "normal"
}))
return output
}
© 2021  InfluxData Inc. All Rights Reserved.
Median Absolute Deviation - Usage
pc_duration = from(bucket: "XXXXXX")
|> range(start: v.timeRangeStart, stop: v.timeRangeStop)
|> filter(fn: (r) =>
r._measurement == "bsnAPTable" and
r._field =~ /radio1PoorSNRClients|radio1Users/ and
r.region == "${region}"
)
|> pivot(rowKey:["_time"], columnKey: ["_field"], valueColumn: "_value")
|> filter(fn: (r) =>
r.radio1PoorSNRClients > 0 and
r.radio1Users > 0
)
|> map(fn: (r) => ({ r with CNPR: float(v: r.radio1PoorSNRClients) / float(v: r.radio1Users)}))
|> stateDuration(
fn: (r) => r.CNPR >= 0.1,
column: "duration"
)
|> map(fn: (r) => ({ r with _value: float(v: r.duration) / float(v: r.CNPR)}))
|> filter(fn: (r) => r._value > 0)
|> truncateTimeColumn(unit: 1h)
|> toFloat()
pc_duration |> mad(threshold:10.0)
|> filter(fn: (r) => r.level == "anomaly")
|> group(columns: ["APName"])
|> count()
|> group()
© 2021  InfluxData Inc. All Rights Reserved.
Questions?
© 2021  InfluxData Inc. All Rights Reserved.
Thank You

Martin Moucka [Red Hat] | How Red Hat Uses gNMI, Telegraf and InfluxDB to Gain Network Visibility | InfluxDays NA 2021

  • 1.
    How Red HatUses gNMI, Telegraf and InfluxDB to Gain Network Visibility Martin Moucka - Principal Network Engineer Red Hat
  • 2.
    © 2021  InfluxDataInc. All Rights Reserved. © 2021  InfluxData Inc. All Rights Reserved. Agenda • Introduction • Scope • Why InfluxDB? • Architecture • Visualizations • Flux
  • 3.
    © 2021  InfluxDataInc. All Rights Reserved. © 2021  InfluxData Inc. All Rights Reserved. Red Hat The world’s leading provider of open source enterprise IT solutions MORE THAN 90% of the FORTUNE 500 RED HAT use PRODUCTS & SOLUTIONS* ~13,815 EMPLOYEES 105+ OFFICES 40+ COUNTRIES THE FIRST $3 OPEN SOURCE COMPANY IN THE WORLD BILLION
  • 4.
    © 2021  InfluxDataInc. All Rights Reserved. Martin Moucka Principal Network Engineer, Red Hat ● With company for more than 7 years ● Built a network automation around Ansible, utilizing single source of truth ● Started transition to modern monitoring connected to the network automation ● Tech lead of Network Automation & Tools team E-mail: mmoucka@redhat.com
  • 5.
    © 2021  InfluxDataInc. All Rights Reserved. © 2021  InfluxData Inc. All Rights Reserved. Network Monitoring Network monitoring provides insight to the network. It monitors the status of network devices (switches, routers, firewalls, etc..), network status/performance. It provides a graphical view of metrics (e.g. link utilization) and/or device status (e.g. up or down) together with alerting when something is out of service. Key Capabilities of Network Monitoring Performance metric visualizations. Monitoring of the network for performance issues, display information in a visual format (Dashboards) - understand your network performance at a glance. Network alerts. Alert on any problems that occur. Discovery of issues from monitored data, augment alert data with relevant information helping support teams to respond quickly. Network mapping. Visualization of complex network landscapes in a map format including device/network health state. Bandwidth monitoring. Identify where network bandwidth usage is not optimal, and drive decisions to improve utilization.
  • 6.
    © 2021  InfluxDataInc. All Rights Reserved. © 2021  InfluxData Inc. All Rights Reserved. Scope • Juniper, Cisco (WLC, ASA, IOS, UCS, etc...), OpenGear, F5 and Mist • Custom probes for synthetic monitoring • 60+ sites • ~ 1.6k monitored devices • ~ 14k monitored interfaces • 5 collectors
  • 7.
    © 2021  InfluxDataInc. All Rights Reserved. © 2021  InfluxData Inc. All Rights Reserved. Why InfluxDB? • Open Source with Enterprise support • Efficient data storage • Flexibility in integrations/languages • Modular agent Telegraf with support of JTI (Juniper Telemetry Int.) • Support for SQL-like query language • Flux as powerful flexible query language
  • 8.
    © 2021  InfluxDataInc. All Rights Reserved. © 2021  InfluxData Inc. All Rights Reserved. Solution Architecture Distributed Monitoring Services / Storage Network Devices Telegraf/Kapacitor/InfluxDB Troubleshooting Network Automation Adding/Removing device Event Management Visualization Probes Alert Check / Send data Manual intervention Event Automation Troubleshooting Fix Configure Configure New monitored system/device
  • 9.
    © 2021  InfluxDataInc. All Rights Reserved. © 2021  InfluxData Inc. All Rights Reserved.
  • 10.
    © 2021  InfluxDataInc. All Rights Reserved. © 2021  InfluxData Inc. All Rights Reserved. Visualizations - Immediate response • Device detailed status • Interface utilization (SNMP / gNMI) • Interface errors (SNMP / gNMI) • CPU/Memory utilization (SNMP) • BGP neighbors status (SNMP / gNMI in progress) • etc... • Site View • Data from probe (Latency, Packet loss, HTTP response time, DNS delay) • SLI/SLO status (Kapacitor processed + Flux query) • Internet link utilization (processed by Kapacitor) • Top talkers (from other tool via RestAPI) • Wireless status • Statistics of WLC/APs and connected clients
  • 11.
    © 2021  InfluxDataInc. All Rights Reserved. © 2021  InfluxData Inc. All Rights Reserved.
  • 12.
    © 2021  InfluxDataInc. All Rights Reserved. © 2021  InfluxData Inc. All Rights Reserved.
  • 13.
    © 2021  InfluxDataInc. All Rights Reserved. © 2021  InfluxData Inc. All Rights Reserved.
  • 14.
    © 2021  InfluxDataInc. All Rights Reserved. 14 © 2021  InfluxData Inc. All Rights Reserved.
  • 15.
    © 2021  InfluxDataInc. All Rights Reserved. © 2021  InfluxData Inc. All Rights Reserved. Visualizations - Long-term planning • Link capacity utilization • Status page based on SLI/SLO • Wireless AP (Cisco WLC) anomaly detection - Flux • Compliance reporting
  • 16.
    © 2021  InfluxDataInc. All Rights Reserved. © 2021  InfluxData Inc. All Rights Reserved.
  • 17.
    © 2021  InfluxDataInc. All Rights Reserved. © 2021  InfluxData Inc. All Rights Reserved.
  • 18.
    © 2021  InfluxDataInc. All Rights Reserved. © 2021  InfluxData Inc. All Rights Reserved. Flux • Provides very flexible programmatic way of query • Allows changing data type within a query • Within compliance report, we connect up to 5 different measurements • Used for access point, poor SNR anomaly detection across regions • Focus where it matters most • Allows custom functions • Median Absolute Deviation used for anomaly detection • Well-documented at https://www.influxdata.com/blog/anomaly-detection-with-median-abs olute-deviation/
  • 19.
    © 2021  InfluxDataInc. All Rights Reserved. © 2021  InfluxData Inc. All Rights Reserved. Median Absolute Deviation - Function import "math" import "experimental" mad = (table=<-, threshold=3.0) => { data = table |> group(columns: ["_time"], mode:"by") med = data |> median(column: "_value") diff = join(tables: {data: data, med: med}, on: ["_time"], method: "inner") |> map(fn: (r) => ({ r with _value: math.abs(x: r._value_data - r._value_med) })) |> drop(columns: ["_start", "_stop", "_value_med", "_value_data"]) k = 1.4826 diff_med = diff |> median(column: "_value") |> map(fn: (r) => ({ r with MAD: k * r._value})) |> filter(fn: (r) => r.MAD > 0.0) output = join(tables: {diff: diff, diff_med: diff_med}, on: ["_time"], method: "inner") |> map(fn: (r) => ({ r with _value: r._value_diff/r._value_diff_med})) |> map(fn: (r) => ({ r with level: if r._value >= threshold then "anomaly" else "normal" })) return output }
  • 20.
    © 2021  InfluxDataInc. All Rights Reserved. © 2021  InfluxData Inc. All Rights Reserved. Median Absolute Deviation - Usage pc_duration = from(bucket: "XXXXXX") |> range(start: v.timeRangeStart, stop: v.timeRangeStop) |> filter(fn: (r) => r._measurement == "bsnAPTable" and r._field =~ /radio1PoorSNRClients|radio1Users/ and r.region == "${region}" ) |> pivot(rowKey:["_time"], columnKey: ["_field"], valueColumn: "_value") |> filter(fn: (r) => r.radio1PoorSNRClients > 0 and r.radio1Users > 0 ) |> map(fn: (r) => ({ r with CNPR: float(v: r.radio1PoorSNRClients) / float(v: r.radio1Users)})) |> stateDuration( fn: (r) => r.CNPR >= 0.1, column: "duration" ) |> map(fn: (r) => ({ r with _value: float(v: r.duration) / float(v: r.CNPR)})) |> filter(fn: (r) => r._value > 0) |> truncateTimeColumn(unit: 1h) |> toFloat() pc_duration |> mad(threshold:10.0) |> filter(fn: (r) => r.level == "anomaly") |> group(columns: ["APName"]) |> count() |> group()
  • 21.
    © 2021  InfluxDataInc. All Rights Reserved. Questions?
  • 22.
    © 2021  InfluxDataInc. All Rights Reserved. Thank You