Big Picture
• Introductionto Python libraries- Pandas, Matplotlib.
• Data structures in Pandas - Series and Data Frames.
• Series: Creation of Series from – ndarray, dictionary, scalar value;
mathematical operations; Head and Tail functions; Selection, Indexing and
Slicing.
• Data Frames:
• Text/CSV files
• Operations on rows and columns: add, select, delete, rename;
• Head and Tail functions;
• Indexing using Labels, Boolean Indexing;
• Importing/Exporting Data between CSV files and Data Frames.
3.
PRETEST
1. In lists,you can change the elements of a list in place.
(True/False)
2. The _______ brackets are used to enclose the values of a list.
3. l1= list(‘ClassXI’) returns :
4. The position of each element in the list is considered as
___________.
5. The property which changes the element of a list in place
but not changes the memory address is known as
__________.
4.
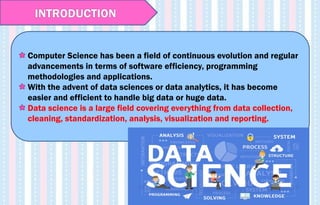
Computer Science hasbeen a field of continuous evolution and regular
advancements in terms of software efficiency, programming
methodologies and applications.
With the advent of data sciences or data analytics, it has become
easier and efficient to handle big data or huge data.
Data science is a large field covering everything from data collection,
cleaning, standardization, analysis, visualization and reporting.
INTRODUCTION
5.
DATA PROCESSING
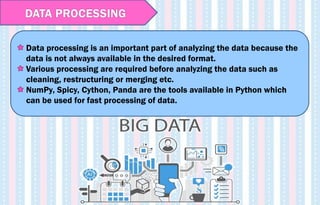
Data processingis an important part of analyzing the data because the
data is not always available in the desired format.
Various processing are required before analyzing the data such as
cleaning, restructuring or merging etc.
NumPy, Spicy, Cython, Panda are the tools available in Python which
can be used for fast processing of data.
6.
DATA LIFE CYCLE
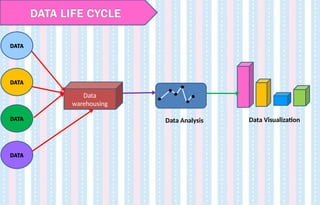
1.Data warehouse-
Data is stored in different formats- .csv file, an excel file, html file etc.
This data is converted into a single format and stored in a data warehouse.
It is a repository that collects data from various data sources of an organization and
arranges it into a structured format.
2. Data Analysis -
After storing data, we can perform analysis on it ie.. join and merge data, search for
data etc.
Data Analysis is the process of bringing order and structure to collected data which is
then processed to information.
3. Data Visualization-
After analysis we can plot this data in the form of a graph.
Data visualization is the process of putting data into a chart, graph, or other visual
format.
All these operations can be easily and effectively done by Python and its libraries.
Python library isa collection of functions and methods which can be
used to perform any functions without writing your code.
Pandas is built on top of two core Python libraries—matplotlib for
data visualization and NumPy for mathematical operations.
Pandas acts as a wrapper over these libraries, allowing you to
access many of matplotlib's and NumPy's methods with less code.
PYTHON LIBRARIES
9.
The Pandas isa high-performance open source library for data
analysis in Python developed by Wes McKinney in 2008.
The name Pandas is derived from the word Panel Data System– an
Econometrics from Multidimensional data.
It makes data importing and data analyzing easier.
It is a most famous Python package for data science, which offers
powerful and flexible data structures that make data analysis and
manipulation easy.
Guido van Rossum
PYTHON PANDAS INTRODUCTION
10.
Pandas builds onpackages like NumPy and matplotlib to give us a
single & convenient place for data analysis and visualization work.
It is built on NumPy and its key data structure is called DataFrame
Python with Pandas is used in a wide range of fields including
academic and commercial domains including finance, economics,
Statistics, analytics, etc.
PYTHON PANDAS
11.
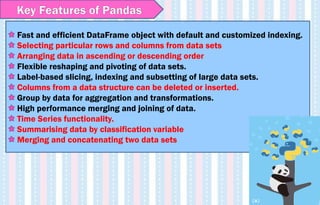
Fast and efficientDataFrame object with default and customized indexing.
Selecting particular rows and columns from data sets
Arranging data in ascending or descending order
Flexible reshaping and pivoting of data sets.
Label-based slicing, indexing and subsetting of large data sets.
Columns from a data structure can be deleted or inserted.
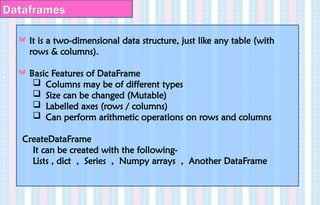
Group by data for aggregation and transformations.
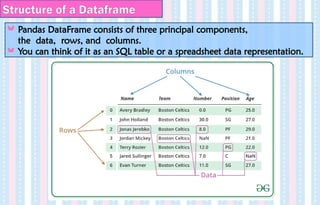
High performance merging and joining of data.
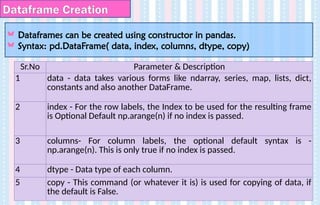
Time Series functionality.
Summarising data by classification variable
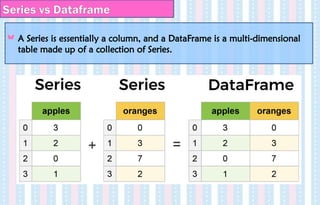
Merging and concatenating two data sets
Key Features of Pandas
12.
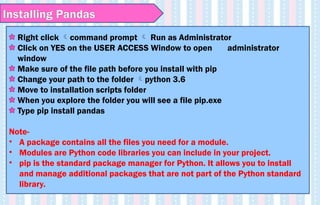
Right click commandprompt Run as Administrator
Click on YES on the USER ACCESS Window to open administrator
window
Make sure of the file path before you install with pip
Change your path to the folder python 3.6
Move to installation scripts folder
When you explore the folder you will see a file pip.exe
Type pip install pandas
Note-
• A package contains all the files you need for a module.
• Modules are Python code libraries you can include in your project.
• pip is the standard package manager for Python. It allows you to install
and manage additional packages that are not part of the Python standard
library.
Installing Pandas
Pandas Datatypes :
Pandasdtype Python Type NumPy type Usage
object Str String_, unicode_ Text
int64 Int int, int8, int16, int32,
int64, uint8, uint16,
uint32, uint64
Integer
numbers
float64 Float float, float16, float32,
float64
Floating point
numbers
bool bool bool True / False
datetime64 NA datetime64[ns] Date & Time
values
15.
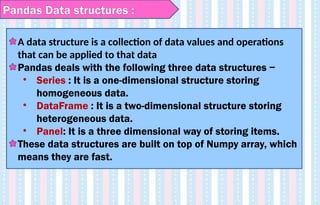
Pandas Data structures:
A data structure is a collection of data values and operations
that can be applied to that data
Pandas deals with the following three data structures −
• Series : It is a one-dimensional structure storing
homogeneous data.
• DataFrame : It is a two-dimensional structure storing
heterogeneous data.
• Panel: It is a three dimensional way of storing items.
These data structures are built on top of Numpy array, which
means they are fast.
16.
Series
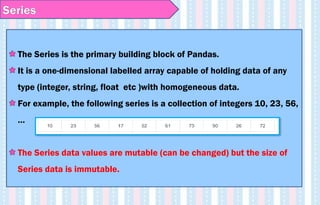
The Series isthe primary building block of Pandas.
It is a one-dimensional labelled array capable of holding data of any
type (integer, string, float etc )with homogeneous data.
For example, the following series is a collection of integers 10, 23, 56,
…
The Series data values are mutable (can be changed) but the size of
Series data is immutable.
17.
Series
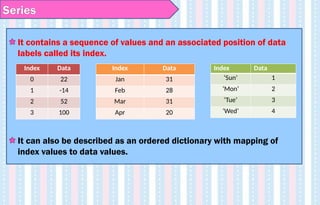
It contains asequence of values and an associated position of data
labels called its index.
It can also be described as an ordered dictionary with mapping of
index values to data values.
Index Data
0 22
1 -14
2 52
3 100
Index Data
Jan 31
Feb 28
Mar 31
Apr 20
Index Data
‘Sun’ 1
‘Mon’ 2
‘Tue’ 3
‘Wed’ 4
18.
Creation of Series
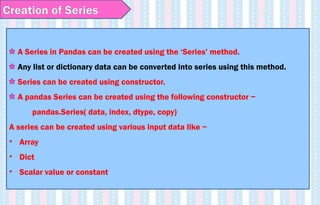
ASeries in Pandas can be created using the ‘Series’ method.
Any list or dictionary data can be converted into series using this method.
Series can be created using constructor.
A pandas Series can be created using the following constructor −
pandas.Series( data, index, dtype, copy)
A series can be created using various input data like −
• Array
• Dict
• Scalar value or constant
19.
A basic series,which can be created is an Empty Series.
Example - [Here ‘s’ is the Series Object]
import pandas as pd
s = pd.Series()
print s
Its output is as follows −
Series([], dtype: float64)
Note –
• Series () displays an empty list along with its default data type.
• Pd is an alternate name given to the Pandas module. Its significance is that we
can use ‘pd’ instead of typing Pandas every time we need to use it.
• Import statement is used for loading Pandas module into the memory and can
be used to work with.
Creation of Empty Series
20.
Creating DataSeries witha list
Syntax:
<Series Object>=pandas.Series([data],index=[index])
Eg:-
import pandas as pd
s=pd.Series( [ 2,4,6,8,10])
print(s)
S- is a series variable
Series() – method displays a list along with
default data type
pd is the alternative name given to panda
module
Import statement is used to load pandas
module into the memory and can be used
21.
Program- DataSeries
>>> s=pandas.Series ( [3,-5,7,4] , index=['a','b','c','d‘] )
>>> s
Output:
a 3
b -5
c 7
d 4
dtype: int64
22.
>>> st =pd.Series([20, 70, 10], index=['frog', 'fish', 'hawk'])
>>> st
frog 20
fish 70
hawk 10
dtype: int64
>>> st.index.name = 'Animals'
>>> st
Animals
frog 20
fish 70
hawk 10
dtype: int64
Program
23.
Activity
• Create aseries having names of any five famous
monuments of India and assign their States as
index values.
24.
Think and Reflect
•While importing Pandas, is it mandatory to
always use pd as an alias name? What would
happen if we give any other name?
• Try it and write your explanation in the
notebook.
Starter
• Create alist of 7 emirates and create a series from
that with index values showing it from 1 to 7 .
29.
Think ?
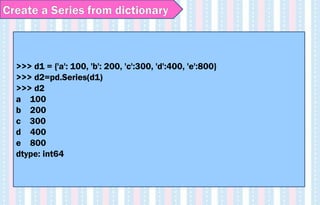
• Isit possible to create a series from dictionary and
how?
• What will be the index value of that series ?
30.
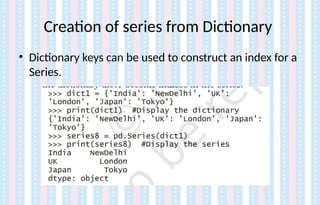
Creation of seriesfrom Dictionary
• Dictionary keys can be used to construct an index for a
Series.
31.
Attribute of Series
•Series support vector operations.
• Any operation gets performed on every single element.
Eg:-
import pandas as pd
List = [5, 2, 3,7]
s1= pd.Series (List)
Guess the output of these statements:
print (list *2)
print (s1*2)
32.
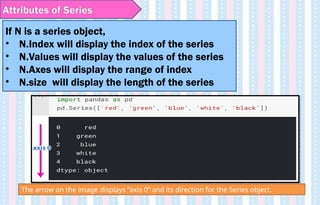
Attributes of Series
IfN is a series object,
• N.Index will display the index of the series
• N.Values will display the values of the series
• N.Axes will display the range of index
• N.size will display the length of the series
The arrow on the image displays “axis 0” and its direction for the Series object.
33.
In Python, one-dimensionalstructures are displayed as a row of
values. On the contrary, here we see that Series is displayed as a
column of values.
Each cell in Series is accessible via index value along the “axis 0”. For
our Series object indexes are: 0, 1, 2, 3, 4. Here is an example of
accessing different values:
import pandas as pd
N=pd.Series([‘Red’, ‘Green’,’Yellow’,’Orange’, Blue’])
print(N[0])
print (N.axes)
Red
[RangeIndex(start=0, stop=5, step=1)]
Axis in Series
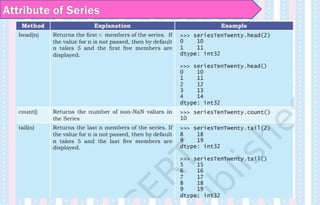
ACCESSING ROWS USINGHEAD () AND TAIL() FUNCTION
Series.head() function will display the top 5 rows in the series.
Series.tail() function will display the last 5 rows in the series
In both the functions, if a number is passed as parameter Pandas will
print the specified number of rows.
Eg:-
>>> a=pd.Series([2,4,6,8,10,12,14,16])
>>> a.head()
0 2
1 4
2 6
3 8
4 10
dtype: int64
36.
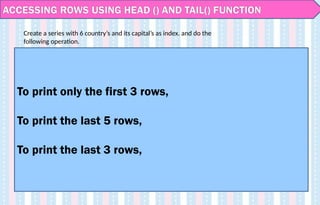
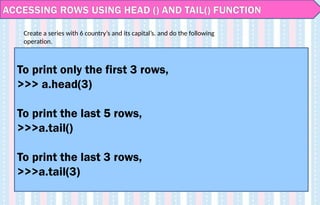
ACCESSING ROWS USINGHEAD () AND TAIL() FUNCTION
To print only the first 3 rows,
To print the last 5 rows,
To print the last 3 rows,
Create a series with 6 country’s and its capital’s as index. and do the
following operation.
37.
ACCESSING ROWS USINGHEAD () AND TAIL() FUNCTION
To print only the first 3 rows,
>>> a.head(3)
To print the last 5 rows,
>>>a.tail()
To print the last 3 rows,
>>>a.tail(3)
Create a series with 6 country’s and its capital’s. and do the following
operation.
38.
Vector operations inSeries
• Series support vector operations.
• Any operation gets performed on every single element.
Eg:-
import pandas as pd
List = [5, 2, 3,7]
s1= pd.Series (List)
Guess the output of these statements:
print (list *2)
print (s1*2)
39.
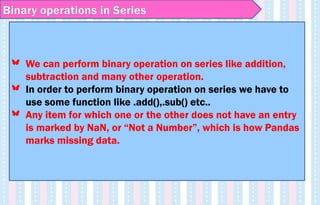
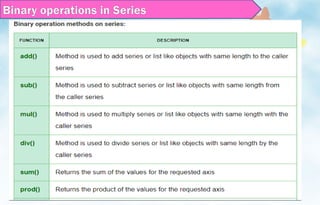
Binary operations inSeries
We can perform binary operation on series like addition,
subtraction and many other operation.
In order to perform binary operation on series we have to
use some function like .add(),.sub() etc..
Any item for which one or the other does not have an entry
is marked by NaN, or “Not a Number”, which is how Pandas
marks missing data.
40.
Binary operations inSeries
>>> import numpy as np
>>> s = pd.Series([1,2,3,4,np.NaN,5,np.NaN])
>>> s
0 1.0
1 2.0
2 3.0
3 4.0
4 NaN
5 5.0
6 NaN
dtype: float64
41.
Write a Pandasprogram to add, subtract, multiply and divide
two Pandas Series.
Program
import pandas as pd
ds1 = pd.Series([2, 4, 6, 8, 10])
ds2 = pd.Series([1, 3, 5, 7, 9])
ds = ds1 + ds2
print(“Sum of Series: n “ , ds)
ds = ds1 - ds2
print(“Subtraction of Series: n “ , ds)
ds = ds1 * ds2
print(“Product of two Series: n “, ds)
ds = ds1 / ds2
print(“Quotient of the Series: n “ , ds)
# importing pandasmodule
import pandas as pd
# creating a series
data = pd.Series([5, 2, 3,7], index=['a', 'b', 'c', 'd'])
# creating a series
data1 = pd.Series([1, 6, 4, 9], index=['a', 'b', 'd', 'e’])
# add two series using .add() function.
data.add(data1)
Program
44.
Write a Pandasprogram to compare the elements of the two
Pandas Series.
Program
import pandas as pd
ds1 = pd.Series([2, 4, 6, 8, 10])
ds2 = pd.Series([1, 3, 5, 7, 10])
print("Compare the elements of the said Series:")
print("Equals:")
print(ds1 == ds2)
print("Greater than:")
print(ds1 > ds2)
print("Less than:")
print(ds1 < ds2)
45.
Program – Tosort values
abc=pd.Series(['M','A','N','G','O','E','S'],index=[10,20,30,
40,50,60,70])
abc.sort_values()
abc.sort_index()
>>> abc
20 A
60 E
40 G
10 M
30 N
50 O
70 S
dtype: object
46.
Create series fromndarray
An array of values can be passed to a Series.
If data is an ndarray, index must be the same
length as data.
If no index is passed, one will be created having
values [0, ..., len(data) - 1].
47.
Create series fromndarray
import pandas as pd
import numpy as np
data = np.array(['a','b','c','d'])
s = pd.Series(data)
print (s)
Its output is as follows −
0 a
1 b
2 c
3 d
dtype: object
Note- We did not pass any index, so by default, it assigned the indexes ranging
from 0 to len(data)-1, i.e., 0 to 3.
48.
Create series fromndarray
import pandas as pd
import numpy as np
abc = np.array(['a','b','c','d'])
s = pd.Series(abc , index=[100,101,102,103])
print (s)
Its output is as follows −
100 a
101 b
102 c
103 d
dtype: object
We passed the index values here. Now we can see the customized indexed
values in the output.
49.
# To add5 marks to each student in the series
#creating a series from array and specified index
import pandas as pd
import numpy as np
Marks=np.array([455,478,477,405])
M1=pd.Series(Marks, index=[“Annie", “Resmi", "Sana", “Haya"])
print(M1)
for i, j in M1.items( ): # i – index , j - values
M1.at[i] = j+5 #increase each values
print (M1)
#at - Access a single value for a row/column label pair.
Program – Mathematical operations
50.
import pandas aspd
import numpy as np
a=np.random.randn(5)
>>> a
array([-0.63206378, -0.19692941, 0.3883878 , 0.35998536, 0.1873882 ])
>>> b=pandas.Series(a)
>>> b
0 -0.632064
1 -0.196929
2 0.388388
3 0.359985
4 0.187388
dtype: float64
numpy.random.randn()
Returns an array of defined shape, filled with random floating-point
samples.
Program – random.randn
51.
• A dictionarycan be passed as input to a Series.
• Dictionary keys are used to construct index.
d = {‘a': 1, ‘b': 0, 'c': 2}
a=pd.Series(d)
print(a)
Output-
a 1
b 0
c 2
dtype: int64
Create a Series from dictionary
52.
>>> d1 ={'a': 100, 'b': 200, 'c':300, 'd':400, 'e':800}
>>> d2=pd.Series(d1)
>>> d2
a 100
b 200
c 300
d 400
e 800
dtype: int64
Create a Series from dictionary
53.
>>> d3=pd.Series(d1,index=[20,30,40,50,60])
>>> d3
20NaN
30 NaN
40 NaN
50 NaN
60 NaN
dtype: float64
>>> d4=pd.Series(d1,index=['b','a','c','e','d'])
>>> d4
b 200
a 100
c 300
e 800
d 400
dtype: int64
Create a Series from dictionary
54.
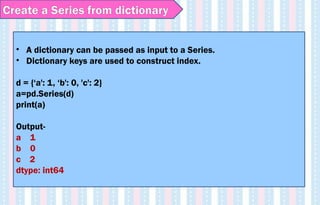
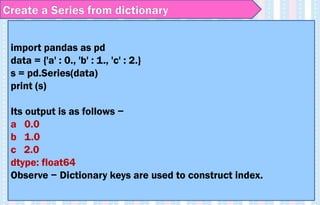
import pandas aspd
data = {'a' : 0., 'b' : 1., 'c' : 2.}
s = pd.Series(data)
print (s)
Its output is as follows −
a 0.0
b 1.0
c 2.0
dtype: float64
Observe − Dictionary keys are used to construct index.
Create a Series from dictionary
55.
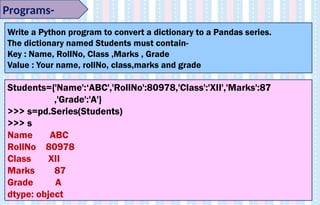
Programs-
Write a Pythonprogram to convert a dictionary to a Pandas series.
The dictionary named Students must contain-
Key : Name, RollNo, Class ,Marks , Grade
Value : Your name, rollNo, class,marks and grade
Students={'Name':‘ABC','RollNo':80978,'Class':'XII','Marks':87
,'Grade':'A'}
>>> s=pd.Series(Students)
>>> s
Name ABC
RollNo 80978
Class XII
Marks 87
Grade A
dtype: object
56.
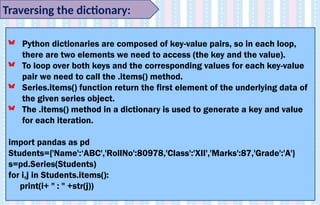
Traversing the dictionary:
Pythondictionaries are composed of key-value pairs, so in each loop,
there are two elements we need to access (the key and the value).
To loop over both keys and the corresponding values for each key-value
pair we need to call the .items() method.
Series.items() function return the first element of the underlying data of
the given series object.
The .items() method in a dictionary is used to generate a key and value
for each iteration.
import pandas as pd
Students={'Name':‘ABC','RollNo':80978,'Class':'XII','Marks':87,'Grade':'A'}
s=pd.Series(Students)
for i,j in Students.items():
print(i+ " : " +str(j))
57.
>>> pers ={'color': 'blue', 'fruit': 'apple', 'pet': 'dog'}
>>> p = pers.items()
>>> p # Here d_items is a view of items
dict_items([('color', 'blue'), ('fruit', 'apple'), ('pet', 'dog')])
>>> for item in pers.items():
print(item)
('color', 'blue')
('fruit', 'apple')
('pet', 'dog')
Traversing a dictionary
58.
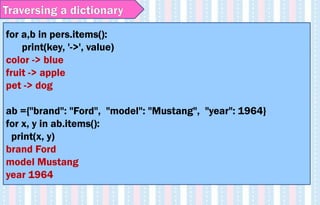
for a,b inpers.items():
print(key, '->', value)
color -> blue
fruit -> apple
pet -> dog
ab ={"brand": "Ford", "model": "Mustang", "year": 1964}
for x, y in ab.items():
print(x, y)
brand Ford
model Mustang
year 1964
Traversing a dictionary
59.
Eg. Consider theseries created with names of students as index
and Marks as data using dictionary
import pandas as pd
d1={"Raj":234,"Gilbert":345}
m1=pd.Series(d1)
print(m1)
for i,j in m1.items():
m1.at[ i ]=j+5
print(m1)
Mathematical operations on Series
60.
When a scalaris passed, all the elements of the series is
initialized to the same value.
The value will be repeated to match the length of index.
import pandas as pd
s = pd.Series(5, index=[0, 1, 2, 3])
s
Its output is as follows −
0 5
1 5
2 5
3 5
dtype: int64
Create a Series from Scalar
61.
Create a serieswith scalar value 7 and index as ‘A’,’B’,’C’,’D’
s = pd.Series(7, index=['A','B','C','D'])
>>> s
A 7
B 7
C 7
D 7
dtype: int64
Create a Series from Scalar
62.
Create a Seriesusing string as index
ab = pd.Series(‘Welcome to India’, index=['A','B','C','D'])
>>> s
A Welcome to India
B Welcome to India
C Welcome to India
D Welcome to India
dtype: object
63.
Accessing Elements ofa Series
(A)Indexing
Indexes are of two types: positional index and labelled
index. Positional index takes an integer value that
corresponds to its position in the series starting from 0,
whereas labelled index takes any user-defined label as
index
64.
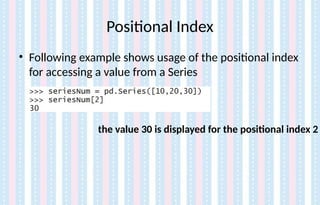
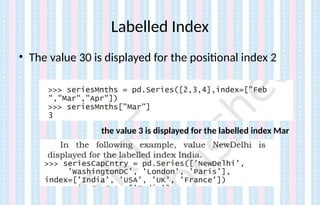
Positional Index
• Followingexample shows usage of the positional index
for accessing a value from a Series
the value 30 is displayed for the positional index 2
65.
• More thanone element of a series can be accessed using a
list of positional integers or a list of index labels as shown in
the following examples:
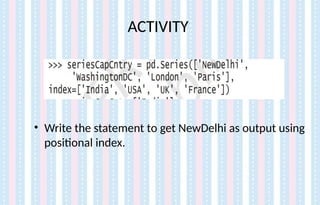
>>> seriesCapCntry = pd.Series(['NewDelhi', 'WashingtonDC',
'London', 'Paris'], index=['India', 'USA', 'UK', 'France'])
>>> seriesCapCntry[[3,2]]
France Paris
UK London
dtype: object
Indexing and slicingin Series
• In a series we can access any position values based on the
index number.
• Slicing is used to retrieve subsets of data by position.
• A slice object is built using a syntax of start:end:step, the
segments representing the first item, last item, and the
increment between each item that you would like as the step.
70.
Accessing Data fromSeries with indexing and slicing
import pandas aspd1
s = pd1.Series([1,2,3,4,5],index = ['a','b','c','d','e'])
>>> s[0]
1
>>> s[:3]
a 1
b 2
c 3
dtype: int64
>>> s[-3:]
c 3
d 4
e 5
dtype: int64
71.
>>> fruits =['apples', 'oranges', 'cherries', 'pears']
>>> S = pd.Series([20, 33, 52, 10], index=fruits)
>>> S
apples 20
oranges 33
cherries 52
pears 10
dtype: int64
>>> S['apples']
20
>>> S[0]
20
Accessing Data from Series with indexing and slicing
72.
Find out thefollowing-
AB
AB[2:4]
AB[1:6:2]
AB[ :6]
AB[4:]
AB[:4:2]
AB[4::2]
AB[::-1]
>>> num=[000,100,200,300,400,500,600,700,800,900]
>>> idx=['A','B','C','D','E','F','G','H','I','J']
>>> AB=pd.Series(num,index=idx)
Accessing Data from Series with indexing and slicing
73.
Find out thefollowing-
AB
AB[2:4]
AB[1:6:2]
AB[ :6]
AB[4:]
AB[:4:2] 0:4:2-- 000 200
AB[4::2] 400 600 800
AB[::-1]
>>> num=[000,100,200,300,400,500,600,700,800,900]
>>> idx=['A','B','C','D','E','F','G','H','I','J']
>>> AB=pd.Series(num,index=idx)
Accessing Data from Series with indexing and slicing
74.
Create a seriesusing 2 different lists
>>> import pandas as pd
>>> m=['jan','feb']
>>> n=[23,34]
>>> s=pd.Series(m,index=n)
>>> s
23 jan
34 feb
dtype: object
75.
Printing the sliceswith the values of the label index
>>> M = pd.Series([400,500,345,450],index=['Amit','Raj','Kris','Shon'])
>>> M
Amit 400
Raj 500
Kris 345
Shon 450
dtype: int64
>>> M['Kris']
345
M[['Raj','Kris','Shon']]
Raj 500
Kris 345
Shon 450
dtype: int64
M['Raj':'Shon']
Raj 500
Kris 345
Shon 450
dtype: int64
76.
Displaying the datausing Boolean indexing
# Eg. To select marks more than 400
>>> M = pd.Series([400,500,345,450],index=['Amit','Raj','Kris','Shon'])
>>> M
Amit 400
Raj 500
Kris 345
Shon 450
dtype: int64
>>> M>400
Amit False
Raj True
Kris False
Shon True
dtype: bool
>>> M[M>400] #Will display the names of students who got marks >400
Raj 500
Shon 450
dtype: int64
77.
Using range() tospecify index in series
>>> S=pd.Series(5,index=range(4))
>>> S
0 5
1 5
2 5
3 5
dtype: int64
>>> S=pd.Series([1,2,3,4],index=range(4))
>>> S
0 1
1 2
2 3
3 4
dtype: int64
78.
Using range() tospecify index in series –for loop
>>> S=pd.Series(range(1,15,3),index=[x for i in ‘abcde’])
>>> S
a 1
b 4
c 7
d 10
e 13
dtype: int64
>>> S=pd.Series([1,2,3,4.0],index=range(4))
>>> S
0 1.0
1 2.0
2 3.0
3 4.0
dtype: float64
79.
NaN - Creatinga series using missing values
In certain situations, we need to create a series object for which size is defined but
some element or datas are missing. This is handled by defining NaN(Not a Number )
values, which is an attribute of Numpy library.
This can be achieved by defining a missing value using np.Nan
80.
NaN - Creatinga series using missing values
Import pandas as pd
Import numpy as np
data = pd.Series([1, np.nan, 2, None, 3],
index= ('abcde'))
>>> data
a 1.0
b NaN
c 2.0
d NaN
e 3.0
dtype: float64
>>> d3=pd.Series(d1,index=[20,30,40,50,60])
>>> d3
20 NaN
30 NaN
40 NaN
50 NaN
60 NaN
dtype: float64
>>> s = pd.Series(np.nan, index=[49,3, 4, 5])
>>> s
49 NaN
3 NaN
4 NaN
5 NaN
dtype: float64
81.
Program
Write a pythonprogram to create a series of odd numbers.
odd=pd.Series(range(1, 10, 2))
>>> odd
0 1
1 3
2 5
3 7
4 9
dtype: int64
82.
Program
Create a serieswith names of any 7 colours :
• Display the first element
• Display the third element
• Display the first 3 elements (Using Slicing)
• Display the element starting from 2nd till 3rd (Using
Slicing)
• Display last 2 elements (Using Slicing)
83.
CREATING SERIES WITHRANGE AND FOR LOOP
>>> S=pd.Series(range(1,15,3),index=[x for x in 'abcde'])
>>> S
a 1
b 4
c 7
d 10
e 13
dtype: int64
84.
Handling floating pointvalues to generate a series
import pandas as pd
ab=pd.Series([2,4,6,7.5])
ab
0 2.0
1 4.0
2 6.0
3 7.5
Dtype : float64
Since 7.5 is a float value, it will convert the rest of the integer
values to float and so it be overall a float series.
85.
Indexing and accessingcan also be done using iloc and loc.
iloc- It is used for indexing or selecting based on position ie..
By row number and column number. It refers to position
based indexing.
Syntax is-
iloc=[<row number range>,<col number range>]
loc – It is used to index or select based on name ie.. By row
name and col name. It refers to name based indexing.
Syntax is-
loc=[<list of row name>,<list of col name>]
So, we can filter the data using the loc function in Pandas even
if the indices are not an integer in our dataset.
Note- By default, index is assigned from 0 to len-1.
iloc and loc
86.
import pandas aspd
a=pd.Series([1,2,3,4,5], index=‘a’,’b’,’c’,’d’,’e’])
>>> a.iloc[1:4] # Displays data using index
b 2
c 3
d 4
dtype: int64
>>> a.loc['b':'e'] # Displays data location wise
b 2
c 3
d 4
e 5
dtype: int64
loc and iloc
87.
>>> s =pd.Series(np.nan, index=[49,48,47,46,45, 1, 2, 3, 4, 5])
>>> s.iloc[:3] # slice the first three rows
49 NaN
48 NaN
47 NaN
>>> s.loc[:3] # slice up to and including label 3
49 NaN
48 NaN
47 NaN
46 NaN
45 NaN
1 NaN
2 NaN
3 NaN
loc and iloc
88.
loc vs. ilocin Pandas
loc
• Purely label-location based indexer for selection by label.
• It is primarily label based, but may also be used with a
boolean array.
• Allowed inputs are:
A single label, e.g. 5 or 'a'.
A list or array of labels, e.g. ['a', 'b', 'c'].
A slice object with labels, e.g. 'a':'f' (note that contrary to usual
python slices, both the start and the stop are included!).
A boolean array.
A callable function with one argument (the calling Series,
DataFrame ) and that returns valid output for indexing (one of
the above)
• Note : .loc will raise a KeyError when the items are not
found
89.
iloc-
• .iloc isprimarily integer position based (from 0 to length-
1 of the axis), but may also be used with a boolean array.
• .iloc will raise IndexError if a requested indexer is out-of-
bounds, except slice indexers which allow out-of-bounds
indexing.
• Allowed inputs are:
An integer e.g. 5
A list or array of integers [4, 3, 0]
A slice object with ints 1:7
A boolean array
A callable function with one argument
loc vs. iloc in Pandas
90.
It is atwo-dimensional data structure, just like any table (with
rows & columns).
Basic Features of DataFrame
Columns may be of different types
Size can be changed (Mutable)
Labelled axes (rows / columns)
Can perform arithmetic operations on rows and columns
CreateDataFrame
It can be created with the following-
Lists , dict , Series , Numpy arrays , Another DataFrame
Dataframes
91.
Structure of aDataframe
Pandas DataFrame consists of three principal components,
the data, rows, and columns.
You can think of it as an SQL table or a spreadsheet data representation.
92.
Dataframe Creation
Dataframes canbe created using constructor in pandas.
Syntax: pd.DataFrame( data, index, columns, dtype, copy)
Sr.No Parameter & Description
1 data - data takes various forms like ndarray, series, map, lists, dict,
constants and also another DataFrame.
2 index - For the row labels, the Index to be used for the resulting frame
is Optional Default np.arange(n) if no index is passed.
3 columns- For column labels, the optional default syntax is -
np.arange(n). This is only true if no index is passed.
4 dtype - Data type of each column.
5 copy - This command (or whatever it is) is used for copying of data, if
the default is False.
93.
Creating an emptyDataframe
A basic DataFrame, which can be created is an Empty Dataframe.
>>> import pandas as pd
>>> d=pd.DataFrame()
>>> d
Empty DataFrame
Columns: []
Index: []
94.
Series vs Dataframe
ASeries is essentially a column, and a DataFrame is a multi-dimensional
table made up of a collection of Series.
95.
Creating a Dataframefrom lists with values only
The DataFrame can be created using a single list or a list of lists.
CREATING A DATAFRAME FROM SINGLE LIST
Example1:
import pandas as pd
data = [1,2,3,4,5]
df = pd.DataFrame(data)
print (df)
96.
Creating a Dataframefrom lists of lists (multidimensional list)
CREATE A DATAFRAME FROM A LIST OF LISTS
import pandas as pd
data = [['Alex',10],['Bob',12],['Clarke',13]]
df = pd.DataFrame(data,columns=['Name','Age'])
print (df)
Name Age
0 Alex 10
1 Bob 12
2 Clarke 13
97.
Creating a Dataframefrom lists of lists (multidimensional list)
import pandas as pd
>>> a=[12,13,14,15]
>>> b=[20,30,40,50]
>>> c=pd.DataFrame(a,index=[b],columns=['Numbers'],dtype='float')
>>> c
Numbers
20 12.0
30 13.0
40 14.0
50 15.0
Creating a Dataframefrom lists of lists (multidimensional list)
Using multi-dimensional list with column name and dtype
specified.
import pandas as pd
lst = [['tom', 'reacher', 25], ['krish', 'pete', 30],
['nick', 'wilson', 26], ['juli', 'williams', 22]]
df = pd.DataFrame(lst, columns =['FName', 'LName', 'Age'],
dtype = float)
df
100.
Program
Display the followingdetails in a dataframe.
Name Marks Index
Vijaya 80 B1
Rahul 92 A2
Meghna 67 C
Radhika 95 A1
Shaurya 97 A1
df = pd.DataFrame(lst, columns =['FName', 'LName', 'Age'], dtype = float)



























![import pandas as pd
a=pd.Series([1,2,3,4,5], index=‘a’,’b’,’c’,’d’,’e’])
>>> a.iloc[1:4] # Displays data using index
b 2
c 3
d 4
dtype: int64
>>> a.loc['b':'e'] # Displays data location wise
b 2
c 3
d 4
e 5
dtype: int64
loc and iloc](https://image.slidesharecdn.com/ln-250918173733-5ea4f2ca/85/Ln-1-Data-Handling-using-Pandas-I-1-pptx-86-320.jpg)