Skip to main content More Related Content

PDF
Keppel Ltd. 2H24 and FY24 Presentation Slides.pdf 
PDF
Keppel AGM CEO Presentation Slides 17 April 2026 
PDF
Keppel Ltd. 9M 2025 Business Update Presentation Slides 
PDF
Keppel Ltd. 1H 2025 Results Presentation Slides 
PDF
Keppel 1H 2025 Financial Results: Growth, Asset Monetisation & Digitalisation 
PDF
Keppel 1H 2025 Financial Results: Growth, Asset Monetisation & Digital Transf... 
PDF
Keppel 1H 2025 Financial Results: Growth, Asset Monetisation & Digital Transf... 
PDF
Keppel Investor Day 2025 Presentation Slides GCAT.pdf Similar to Keppel Ltd 2H & FY25 Financial Results Presentation Slides

PDF
Keppel Ltd. 1Q 2026 Business Update Presentation Slides 
PDF
Keppel Ltd. 1Q 2025 Business Update Presentation Slides 
PDF
Keppel Investor Day 2024 Presentation Slides 
PDF
Keppel-Ltd-2h23-fy23-presentation-slides 
PDF
Keppel Ltd. AGM 2025 CEO Presentation Slides 
PDF
Keppel Ltd. 1H 2026 Results Presentation Slides 
PDF
Keppel Corporation 1H 2023 Financial Results Presentation 
PDF
Keppel Corporation non-deal roadshow slides 
PDF
SIAS-Keppel Briefing to Retail Shareholders 2023.pdf 
PDF
Keppel Ltd. 1Q 2024 Business Update Presentation Slides 
PDF
Keppel's Presentation Slides to Investors 
PDF
Keppel Ltd's Corporate Presentation 2026 
PDF
Keppel Corporation UK Non-deal Roadshow 2019 
PDF
Keppel 3Q & 9M 2023 Business Update Presentation Slides 
PDF
KCL_AR2016_Full_Report.pdf 
PDF
Presentation Slides for HSBC Global Investment Summit 
PDF
Annual General Meeting Presentation Slides 
PDF
Keppel Corporation 2H & FY2022 Results Presentation Slides 
PDF
2 keppel ltd 1h24 presentation slides.pdf 
PDF
Keppel Corporation 1Q23 Business Update More from KeppelCorporation

PDF
Keppel Investor Day 2026 - Presentation Slides 
PDF
Keppel_Proposed Divestment of M1 Limited 
PDF
keppel-ltd-3q-2024-business-update-presentation-slides.pdf 
PDF
Keppel Ltd. 3Q 2024 Business Update Presentation Slides 
PDF
Keppel Ltd. 1H24 Presentation Slides.pdf 
PDF
Presentation on proposed acquisition of leading European asset manager Aermon... 
PDF
Keppel Corporation - Briefing to media and analysts on accelerating transform... 
PDF
Keppel Corporation AGM 2023 Presentation Slides Recently uploaded

DOCX
How to Buy a Verified Facebook Business Manager Safely.docx 
PDF
Top 11 Things Beginners Should Know About Buy Verified Robinhood Accounts 
PPTX
AIF Subsidy Funding: Agriculture Infrastructure Fund, Eligibility, Loan & Int... 
DOCX
Buy USA Facebook Accounts_ Rules, Risks, and Alternatives 2026-27. 
PDF
Top 11 Buy Verified Robinhood Accounts Considerations for New Users 
PDF
Buy Telegram Accounts Safely and Legally in 2026 
PDF

DOCX
5 Top Sites to Buy Google Ads Accounts for the New Year.docx 
PDF
Daniel E. Kaplan - An Ethical Finance Luminary 
DOCX
Buying a Verified Facebook Business Manager_ Benefits & Tips.docx 
PDF
Tantra Nectar Academy - Moscow Presentation 
PDF
12 Recommended Places to Buy Verified Shopify Accounts for Businesses.pdf 
PDF
Best Trusted Places to Buy Verified Shopify Accounts Online 
DOCX
Top 14 Sites to Buy Verified Stake Accounts with Buyer Tips 
PDF
The $20 million Tiny Company - Growth Hacking Live 2026 Keynote 
PPTX
Two-Way SMS | Respond in Real Time with Dialinger 
DOCX
Key Factors When Choosing Buy Verified Stripe Accounts 2026. 
PDF
How Buy Verified Robinhood Accounts Relate to Privacy and Security 
DOCX
Best Strategies for Growing Your Audience on Buy Snapchat Accounts. 
DOCX
Reliable Buy Outlook Email Account Solutions 2026-27 Keppel Ltd 2H & FY25 Financial Results Presentation Slides
- 1.
2H & FY2025
Financial Results
5 February 2026
- 2.
- 3.
- 4.
Highlights of 2025
4
iExcluding Non-Core Portfolio for Divestment and Discontinued Operations.
ii Gross asset value of investments and uninvested capital commitments on a leveraged basis is used to project fully-invested FUM.
iii This includes the $4.7b Keppel O&M divestment in 2023, including the Sembcorp Marine (now Seatrium) shares, which were distributed or held in the segregated account, at $2.30 per share
(or $0.115 per share prior to the share consolidation undertaken by Seatrium in 2023; $0.115 was the last traded price of the shares on the first market day immediately following the date of the
combination) and the $0.5b cash component.
© Keppel
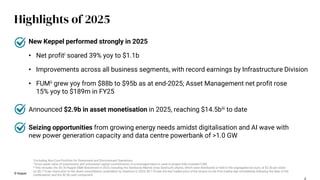
New Keppel performed strongly in 2025
• Net profiti soared 39% yoy to $1.1b
• Improvements across all business segments, with record earnings by Infrastructure Division
• FUMii grew yoy from $88b to $95b as at end-2025; Asset Management net profit rose
15% yoy to $189m in FY25
Announced $2.9b in asset monetisation in 2025, reaching $14.5biii to date
Seizing opportunities from growing energy needs amidst digitalisation and AI wave with
new power generation capacity and data centre powerbank of >1.0 GW
- 5.
678
803
107
273
149
175
(141) (151)
FY24 FY25
InfrastructureReal Estate
Connnectivity Corp activities
$793m
$1,100m
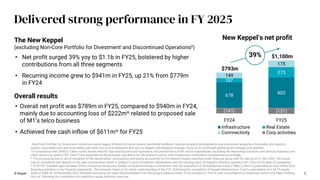
• Net profit surged 39% yoy to $1.1b in FY25, bolstered by higher
contributions from all three segments
• Recurring income grew to $941m in FY25, up 21% from $779m
in FY24
© Keppel 5
39%
The New Keppel
(excluding Non-Core Portfolio for Divestmenti and Discontinued Operationsii)
Delivered strong performance in FY 2025
New Keppel’s net profit
• Overall net profit was $789m in FY25, compared to $940m in FY24,
mainly due to accounting loss of $222miii related to proposed sale
of M1’s telco business
• Achieved free cash inflow of $611miv for FY25
Overall results
i Non-Core Portfolio for Divestment comprises mainly legacy offshore & marine assets, residential landbank, selected property developments and investment properties, hospitality and logistics
assets, associated cash and receivables, and other non-core investments that are not aligned with Keppel’s strategic focus as an asset-light global asset manager and operator.
ii In accordance with SFRS(I) 5 Non-current Assets Held for Sale and Discontinued Operations, the performance of M1 and its subsidiaries, excluding the technology solutions and services business and
other carved out assets (“M1 Telco”) are presented as discontinued operations for the financial period, with comparative information re-presented accordingly.
iii The accounting loss is net of cessation of the depreciation, amortisation and equity accounting for the relevant assets classified under disposal group held for sale as at 31 Dec 2025. The actual
loss at completion will depend on the sale consideration which is subject to post-Completion adjustments and the carrying value of Keppel’s effective interest in M1 Telco at the date of completion.
iv FY25 FCF includes approximately $235m financing component funded via bank borrowing in connection with the acquisition of Global Marine Group (“GMG”), which is presented as cash inflow from
financing activities in the financial statements. The inclusion herein is for better understanding of the FCF. Following the completion of Keppel Infrastructure Trust’s subscription of a 46.7% equity
stake in GMG on 25 November 2025, the bank borrowing has been deconsolidated from the Group’s balance sheet. FY24 includes $1.07b of cash consolidated on obtaining control over Rigco Holding
Pte Ltd. following the completion of a selective capital reduction exercise.
- 6.
© Keppel 6
Robustreturns
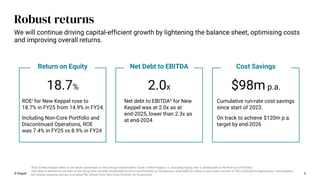
18.7%
Return on Equity
ROEi for New Keppel rose to
18.7% in FY25 from 14.9% in FY24.
Including Non-Core Portfolio and
Discontinued Operations, ROE
was 7.4% in FY25 vs 8.9% in FY24
2.0x
Net Debt to EBITDA
Net debt to EBITDAii for New
Keppel was at 2.0x as at
end-2025, lower than 2.3x as
at end-2024
i ROE of New Keppel refers to the return generated on the average shareholders’ funds of New Keppel, i.e. excluding equity that is attributable to the Non-Core Portfolio.
ii Net debt is defined as net debt of the Group less net debt attributable to Non-Core Portfolio for Divestment, while EBITDA refers to last twelve months (LTM) profit before depreciation, amortisation,
net interest expense and tax, excluding P&L effects from Non-Core Portfolio for Divestment.
We will continue driving capital-efficient growth by lightening the balance sheet, optimising costs
and improving overall returns.
$98m p.a.
Cost Savings
Cumulative run-rate cost savings
since start of 2023.
On track to achieve $120m p.a.
target by end-2026
- 7.
Advancing asset-light strategy
©Keppel 7
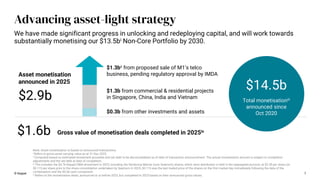
$1.3bii from proposed sale of M1’s telco
business, pending regulatory approval by IMDA
$1.6b
Note: Asset monetisation is based on announced transactions.
i Refers to gross asset carrying value as at 31 Dec 2025.
ii Computed based on estimated divestment proceeds and net debt to be deconsolidated as of date of transaction announcement. The actual monetisation amount is subject to completion
adjustments and the net debt at date of completion.
iii This includes the $4.7b Keppel O&M divestment in 2023, including the Sembcorp Marine (now Seatrium) shares, which were distributed or held in the segregated account, at $2.30 per share (or
$0.115 per share prior to the share consolidation undertaken by Seatrium in 2023; $0.115 was the last traded price of the shares on the first market day immediately following the date of the
combination) and the $0.5b cash component.
iv Refers to the monetisation deals, announced in or before 2025, but completed in 2025 based on their announced gross values.
Gross value of monetisation deals completed in 2025iv
Total monetisationiii
announced since
Oct 2020
$14.5b
We have made significant progress in unlocking and redeploying capital, and will work towards
substantially monetising our $13.5bi Non-Core Portfolio by 2030.
$1.3b from commercial & residential projects
in Singapore, China, India and Vietnam
$0.3b from other investments and assets
Asset monetisation
announced in 2025
$2.9b
- 8.
will be usedto reward shareholders.
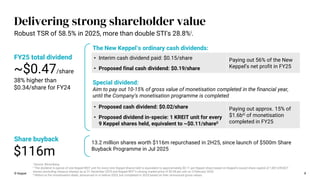
Delivering strong shareholder value
© Keppel 8
i Source: Bloomberg
ii The dividend in-specie of one Keppel REIT unit for every nine Keppel shares held is equivalent to approximately $0.11 per Keppel share based on Keppel’s issued share capital of 1,801,659,827
shares (excluding treasury shares) as at 31 December 2025 and Keppel REIT’s closing market price of $0.98 per unit on 3 February 2026.
iii Refers to the monetisation deals, announced in or before 2025, but completed in 2025 based on their announced gross values.
~$0.47/share
38% higher than
$0.34/share for FY24
Robust TSR of 58.5% in 2025, more than double STI’s 28.8%i.
FY25 total dividend • Interim cash dividend paid: $0.15/share
• Proposed final cash dividend: $0.19/share
Paying out 56% of the New
Keppel’s net profit in FY25
13.2 million shares worth $116m repurchased in 2H25, since launch of $500m Share
Buyback Programme in Jul 2025
$116m
Share buyback
The New Keppel’s ordinary cash dividends:
Special dividend:
Aim to pay out 10-15% of gross value of monetisation completed in the financial year,
until the Company’s monetisation programme is completed
• Proposed cash dividend: $0.02/share
• Proposed dividend in-specie: 1 KREIT unit for every
9 Keppel shares held, equivalent to ~$0.11/shareii
Paying out approx. 15% of
$1.6biii of monetisation
completed in FY25
- 9.
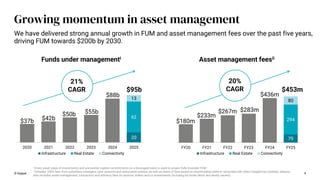
Growing momentum inasset management
© Keppel 9
i Gross asset value of investments and uninvested capital commitments on a leveraged basis is used to project fully-invested FUM.
ii Includes 100% fees from subsidiary managers, joint ventures and associated entities, as well as share of fees based on shareholding stake in associate with which Keppel has strategic alliance.
Also includes asset management, transaction and advisory fees on sponsor stakes and co-investments (including for funds which are wholly owned).
We have delivered strong annual growth in FUM and asset management fees over the past five years,
driving FUM towards $200b by 2030.
Asset management feesii
Funds under managementi
21%
CAGR
20
62
13
2020 2021 2022 2023 2024 2025
Infrastructure Real Estate Connectivity
$88b
$50b
$42b
$55b
$37b
$95b
79
294
80
FY20 FY21 FY22 FY23 FY24 FY25
Infrastructure Real Estate Connectivity
$436m
$283m
$267m
$233m
$180m
$453m
20%
CAGR
- 10.
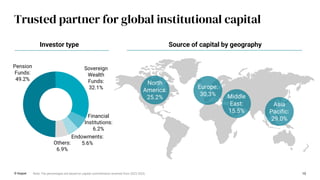
Trusted partner forglobal institutional capital
10
Source of capital by geography
Investor type
© Keppel Note: The percentages are based on capital commitments received from 2023-2025.
Pension
Funds:
49.2%
Sovereign
Wealth
Funds:
32.1%
Financial
Institutions:
6.2%
Endowments:
5.6%
Others:
6.9%
North
America:
25.2%
Asia
Pacific:
29.0%
Europe:
30.3% Middle
East:
15.5%
- 11.
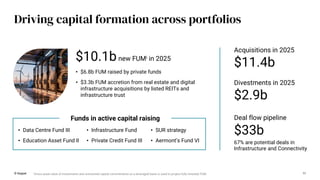
Driving capital formationacross portfolios
© Keppel 11
• $6.8b FUM raised by private funds
• $3.3b FUM accretion from real estate and digital
infrastructure acquisitions by listed REITs and
infrastructure trust
$10.1bnew FUMi in 2025
• Data Centre Fund III
• Education Asset Fund II
$11.4b
Acquisitions in 2025
$33b
• SUR strategy
• Aermont’s Fund VI
Deal flow pipeline
$2.9b
Divestments in 2025
Funds in active capital raising
• Infrastructure Fund
• Private Credit Fund III 67% are potential deals in
Infrastructure and Connectivity
i Gross asset value of investments and uninvested capital commitments on a leveraged basis is used to project fully-invested FUM.
- 12.
© Keppel 12
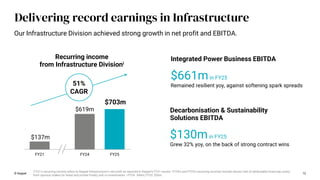
Deliveringrecord earnings in Infrastructure
Our Infrastructure Division achieved strong growth in net profit and EBITDA.
Recurring income
from Infrastructure Divisioni
Integrated Power Business EBITDA
$661min FY25
Remained resilient yoy, against softening spark spreads
Decarbonisation & Sustainability
Solutions EBITDA
$130min FY25
Grew 32% yoy, on the back of strong contract wins
51%
CAGR
i FY21's recurring income refers to Keppel Infrastructure’s net profit as reported in Keppel’s FY21 results. FY24’s and FY25’s recurring incomes include returns (net of attributable financing costs)
from sponsor stakes (in listed and private funds) and co-investments –FY24: -$44m; FY25: $53m.
FY21 FY24 FY25
$619m
$137m
$703m
i
- 13.
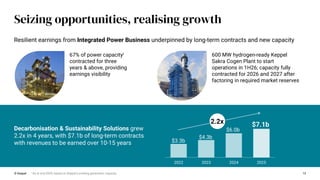
Seizing opportunities, realisinggrowth
© Keppel 13
Decarbonisation & Sustainability Solutions grew
2.2x in 4 years, with $7.1b of long-term contracts
with revenues to be earned over 10-15 years
600 MW hydrogen-ready Keppel
Sakra Cogen Plant to start
operations in 1H26; capacity fully
contracted for 2026 and 2027 after
factoring in required market reserves
Resilient earnings from Integrated Power Business underpinned by long-term contracts and new capacity
2022 2023 2024 2025
$6.0b
$4.3b
$3.3b
$7.1b
2.2x
67% of power capacityi
contracted for three
years & above, providing
earnings visibility
i As at end-2025; based on Keppel’s existing generation capacity.
- 14.
© Keppel 14
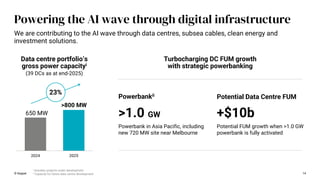
Poweringthe AI wave through digital infrastructure
We are contributing to the AI wave through data centres, subsea cables, clean energy and
investment solutions.
Powerbank in Asia Pacific, including
new 720 MW site near Melbourne
>1.0 GW
Turbocharging DC FUM growth
with strategic powerbanking
Potential FUM growth when >1.0 GW
powerbank is fully activated
+$10b
2024 2025
650 MW
>800 MW
23%
Data centre portfolio’s
gross power capacityi
(39 DCs as at end-2025)
i Includes projects under development
ii Capacity for future data centre development
Powerbankii
Potential Data Centre FUM
- 15.
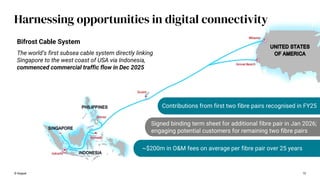
Harnessing opportunities indigital connectivity
© Keppel 15
The world’s first subsea cable system directly linking
Singapore to the west coast of USA via Indonesia,
commenced commercial traffic flow in Dec 2025
Bifrost Cable System
Contributions from first two fibre pairs recognised in FY25
Signed binding term sheet for additional fibre pair in Jan 2026;
engaging potential customers for remaining two fibre pairs
~$200m in O&M fees on average per fibre pair over 25 years
- 16.
© Keppel 16
Conclusion
•New Keppel delivered strong performance in FY25, underpinned by solid earnings
growth and continued momentum in asset monetisation
• The market increasingly recognises Keppel as a global asset manager & operator
and has continued re-rating the Company as we execute our growth strategy
• Strong confidence in New Keppel’s growth trajectory and committed to delivering
strong returns to our LPs and shareholders
• Rewarding shareholders: Ordinary dividends based on the New Keppel’s performance
and special dividends based on 10-15% of asset monetisation completed in the
financial year, until monetisation programme is completed
- 17.
- 18.
18
Overview of FY25results
© Keppel
I FY25 FCF includes approximately $235m financing component funded via bank borrowing in connection with the acquisition of Global Marine Group (“GMG”), which is presented as cash inflow
from financing activities in the financial statements. The inclusion herein is for better understanding of the FCF. Following the completion of Keppel Infrastructure Trust’s subscription of a 46.7%
equity stake in GMG on 25 November 2025, the bank borrowing has been deconsolidated from the Group’s balance sheet. FY24 includes $1.07b of cash consolidated on obtaining control over
Rigco Holding Pte Ltd. following the completion of a selective capital reduction exercise.
ii Non-Core Portfolio comprises mainly legacy offshore & marine assets, residential landbank, selected property developments and investment properties, hospitality and logistics assets,
associated cash and receivables, and other non-core investments that are not aligned with Keppel’s strategic focus as an asset-light global asset manager and operator.
iii In accordance with SFRS(I) 5 Non-current Assets Held for Sale and Discontinued Operations, the performance of M1 and its subsidiaries, excluding the technology solutions and services business
and other carved out assets (“M1 Telco”), are presented as discontinued operations for the financial period, with comparative information re-presented accordingly.
793
1,100
(6) (84)
153
(227)
FY24 FY25
$940m $789m
ii
iii
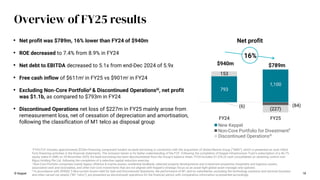
• Net profit was $789m, 16% lower than FY24 of $940m
• ROE decreased to 7.4% from 8.9% in FY24
• Net debt to EBITDA decreased to 5.1x from end-Dec 2024 of 5.9x
• Free cash inflow of $611mi in FY25 vs $901mi in FY24
• Excluding Non-Core Portfolioii & Discontinued Operationsiii, net profit
was $1.1b, as compared to $793m in FY24
• Discontinued Operations net loss of $227m in FY25 mainly arose from
remeasurement loss, net of cessation of depreciation and amortisation,
following the classification of M1 telco as disposal group
Non-Core Portfolio for Divestment
Discontinued Operations
New Keppel
16%
Net profit
- 19.
Overview of FY25results
(excluding Non-Core Portfolio for Divestmenti & Discontinued Operationsii)
© Keppel 19
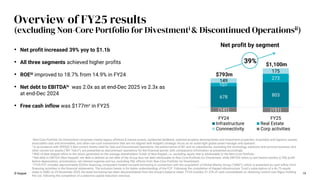
• Net profit increased 39% yoy to $1.1b
• All three segments achieved higher profits
• ROEiii improved to 18.7% from 14.9% in FY24
• Net debt to EBITDAiv was 2.0x as at end-Dec 2025 vs 2.3x as
at end-Dec 2024
• Free cash inflow was $177mv in FY25
i Non-Core Portfolio for Divestment comprises mainly legacy offshore & marine assets, residential landbank, selected property developments and investment properties, hospitality and logistics assets,
associated cash and receivables, and other non-core investments that are not aligned with Keppel’s strategic focus as an asset-light global asset manager and operator.
ii In accordance with SFRS(I) 5 Non-current Assets Held for Sale and Discontinued Operations, the performance of M1 and its subsidiaries, excluding the technology solutions and services business and
other carved out assets (“M1 Telco”), are presented as discontinued operations for the financial period, with comparative information re-presented accordingly.
iii ROE of New Keppel refers to the return generated on the average shareholders’ funds of New Keppel, i.e. excluding equity that is attributable to the Non-Core Portfolio.
iv Net debt to EBITDA (New Keppel): net debt is defined as net debt of the Group less net debt attributable to Non-Core Portfolio for Divestment, while EBITDA refers to last twelve months (LTM) profit
before depreciation, amortisation, net interest expense and tax, excluding P&L effects from Non-Core Portfolio for Divestment.
v FY25 FCF includes approximately $235m financing component funded via bank borrowing in connection with the acquisition of Global Marine Group (“GMG”), which is presented as cash inflow from
financing activities in the financial statements. The inclusion herein is for better understanding of the FCF. Following the completion of Keppel Infrastructure Trust’s subscription of a 46.7% equity
stake in GMG on 25 November 2025, the bank borrowing has been deconsolidated from the Group’s balance sheet. FY24 includes $1.07b of cash consolidated on obtaining control over Rigco Holding
Pte Ltd. following the completion of a selective capital reduction exercise.
678 803
107
273
149
175
(141) (151)
FY24 FY25
Infrastructure Real Estate
Connnectivity Corp activities
$793m
$1,100m
Net profit by segment
39%
- 20.
165 189
614 752
146
206
9
104
(141)(151)
FY24 FY25
Asset Mgmt Operating
Valuation Capital recycling
Corporate activities
$793m
$1,100m
($’m)
Asset
Management Operating Valuation Capital recycling Corporate activities Net profit
FY 2025 189 752 206 104 (151) 1,100
FY 2024 165 614 146 9 (141) 793
Variance 24 138 60 95 (10) 307
Horizontal reporting
(excluding Non-Core Portfolio for Divestmenti & Discontinued Operationsii)
© Keppel 20
Recurring income
i Non-Core Portfolio for Divestment comprises mainly legacy offshore & marine assets, residential landbank, selected property developments and investment properties, hospitality and logistics
assets, associated cash and receivables, and other non-core investments that are not aligned with Keppel’s strategic focus as an asset-light global asset manager and operator.
ii In accordance with SFRS(I) 5 Non-current Assets Held for Sale and Discontinued Operations, the performance of M1 and its subsidiaries, excluding the technology solutions and services and other
carved out assets (“M1 Telco”), are presented as discontinued operations for the financial period, with comparative information re-presented accordingly.
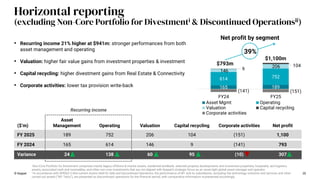
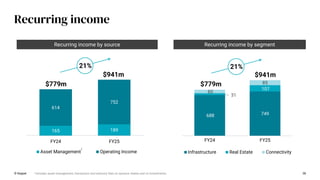
• Recurring income 21% higher at $941m: stronger performances from both
asset management and operating
• Valuation: higher fair value gains from investment properties & investment
• Capital recycling: higher divestment gains from Real Estate & Connectivity
• Corporate activities: lower tax provision write-back
39%
Net profit by segment
- 21.
© Keppel 21
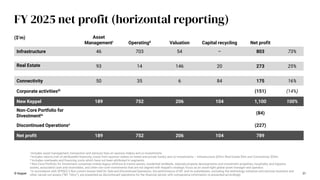
FY2025 net profit (horizontal reporting)
i Includes asset management, transaction and advisory fees on sponsor stakes and co-investments.
ii Includes returns (net of attributable financing costs) from sponsor stakes (in listed and private funds) and co-investments – Infrastructure $53m, Real Estate $9m and Connectivity $29m.
iii Includes overheads and financing costs which have not been attributed to segments.
iv Non-Core Portfolio for Divestment comprises mainly legacy offshore & marine assets, residential landbank, selected property developments and investment properties, hospitality and logistics
assets, associated cash and receivables, and other non-core investments that are not aligned with Keppel’s strategic focus as an asset-light global asset manager and operator.
v In accordance with SFRS(I) 5 Non-current Assets Held for Sale and Discontinued Operations, the performance of M1 and its subsidiaries, excluding the technology solutions and services business and
other carved out assets (“M1 Telco”), are presented as discontinued operations for the financial period, with comparative information re-presented accordingly.
($’m) Asset
Managementi Operatingii Valuation Capital recycling Net profit
Infrastructure 46 703 54 – 803 73%
Real Estate 93 14 146 20 273 25%
Connectivity 50 35 6 84 175 16%
Corporate activitiesiii (151) (14%)
New Keppel 189 752 206 104 1,100 100%
Non-Core Portfolio for
Divestmentiv (84)
Discontinued Operationsv (227)
Net profit 189 752 206 104 789
- 22.
22
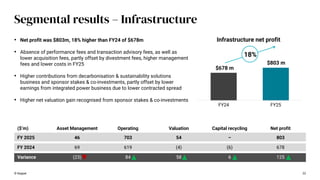
Segmental results –Infrastructure
© Keppel
($’m) Asset Management Operating Valuation Capital recycling Net profit
FY 2025 46 703 54 – 803
FY 2024 69 619 (4) (6) 678
Variance (23) 84 58 6 125
$678 m
$803 m
FY24 FY25
Infrastructure net profit
• Net profit was $803m, 18% higher than FY24 of $678m
• Absence of performance fees and transaction advisory fees, as well as
lower acquisition fees, partly offset by divestment fees, higher management
fees and lower costs in FY25
• Higher contributions from decarbonisation & sustainability solutions
business and sponsor stakes & co-investments, partly offset by lower
earnings from integrated power business due to lower contracted spread
• Higher net valuation gain recognised from sponsor stakes & co-investments
18%
- 23.
23
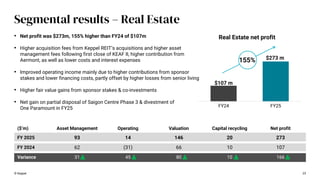
Segmental results –Real Estate
© Keppel
($’m) Asset Management Operating Valuation Capital recycling Net profit
FY 2025 93 14 146 20 273
FY 2024 62 (31) 66 10 107
Variance 31 45 80 10 166
$107 m
$273 m
FY24 FY25
Real Estate net profit
• Net profit was $273m, 155% higher than FY24 of $107m
• Higher acquisition fees from Keppel REIT’s acquisitions and higher asset
management fees following first close of KEAF II, higher contribution from
Aermont, as well as lower costs and interest expenses
• Improved operating income mainly due to higher contributions from sponsor
stakes and lower financing costs, partly offset by higher losses from senior living
• Higher fair value gains from sponsor stakes & co-investments
• Net gain on partial disposal of Saigon Centre Phase 3 & divestment of
One Paramount in FY25
155%
- 24.
24
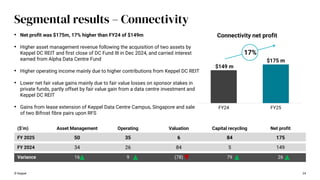
Segmental results –Connectivity
© Keppel
($’m) Asset Management Operating Valuation Capital recycling Net profit
FY 2025 50 35 6 84 175
FY 2024 34 26 84 5 149
Variance 16 9 (78) 79 26
$149 m
$175 m
FY24 FY25
Connectivity net profit
• Net profit was $175m, 17% higher than FY24 of $149m
• Higher asset management revenue following the acquisition of two assets by
Keppel DC REIT and first close of DC Fund III in Dec 2024, and carried interest
earned from Alpha Data Centre Fund
• Higher operating income mainly due to higher contributions from Keppel DC REIT
• Lower net fair value gains mainly due to fair value losses on sponsor stakes in
private funds, partly offset by fair value gain from a data centre investment and
Keppel DC REIT
• Gains from lease extension of Keppel Data Centre Campus, Singapore and sale
of two Bifrost fibre pairs upon RFS
17%
- 25.
(238)
(156)
197
119
35
(47)
FY24 FY25
Legacy O&Massets Property related assets
Investment & Others
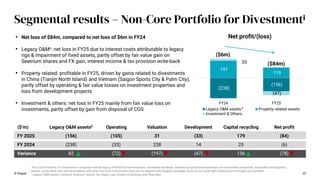
($’m) Legacy O&M assetsii Operating Valuation Development Capital recycling Net profit
FY 2025 (156) (105) 31 (33) 179 (84)
FY 2024 (238) (33) 228 14 23 (6)
Variance 82 (72) (197) (47) 156 (78)
© Keppel 25
Segmental results – Non-Core Portfolio for Divestmenti
ii
i Non-Core Portfolio for Divestment comprises mainly legacy offshore & marine assets, residential landbank, selected property developments and investment properties, hospitality and logistics
assets, associated cash and receivables, and other non-core investments that are not aligned with Keppel’s strategic focus as an asset-light global asset manager and operator.
ii Legacy O&M assets comprise Seatrium shares, the legacy rigs, Floatel, KrisEnergy and Dyna-Mac.
($6m)
($84m)
• Net loss of $84m, compared to net loss of $6m in FY24
• Legacy O&Mii: net loss in FY25 due to interest costs attributable to legacy
rigs & impairment of fixed assets, partly offset by fair value gain on
Seatrium shares and FX gain, interest income & tax provision write-back
• Property related: profitable in FY25, driven by gains related to divestments
in China (Tianjin North Island) and Vietnam (Saigon Sports City & Palm City),
partly offset by operating & fair value losses on investment properties and
loss from development projects
• Investment & others: net loss in FY25 mainly from fair value loss on
investments, partly offset by gain from disposal of CGS
Net profit/(loss)
- 26.
- 27.
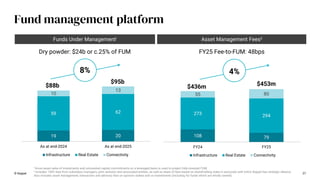
i Gross assetvalue of investments and uninvested capital commitments on a leveraged basis is used to project fully-invested FUM.
ii Includes 100% fees from subsidiary managers, joint ventures and associated entities, as well as share of fees based on shareholding stake in associate with which Keppel has strategic alliance.
Also includes asset management, transaction and advisory fees on sponsor stakes and co-investments (including for funds which are wholly owned).
108 79
273 294
55 80
FY24 FY25
Infrastructure Real Estate Connectivity
$436m $453m
19 20
59 62
10
13
As at end-2024 As at end-2025
Infrastructure Real Estate Connectivity
$88b
$95b
FY25 Fee-to-FUM: 48bps
Dry powder: $24b or c.25% of FUM
27
© Keppel
Fund management platform
Asset Management Feesii
Funds Under Managementi
8% 4%
- 28.
28
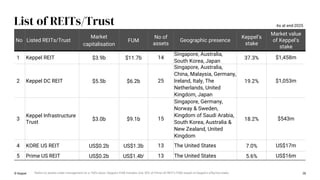
List of REITs/Trust
NoListed REITs/Trust
Market
capitalisation
FUM
No of
assets
Geographic presence
Keppel’s
stake
Market value
of Keppel’s
stake
1 Keppel REIT $3.9b $11.7b 14
Singapore, Australia,
South Korea, Japan
37.3% $1,458m
2 Keppel DC REIT $5.5b $6.2b 25
Singapore, Australia,
China, Malaysia, Germany,
Ireland, Italy, The
Netherlands, United
Kingdom, Japan
19.2% $1,053m
3
Keppel Infrastructure
Trust
$3.0b $9.1b 15
Singapore, Germany,
Norway & Sweden,
Kingdom of Saudi Arabia,
South Korea, Australia &
New Zealand, United
Kingdom
18.2% $543m
4 KORE US REIT US$0.2b US$1.3b 13 The United States 7.0% US$17m
5 Prime US REIT US$0.2b US$1.4bi 13 The United States 5.6% US$16m
As at end-2025
© Keppel i Refers to assets under management on a 100% basis. Keppel’s FUM includes only 30% of Prime US REIT’s FUM, based on Keppel’s effective stake.
- 29.
© Keppel 29
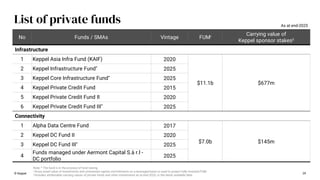
Listof private funds
No Funds / SMAs Vintage FUMi Carrying value of
Keppel sponsor stakesii
Infrastructure
1 Keppel Asia Infra Fund (KAIF) 2020
$11.1b $677m
2 Keppel Infrastructure Fund*
2025
3 Keppel Core Infrastructure Fund*
2025
4 Keppel Private Credit Fund 2015
5 Keppel Private Credit Fund II 2020
6 Keppel Private Credit Fund III*
2025
Connectivity
1 Alpha Data Centre Fund 2017
$7.0b $145m
2 Keppel DC Fund II 2020
3 Keppel DC Fund III*
2025
4
Funds managed under Aermont Capital S.à r.l -
DC portfolio
2025
Note: * The fund is in the process of fund raising.
i Gross asset value of investments and uninvested capital commitments on a leveraged basis is used to project fully-invested FUM.
ii Includes attributable carrying values of private funds and other investments as at end-2025, or the latest available date.
As at end-2025
- 30.
© Keppel 30
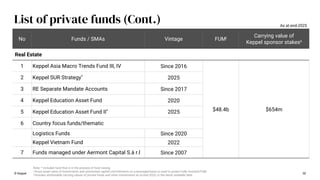
Listof private funds (Cont.)
No Funds / SMAs Vintage FUMi Carrying value of
Keppel sponsor stakesii
Real Estate
1 Keppel Asia Macro Trends Fund III, IV Since 2016
$48.4b $654m
2 Keppel SUR Strategy*
2025
3 RE Separate Mandate Accounts Since 2017
4 Keppel Education Asset Fund 2020
5 Keppel Education Asset Fund II* 2025
6 Country focus funds/thematic
Logistics Funds Since 2020
Keppel Vietnam Fund 2022
7 Funds managed under Aermont Capital S.à r.l Since 2007
Note: * Included fund that is in the process of fund raising.
i Gross asset value of investments and uninvested capital commitments on a leveraged basis is used to project fully-invested FUM.
ii Includes attributable carrying values of private funds and other investments as at end-2025, or the latest available date.
As at end-2025
- 31.
31
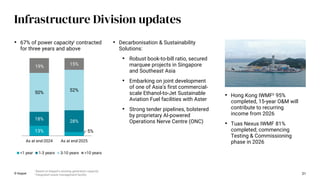
Infrastructure Division updates
©Keppel
i Based on Keppel’s existing generation capacity
ii Integrated waste management facility
• Decarbonisation & Sustainability
Solutions:
• Robust book-to-bill ratio, secured
marquee projects in Singapore
and Southeast Asia
• Embarking on joint development
of one of Asia's first commercial-
scale Ethanol-to-Jet Sustainable
Aviation Fuel facilities with Aster
• Strong tender pipelines, bolstered
by proprietary AI-powered
Operations Nerve Centre (ONC)
13% 5%
18% 28%
50% 52%
19% 15%
As at end-2024 As at end-2025
<1 year 1-3 years 3-10 years >10 years
• 67% of power capacityi contracted
for three years and above
• Hong Kong IWMFii 95%
completed, 15-year O&M will
contribute to recurring
income from 2026
• Tuas Nexus IWMF 81%
completed; commencing
Testing & Commissioning
phase in 2026
- 32.
32
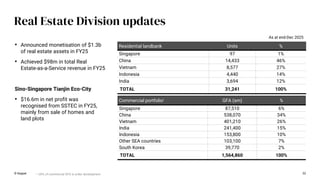
Real Estate Divisionupdates
Residential landbank Units %
Singapore 97 1%
China 14,433 46%
Vietnam 8,577 27%
Indonesia 4,440 14%
India 3,694 12%
TOTAL 31,241 100%
Commercial portfolioi GFA (sm) %
Singapore 87,510 6%
China 538,070 34%
Vietnam 401,210 26%
India 241,400 15%
Indonesia 153,800 10%
Other SEA countries 103,100 7%
South Korea 39,770 2%
TOTAL 1,564,860 100%
© Keppel
• Announced monetisation of $1.3b
of real estate assets in FY25
• Achieved $98m in total Real
Estate-as-a-Service revenue in FY25
Sino-Singapore Tianjin Eco-City
• $16.6m in net profit was
recognised from SSTEC in FY25,
mainly from sale of homes and
land plots
As at end-Dec 2025
i ~39% of commercial GFA is under development
- 33.
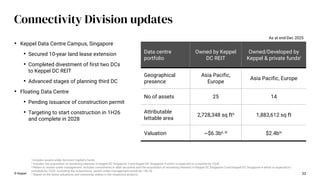
Data centre
portfolio
Owned byKeppel
DC REIT
Owned/Developed by
Keppel & private fundsi
Geographical
presence
Asia Pacific,
Europe
Asia Pacific, Europe
No of assets 25 14
Attributable
lettable area
2,728,348 sq ftii 1,883,612 sq ft
Valuation ~$6.3bii, iii $2.4biv
As at end-Dec 2025
i Includes assets under Aermont Capital’s funds.
ii Includes the acquisition of remaining interests in Keppel DC Singapore 3 and Keppel DC Singapore 4 which is expected to complete by 1Q26.
iii Refers to assets under management. Includes investments in debt securities and the acquisition of remaining interests in Keppel DC Singapore 3 and Keppel DC Singapore 4 which is expected to
complete by 1Q26. Excluding the acquisitions, assets under management would be ~$6.2b.
iv Based on the latest valuations and ownership stakes in the respective projects. 33
Connectivity Division updates
© Keppel
• Keppel Data Centre Campus, Singapore
• Secured 10-year land lease extension
• Completed divestment of first two DCs
to Keppel DC REIT
• Advanced stages of planning third DC
• Floating Data Centre
• Pending issuance of construction permit
• Targeting to start construction in 1H26
and complete in 2028
- 34.
Connectivity Division updates:
Technologysolutions & services
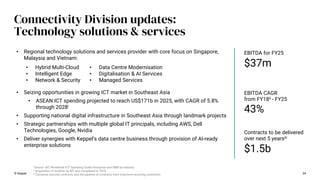
© Keppel 34
• Regional technology solutions and services provider with core focus on Singapore,
Malaysia and Vietnam:
i Source: IDC Worldwide ICT Spending Guide Enterprise and SMB by Industry
ii Acquisition of AsiaPac by M1 was completed in 2018
iii Comprise secured contracts and the pipeline of contracts from long-term recurring customers
• Hybrid Multi-Cloud
• Intelligent Edge
• Network & Security
• Data Centre Modernisation
• Digitalisation & AI Services
• Managed Services
$1.5b
Contracts to be delivered
over next 5 yearsiii
• Seizing opportunities in growing ICT market in Southeast Asia
• ASEAN ICT spending projected to reach US$171b in 2025, with CAGR of 5.8%
through 2028i
• Supporting national digital infrastructure in Southeast Asia through landmark projects
• Strategic partnerships with multiple global IT principals, including AWS, Dell
Technologies, Google, Nvidia
• Deliver synergies with Keppel’s data centre business through provision of AI-ready
enterprise solutions
$37m
EBITDA for FY25
43%
EBITDA CAGR
from FY18ii - FY25
- 35.
© Keppel 35
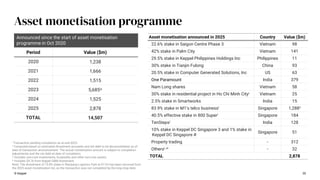
PeriodValue ($m)
2020 1,238
2021 1,666
2022 1,515
2023 5,685iv
2024 1,525
2025 2,878
TOTAL 14,507
Asset monetisation announced in 2025 Country Value ($m)
22.6% stake in Saigon Centre Phase 3 Vietnam 98
42% stake in Palm City Vietnam 141
29.5% stake in Keppel Philippines Holdings Inc Philippines 11
30% stake in Tianjin Fulong China 93
20.5% stake in Computer Generated Solutions, Inc US 63
One Paramount India 379
Nam Long shares Vietnam 58
30% stake in residential project in Ho Chi Minh Cityi Vietnam 25
2.5% stake in Smartworks India 15
83.9% stake in M1’s telco businessi Singapore 1,288ii
40.5% effective stake in 800 Superi Singapore 184
TenStepsi India 128
10% stake in Keppel DC Singapore 3 and 1% stake in
Keppel DC Singapore 4i Singapore 51
Property trading - 312
Othersi, iii - 32
TOTAL 2,878
Announced since the start of asset monetisation
programme in Oct 2020
Asset monetisation programme
i Transaction pending completion as at end-2025.
ii Computed based on estimated divestment proceeds and net debt to be deconsolidated as of
date of transaction announcement. The actual monetisation amount is subject to completion
adjustments and the net debt at date of completion.
iii Includes non-core investments, hospitality and other non-core assets.
iv Includes $4.7b from Keppel O&M divestment.
Note: The divestment of 75.8% stake in Wanjiang Logistics Park at $17m has been removed from
the 2025 asset monetisation list, as the transaction was not completed by the long-stop date.
- 36.
- 37.
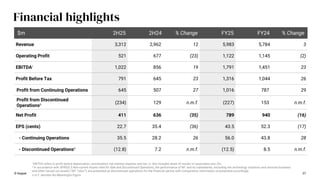
$m 2H25 2H24% Change FY25 FY24 % Change
Revenue 3,312 2,962 12 5,983 5,784 3
Operating Profit 521 677 (23) 1,122 1,145 (2)
EBITDAi 1,022 856 19 1,791 1,451 23
Profit Before Tax 791 645 23 1,316 1,044 26
Profit from Continuing Operations 645 507 27 1,016 787 29
Profit from Discontinued
Operationsii (234) 129 n.m.f. (227) 153 n.m.f.
Net Profit 411 636 (35) 789 940 (16)
EPS (cents) 22.7 35.4 (36) 43.5 52.3 (17)
- Continuing Operations 35.5 28.2 26 56.0 43.8 28
- Discontinued Operationsii (12.8) 7.2 n.m.f. (12.5) 8.5 n.m.f.
Financial highlights
n.m.f. denotes No Meaningful Figure
© Keppel 37
i EBITDA refers to profit before depreciation, amortisation, net interest expense and tax i.e. this includes share of results of associates and JVs.
ii In accordance with SFRS(I) 5 Non-current Assets Held for Sale and Discontinued Operations, the performance of M1 and its subsidiaries, excluding the technology solutions and services business
and other carved out assets (“M1 Telco”), are presented as discontinued operations for the financial period, with comparative information re-presented accordingly.
- 38.
165 189
614
752
FY24 FY25
AssetManagement Operating Income
$779m
$941m
688 749
31
107
60
85
FY24 FY25
Infrastructure Real Estate Connectivity
$941m
$779m
Recurring income by segment
Recurring income by source
38
© Keppel
Recurring income
i Includes asset management, transaction and advisory fees on sponsor stakes and co-investments.
i
21% 21%
- 39.
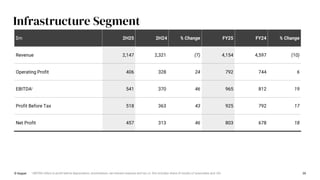
Infrastructure Segment
39
© Keppel
$m2H25 2H24 % Change FY25 FY24 % Change
Revenue 2,147 2,321 (7) 4,154 4,597 (10)
Operating Profit 406 328 24 792 744 6
EBITDAi 541 370 46 965 812 19
Profit Before Tax 518 363 43 925 792 17
Net Profit 457 313 46 803 678 18
i EBITDA refers to profit before depreciation, amortisation, net interest expense and tax i.e. this includes share of results of associates and JVs
- 40.
40
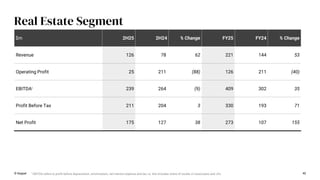
Real Estate Segment
©Keppel
$m 2H25 2H24 % Change FY25 FY24 % Change
Revenue 126 78 62 221 144 53
Operating Profit 25 211 (88) 126 211 (40)
EBITDAi 239 264 (9) 409 302 35
Profit Before Tax 211 204 3 330 193 71
Net Profit 175 127 38 273 107 155
i EBITDA refers to profit before depreciation, amortisation, net interest expense and tax i.e. this includes share of results of associates and JVs
- 41.
41
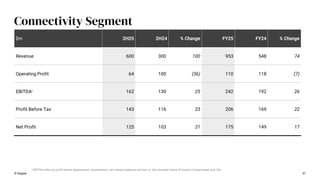
Connectivity Segment
© Keppel
$m2H25 2H24 % Change FY25 FY24 % Change
Revenue 600 300 100 953 548 74
Operating Profit 64 100 (36) 110 118 (7)
EBITDAi 162 130 25 242 192 26
Profit Before Tax 143 116 23 206 169 22
Net Profit 125 103 21 175 149 17
i EBITDA refers to profit before depreciation, amortisation, net interest expense and tax i.e. this includes share of results of associates and JVs
- 42.
42
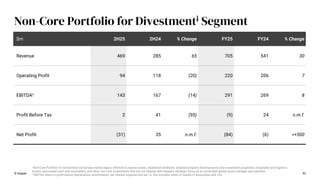
Non-Core Portfolio forDivestmenti Segment
© Keppel
i Non-Core Portfolio for Divestment comprises mainly legacy offshore & marine assets, residential landbank, selected property developments and investment properties, hospitality and logistics
assets, associated cash and receivables, and other non-core investments that are not aligned with Keppel’s strategic focus as an asset-light global asset manager and operator.
ii EBITDA refers to profit before depreciation, amortisation, net interest expense and tax i.e. this includes share of results of associates and JVs
$m 2H25 2H24 % Change FY25 FY24 % Change
Revenue 469 285 65 705 541 30
Operating Profit 94 118 (20) 220 206 7
EBITDAii 143 167 (14) 291 269 8
Profit Before Tax 2 41 (95) (9) 24 n.m.f.
Net Profit (31) 35 n.m.f. (84) (6) >+500
- 43.
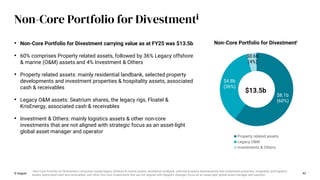
• Non-Core Portfoliofor Divestment carrying value as at FY25 was $13.5b
• 60% comprises Property related assets, followed by 36% Legacy offshore
& marine (O&M) assets and 4% Investment & Others
• Property related assets: mainly residential landbank, selected property
developments and investment properties & hospitality assets, associated
cash & receivables
• Legacy O&M assets: Seatrium shares, the legacy rigs, Floatel &
KrisEnergy, associated cash & receivables
• Investment & Others: mainly logistics assets & other non-core
investments that are not aligned with strategic focus as an asset-light
global asset manager and operator
© Keppel 43
Non-Core Portfolio for Divestmenti
$8.1b
(60%)
$4.8b
(36%)
$0.6b
(4%)
Property related assets
Legacy O&M
Investments & Others
$13.5b
i Non-Core Portfolio for Divestment comprises mainly legacy offshore & marine assets, residential landbank, selected property developments and investment properties, hospitality and logistics
assets, associated cash and receivables, and other non-core investments that are not aligned with Keppel’s strategic focus as an asset-light global asset manager and operator.
Non-Core Portfolio for Divestmenti
- 44.
44
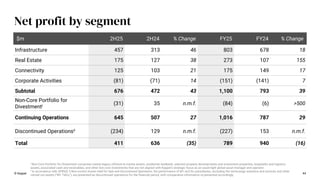
Net profit bysegment
$m 2H25 2H24 % Change FY25 FY24 % Change
Infrastructure 457 313 46 803 678 18
Real Estate 175 127 38 273 107 155
Connectivity 125 103 21 175 149 17
Corporate Activities (81) (71) 14 (151) (141) 7
Subtotal 676 472 43 1,100 793 39
Non-Core Portfolio for
Divestmenti (31) 35 n.m.f. (84) (6) >500
Continuing Operations 645 507 27 1,016 787 29
Discontinued Operationsii (234) 129 n.m.f. (227) 153 n.m.f.
Total 411 636 (35) 789 940 (16)
© Keppel
i Non-Core Portfolio for Divestment comprises mainly legacy offshore & marine assets, residential landbank, selected property developments and investment properties, hospitality and logistics
assets, associated cash and receivables, and other non-core investments that are not aligned with Keppel’s strategic focus as an asset-light global asset manager and operator.
ii In accordance with SFRS(I) 5 Non-current Assets Held for Sale and Discontinued Operations, the performance of M1 and its subsidiaries, excluding the technology solutions and services and other
carved out assets (“M1 Telco”), are presented as discontinued operations for the financial period, with comparative information re-presented accordingly.
- 45.
© Keppel 45
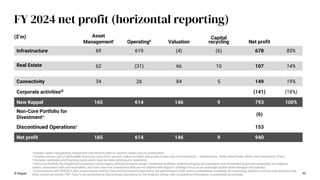
FY2024 net profit (horizontal reporting)
i Includes asset management, transaction and advisory fees on sponsor stakes and co-investments.
ii Includes returns (net of attributable financing costs) from sponsor stakes (in listed and private funds) and co-investments – Infrastructure -$44m, Real Estate -$50m, and Connectivity $16m.
iii Includes overheads and financing costs which have not been attributed to segments.
iv Non-Core Portfolio for Divestment comprises mainly legacy offshore & marine assets, residential landbank, selected property developments and investment properties, hospitality and logistics
assets, associated cash and receivables, and other non-core investments that are not aligned with Keppel’s strategic focus as an asset-light global asset manager and operator.
v In accordance with SFRS(I) 5 Non-current Assets Held for Sale and Discontinued Operations, the performance of M1 and its subsidiaries, excluding the technology solutions and services business and
other carved out assets (“M1 Telco”), are presented as discontinued operations for the financial period, with comparative information re-presented accordingly.
($’m) Asset
Managementi Operatingii Valuation
Capital
recycling Net profit
Infrastructure 69 619 (4) (6) 678 85%
Real Estate 62 (31) 66 10 107 14%
Connectivity 34 26 84 5 149 19%
Corporate activitiesiii (141) (18%)
New Keppel 165 614 146 9 793 100%
Non-Core Portfolio for
Divestmentiv (6)
Discontinued Operationsv 153
Net profit 165 614 146 9 940
- 46.
© Keppel 46
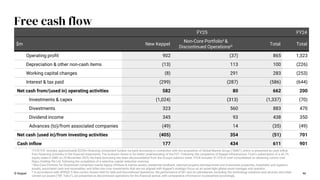
Freecash flow
i FY25 FCF includes approximately $235m financing component funded via bank borrowing in connection with the acquisition of Global Marine Group (“GMG”), which is presented as cash inflow
from financing activities in the financial statements. The inclusion herein is for better understanding of the FCF. Following the completion of Keppel Infrastructure Trust’s subscription of a 46.7%
equity stake in GMG on 25 November 2025, the bank borrowing has been deconsolidated from the Group’s balance sheet. FY24 includes $1.07b of cash consolidated on obtaining control over
Rigco Holding Pte Ltd. following the completion of a selective capital reduction exercise.
ii Non-Core Portfolio for Divestment comprises mainly legacy offshore & marine assets, residential landbank, selected property developments and investment properties, hospitality and logistics
assets, associated cash and receivables, and other non-core investments that are not aligned with Keppel’s strategic focus as an asset-light global asset manager and operator.
iii In accordance with SFRS(I) 5 Non-current Assets Held for Sale and Discontinued Operations, the performance of M1 and its subsidiaries, excluding the technology solutions and services and other
carved out assets (“M1 Telco”), are presented as discontinued operations for the financial period, with comparative information re-presented accordingly.
FY25 FY24
$m New Keppel
Non-Core Portfolioii &
Discontinued Operationsiii Total Total
Operating profit 902 (37) 865 1,323
Depreciation & other non-cash items (13) 113 100 (226)
Working capital changes (8) 291 283 (253)
Interest & tax paid (299) (287) (586) (644)
Net cash from/(used in) operating activities 582 80 662 200
Investments & capex (1,024) (313) (1,337) (70)
Divestments 323 560 883 470
Dividend income 345 93 438 350
Advances (to)/from associated companies (49) 14 (35) (49)
Net cash (used in)/from investing activities (405) 354 (51) 701
Cash inflow 177 434 611 901
- 47.
- 48.
48
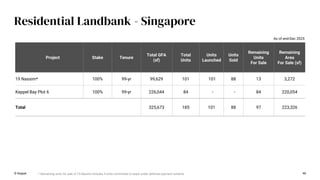
Residential Landbank -Singapore
* Remaining units for sale of 19 Nassim includes 4 units committed to buyer under deferred payment scheme
As of end-Dec 2025
© Keppel
Project Stake Tenure
Total GFA
(sf)
Total
Units
Units
Launched
Units
Sold
Remaining
Units
For Sale
Remaining
Area
For Sale (sf)
19 Nassim* 100% 99-yr 99,629 101 101 88 13 3,272
Keppel Bay Plot 6 100% 99-yr 226,044 84 - - 84 220,054
Total 325,673 185 101 88 97 223,326
- 49.
49
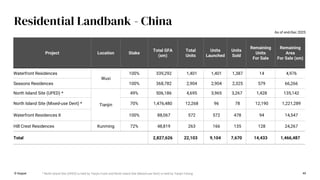
Residential Landbank -China
Project Location Stake
Total GFA
(sm)
Total
Units
Units
Launched
Units
Sold
Remaining
Units
For Sale
Remaining
Area
For Sale (sm)
Waterfront Residences
Wuxi
100% 339,292 1,401 1,401 1,387 14 4,976
Seasons Residences 100% 368,782 2,904 2,904 2,325 579 66,266
North Island Site (UPED) *
Tianjin
49% 506,186 4,695 3,965 3,267 1,428 135,142
North Island Site (Mixed-use Devt) * 70% 1,476,480 12,268 96 78 12,190 1,221,289
Waterfront Residences II 100% 88,067 572 572 478 94 14,547
Hill Crest Residences Kunming 72% 48,819 263 166 135 128 24,267
Total 2,827,626 22,103 9,104 7,670 14,433 1,466,487
As of end-Dec 2025
© Keppel * North Island Site (UPED) is held by Tianjin Fushi and North Island Site (Mixed-use Devt) is held by Tianjin Fulong
- 50.
50
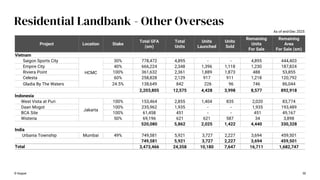
Residential Landbank -Other Overseas
Project Location Stake
Total GFA
(sm)
Total
Units
Units
Launched
Units
Sold
Remaining
Units
For Sale
Remaining
Area
For Sale (sm)
Vietnam
Saigon Sports City
HCMC
30% 778,472 4,895 - - 4,895 444,403
Empire City 40% 666,224 2,348 1,396 1,118 1,230 187,824
Riviera Point 100% 361,632 2,361 1,889 1,873 488 53,855
Celesta 60% 258,828 2,129 917 911 1,218 120,792
Gladia By The Waters 24.5% 138,649 842 226 96 746 86,044
2,203,805 12,575 4,428 3,998 8,577 892,918
Indonesia
West Vista at Puri
Jakarta
100% 153,464 2,855 1,404 835 2,020 83,774
Daan Mogot 100% 235,962 1,935 - - 1,935 193,489
BCA Site 100% 61,458 451 - - 451 49,167
Wisteria 50% 69,196 621 621 587 34 3,898
520,080 5,862 2,025 1,422 4,440 330,328
India
Urbania Township Mumbai 49% 749,581 5,921 3,727 2,227 3,694 459,501
749,581 5,921 3,727 2,227 3,694 459,501
Total 3,473,466 24,358 10,180 7,647 16,711 1,682,747
As of end-Dec 2025
© Keppel
- 51.
51
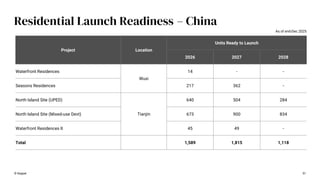
Residential Launch Readiness– China
As of end-Dec 2025
Project Location
Units Ready to Launch
2026 2027 2028
Waterfront Residences
Wuxi
14 - -
Seasons Residences 217 362 -
North Island Site (UPED)
Tianjin
640 504 284
North Island Site (Mixed-use Devt) 673 900 834
Waterfront Residences II 45 49 -
Total 1,589 1,815 1,118
© Keppel
- 52.
52
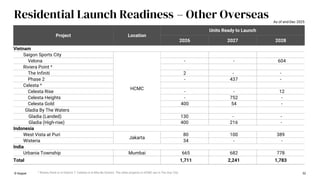
Residential Launch Readiness– Other Overseas
Project Location
Units Ready to Launch
2026 2027 2028
Vietnam
Saigon Sports City
HCMC
Velona - - 604
Riviera Point ^
The Infiniti 2 - -
Phase 2 - 437 -
Celesta ^
Celesta Rise - - 12
Celesta Heights - 752 -
Celesta Gold 400 54 -
Gladia By The Waters
Gladia (Landed) 130 - -
Gladia (High-rise) 400 216 -
Indonesia
West Vista at Puri
Jakarta
80 100 389
Wisteria 34 - -
India
Urbania Township Mumbai 665 682 778
Total 1,711 2,241 1,783
As of end-Dec 2025
^ Riviera Point is in District 7. Celesta is in Nha Be District. The other projects in HCMC are in Thu Duc City
© Keppel
- 53.
53
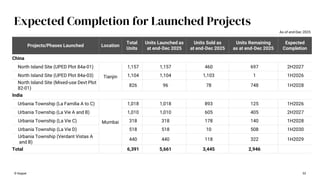
Expected Completion forLaunched Projects
Projects/Phases Launched Location
Total
Units
Units Launched as
at end-Dec 2025
Units Sold as
at end-Dec 2025
Units Remaining
as at end-Dec 2025
Expected
Completion
China
North Island Site (UPED Plot 84a-01)
Tianjin
1,157 1,157 460 697 2H2027
North Island Site (UPED Plot 84a-03) 1,104 1,104 1,103 1 1H2026
North Island Site (Mixed-use Devt Plot
82-01)
826 96 78 748 1H2028
India
Urbania Township (La Familia A to C)
Mumbai
1,018 1,018 893 125 1H2026
Urbania Township (La Vie A and B) 1,010 1,010 605 405 2H2027
Urbania Township (La Vie C) 318 318 178 140 1H2028
Urbania Township (La Vie D) 518 518 10 508 1H2030
Urbania Township (Verdant Vistas A
and B)
440 440 118 322 1H2029
Total 6,391 5,661 3,445 2,946
© Keppel
As of end-Dec 2025
- 54.
54
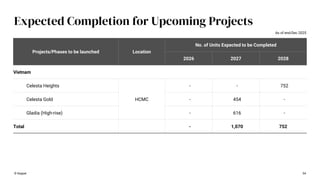
Expected Completion forUpcoming Projects
Projects/Phases to be launched Location
No. of Units Expected to be Completed
2026 2027 2028
Vietnam
Celesta Heights
HCMC
- - 752
Celesta Gold - 454 -
Gladia (High-rise) - 616 -
Total - 1,070 752
© Keppel
As of end-Dec 2025
- 55.
TBC: To beconfirmed
^ Excluding land cost
* Investment cost for 40% stake
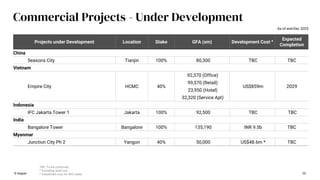
Commercial Projects - Under Development
Projects under Development Location Stake GFA (sm) Development Cost ^
Expected
Completion
China
Seasons City Tianjin 100% 80,300 TBC TBC
Vietnam
Empire City HCMC 40%
92,370 (Office)
US$859m 2029
99,370 (Retail)
23,950 (Hotel)
32,320 (Service Apt)
Indonesia
IFC Jakarta Tower 1 Jakarta 100% 92,500 TBC TBC
India
Bangalore Tower Bangalore 100% 135,190 INR 9.5b TBC
Myanmar
Junction City Ph 2 Yangon 40% 50,000 US$48.6m * TBC
55
© Keppel
As of end-Dec 2025
- 56.
* AEI completedin Dec 2021
** Renovation completed in 2018
56
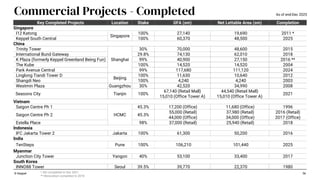
Commercial Projects - Completed
Key Completed Projects Location Stake GFA (sm) Net Lettable Area (sm) Completion
Singapore
I12 Katong
Singapore
100% 27,140 19,690 2011 *
Keppel South Central 100% 60,370 48,500 2025
China
Trinity Tower
Shanghai
30% 70,000 48,600 2015
International Bund Gateway 29.8% 74,130 62,010 2018
K Plaza (formerly Keppel Greenland Being Fun) 99% 40,900 27,150 2016 **
The Kube 100% 14,520 14,520 2004
Park Avenue Central 99% 117,680 111,120 2024
Linglong Tiandi Tower D
Beijing
100% 11,630 10,640 2012
Shangdi Neo 100% 4,240 4,240 2003
Westmin Plaza Guangzhou 30% 42,520 34,990 2008
Seasons City Tianjin 100%
67,140 (Retail Mall)
15,010 (Office Tower A)
44,540 (Retail Mall)
15,010 (Office Tower A)
2021
Vietnam
Saigon Centre Ph 1
HCMC
45.3% 17,200 (Office) 11,680 (Office) 1996
Saigon Centre Ph 2 45.3%
55,000 (Retail) 37,980 (Retail) 2016 (Retail)
44,000 (Office) 34,000 (Office) 2017 (Office)
Estella Place 98% 37,000 (Retail) 25,940 (Retail) 2018
Indonesia
IFC Jakarta Tower 2 Jakarta 100% 61,300 50,200 2016
India
TenSteps Pune 100% 106,210 101,440 2025
Myanmar
Junction City Tower Yangon 40% 53,100 33,400 2017
South Korea
INNO88 Tower Seoul 39.5% 39,770 22,370 1980
© Keppel
As of end-Dec 2025
- 57.
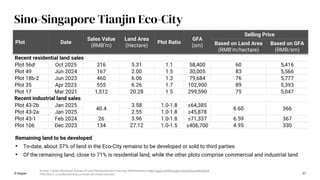
Plot Date
Sales Value
(RMB’m)
LandArea
(Hectare)
Plot Ratio
GFA
(sm)
Selling Price
Based on Land Area
(RMB’m/hectare)
Based on GFA
(RMB/sm)
Recent residential land sales
Plot 56di Oct 2025 316 5.31 1.1 58,400 60 5,416
Plot 49 Jun 2024 167 2.00 1.5 30,005 83 5,566
Plot 18b-2 Jun 2023 460 6.06 1.3 79,684 76 5,777
Plot 35 Apr 2023 555 6.26 1.7 102,900 89 5,393
Plot 17 Mar 2021 1,512 20.28 1.5 299,590 75 5,047
Recent industrial land sales
Plot 43-2b Jan 2025
40.4
3.58 1.0-1.8 ≤64,385
6.60 366
Plot 43-2a Jan 2025 2.55 1.0-1.8 ≤45,878
Plot 43-1 Feb 2024 26 3.96 1.0-1.8 ≤71,337 6.59 367
Plot 106 Dec 2023 134 27.12 1.0-1.5 ≤406,700 4.95 330
Source: Tianjin Municipal Bureau of Land Resources and Housing Administration http://ggzy.zwfwb.tj.gov.cn/jyxxky/index.jhtml
i Plot 56d is a residential and commercial mixed-use plot
Remaining land to be developed
• To-date, about 37% of land in the Eco-City remains to be developed or sold to third parties
• Of the remaining land, close to 71% is residential land, while the other plots comprise commercial and industrial land
© Keppel 57
Sino-Singapore Tianjin Eco-City
- 58.
© Keppel 58
Disclaimer
NOTFOR RELEASE, PUBLICATION OR DISTRIBUTION, IN WHOLE OR IN PART, IN, INTO OR FROM ANY
JURISDICTION WHERE TO DO SO WOULD CONSTITUTE A VIOLATION OF THE RELEVANT LAWS OF THAT
JURISDICTION. THIS PRESENTATION SHALL NOT CONSTITUTE AN OFFER TO SELL OR A SOLICITATION
OF AN OFFER TO SELL, SUBSCRIBE FOR OR BUY SECURITIES IN ANY JURISDICTION, INCLUDING IN THE
UNITED STATES.
This presentation is for information purposes only and does not have regard to your specific investment
objectives, financial situation or your particular needs. Any information in this presentation is not to be
construed as investment or financial advice and does not constitute an invitation, offer or solicitation of any
offer to acquire, purchase or subscribe for securities or other financial instruments in Keppel Ltd. (“Keppel”).
The past performance of Keppel is not indicative of the future performance of Keppel. You should exercise
judgment in your own financial decisions. If in doubt, please consult with your professional advisers.
Unless explicitly indicated otherwise, all monetary values denoted as ‘$’ within this presentation are to be
interpreted as referring to Singapore dollars.

 Most read